Widespread atomic gas emission reveals the rotation
of the Pictoris disk111Based on observations collected at the European Southern Observatory, Chile
Abstract
We present high resolution Na I D spectroscopy of the Pic disk, and the resonantly scattered sodium emission can be traced from less than 30 AU to at least 140 AU from the central star. This atomic gas is co-existent with the dust particles, suggestive of a common origin or source. The disk rotates towards us in the south-west and away from us in the north-east. The velocity pattern of the gas finally provides direct evidence that the faint linear feature seen in images of the star is a circumstellar disk in Keplerian rotation. From modelling the spatial distribution of the Na I line profiles we determine the effective dynamical mass to be () M⊙, which is smaller than the stellar mass, 1.75 M⊙. We ascribe this difference to the gravity opposing radiation pressure in the Na I lines. We argue that this is consistent with the fact that Na is nearly completely ionised throughout the disk (Na I/Na ). The total column density of sodium gas is (Na)=.
1 Introduction
The Pic disk has been the subject of intense studies ever since it was shown to have excess emission in the thermal infrared by the IRAS mission (Aumann, 1985). The dust particles giving rise to the infrared emission also scatter the stellar light and coronographic techniques revealed an elongated structure (Smith and Terrile, 1984) that recently has been extremely well characterised by means of HST observations (Heap et al., 2000). Although the general impression of these images is a high degree of smoothness and symmetry, Heap et al. (2000) show that the peak of the elongated scattered emission has wiggles that suggests that the inner part of the disk is tilted relative to the outer part. There is also evidence for asymmetries and structures in the radial light distribution of this inner disk. Asymmetries have also been observed in the mid-IR (Pantin, Lagage and Artymowicz, 1997).
These asymmetries and the remarkable discovery (Vidal-Madjar et al., 1994; Lagrange, Backman and Artymowicz, 2000) of comet-like bodies occasionally occulting the star and giving rise to high velocity absorption lines reveal dynamical activity that generally is interpreted as evidence for planetary disturbances (Artymowicz, 1997; Augereau et al., 2001).
When it comes to the gas component in the disk, the situation is at present confusing. Absorption spectroscopy in the optical and UV shows a stable component at the same radial velocity as the star (Vidal-Madjar et al., 1986; Lagrange et al., 1998). One would expect radial expansion of this gas, caused by the radiation pressure of the star and as a possible explanation a ring of atomic hydrogen has been proposed (Lagrange et al., 1998). If present, such a ring must be close to the star as widespread H I is not detected at 21 cm (Freudling et al., 1995). CO has been detected by means of UV spectroscopy (Roberge, Feldman and Lagrange, 2000) but sensitive searches for CO emission in the radio region have failed to detect this molecule (Liseau and Artymowicz, 1998). Molecular hydrogen is not detected in UV absorption spectra (Lecavelier des Etangs et al., 2001) but on the other hand, ISO/SWS spectroscopy (Thi et al., 2001) indicates H2 emission lines that, if real (the S/N is low), require large amounts of molecular hydrogen in a spatial distribution that has a void in the line of sight towards the star.
So far it has not been possible to directly probe the velocity pattern along the disk, lacking the detection of spatially resolved gas emission (except a possible detection of Fe II emission very close to the star, Lecavelier des Etangs, Hobbs and Vidal-Madjar (2000)). In the present paper we report the detection of the resonance Na I doublet lines at 5990 Å and 5996 Å.
2 Observations and results
Pic was observed on January 2-4, 2001, with the Echelle spectrograph EMMI on the 3.5 m NTT (New Technology Telescope) at ESO-La Silla, Chile. For the Na I D1/D2 observations, we used a 5 arcmin long slit and therefore omitted the cross-disperser. Instead, we inserted an order-sorting interference filter, which was centred on 5890 Å and 60 Å wide. We have measured the filter profile and are in control of the leakage from the neighbouring orders (less than 3% and 4% respectively). With the wavelength resolution of ( = 5 km s-1) this instrumental set-up can be viewed as some sort of a ‘spectroscopic coronograph’, where the high dispersion is used to prevent the saturation of the detector (CCD) by the very bright stellar point source. Still, the overheads of the observing time were dominated by detector readout times, since integration times of individual observations were typically only 300 s. The total integration time was chosen such that the co-added spectra should permit the detection of the faint light scattered off the disk by the dust, which was also achieved. Parallel with the disk (at position angle 3075, Kalas and Jewitt (1995)), this time was 2.5 hr, whereas we spent in total 36 min for observations with the slit oriented perpendicular to the disk. The seeing values determined from these observations are 12, whereas the width of the slit was kept at 10 in order to sample (on the CCD) the spectral resolution at the Nyquist frequency.
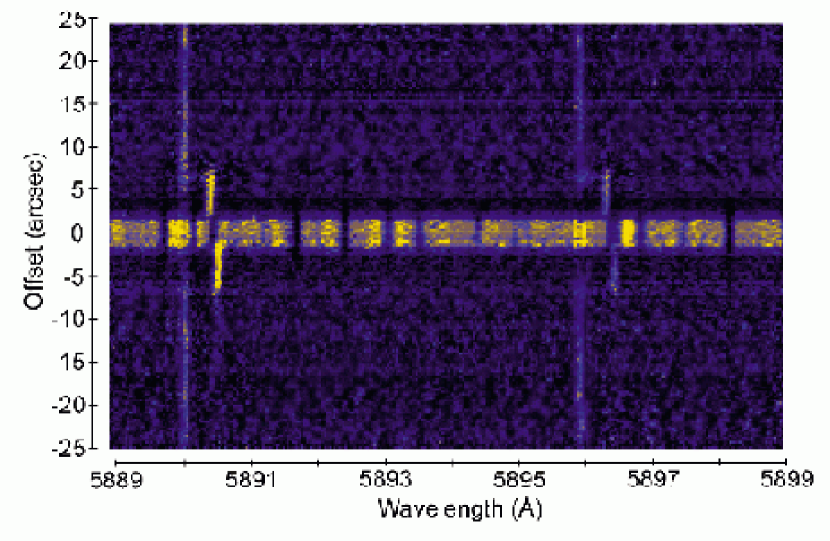
In addition to the two telluric emission lines, the parallel observations also show spatially extended Na I D emission, both lines consistently redshifted to the heliocentric velocity of Pic (+21 km s-1). These observations are displayed in Fig. 1. In Fig. 2, the distribution of the Na I emission along the slit, on either side of the stellar spectrum, is compared to the corresponding distribution of the dust. Evidently, both gas and dust show similar light distributions, suggestive of the co-existence of these species in the Pic disk.
3 Discussion
3.1 The rotation of the disk
We first address the question of Keplerian rotation. Justified by the indications that there is no significant outward motion, we simply assume circular rotation. The distance to the star is 19.3 pc (Crifo et al., 1997). In order to interpret the velocity pattern, we must first find a radial density distribution of the Na gas component that results in the observed light distribution. For the moment, we ignore the difference between the two sides (Fig. 2) and use the average light distribution. Adopting a functional relation that is suitable for a broken power law:
where (Na I) is the volume density of Na I at the radial distance (within the 1″ slit), we get a quite satisfactory fit to the observed projected light distribution with the following numerical values: AU, and . The distribution function is shown in Fig. 3 and the fit to the observations in Fig. 4.
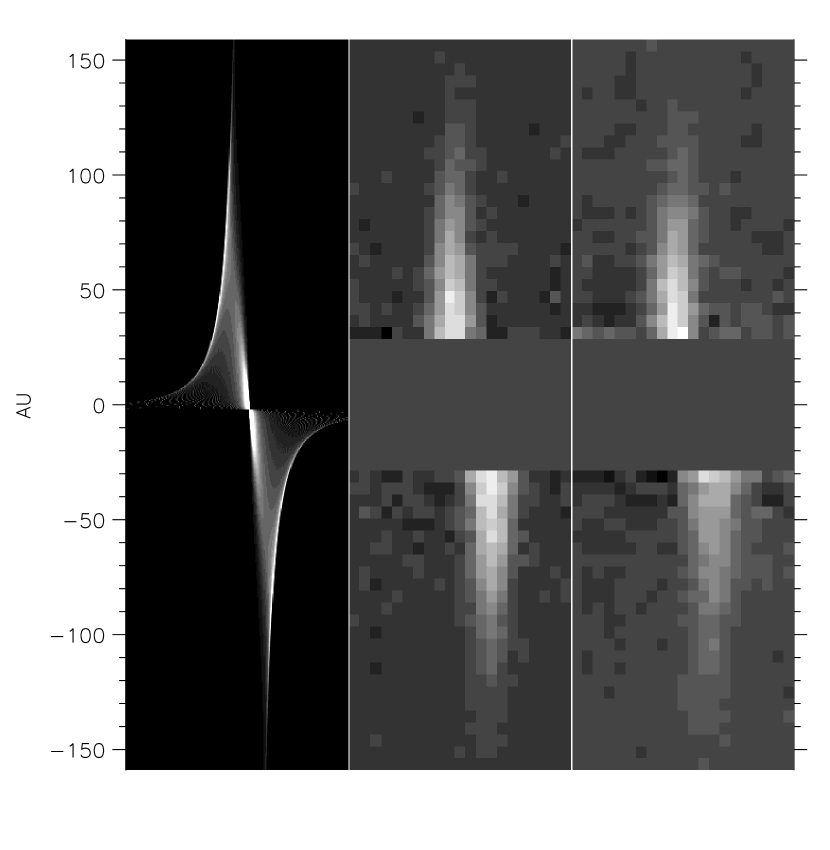
Our observations are consistent with circular Keplerian rotation of the gas (see Fig. 5), were we have taken the measured seeing and spectral instrumental profile (using telluric absorption lines) into account. The best-fit mass, in a -sense, equals () M⊙. This model mass is less than that deduced from the stellar position in the HR-diagram, viz. 1.75 M⊙ (e.g. Crifo et al. (1997)). It is possible that this difference is due to radiation pressure (see Sect. 3.3).
3.2 The light budget
The origin of the “stable gas” absorption has been extensively discussed and there are arguments for a location very close to the star (Lagrange et al., 1998). If, on the other hand, the sodium emission far out in the disk is caused by resonance scattering of stellar radiation then, at least partly, the “stable gas” absorption must originate throughout the disk along the line of sight. We measure an Na I D2 equivalent width in absorption of 9.4 mÅ, implying a column density of , in agreement with previous observations by Vidal-Madjar et al. (1986). In emission, a total equivalent width of 0.72 mÅ is obtained. This latter number is of course a lower limit as it does not include any line emission originating outside the one arcsecond wide slit of the spectrograph. It means that the disk, as seen from the star, must occupy at least a latitudinal angle of 88. We start to detect the line emission at a distance of 30 AU and at this distance the required thickness of the disk would be at least 4.6 AU. As the slit width covers 19 AU these estimates do not lead to any contradiction regarding the light budget under the assumption of resonance scattering. On the other hand, there is not much margin for the proposed dense H I ring (Lagrange et al., 1998) to contribute to the stable Na I absorption lines.
3.3 The radiation pressure
How, then, can we understand why the radiation pressure does not quickly accelerate the Na I outwards in the same sense as it does, for instance, in comets (cf. Cremonese et al. (1997))? We first note that the momentum transfer caused by the resonance scattering vastly exceeds the gravity. Assuming a stellar mass of 1.75 M⊙ we find that the force caused by the radiation pressure exceeds the gravitational force by a factor of 300. A possible explanation why we do not observe a radial velocity component is the presence of a relatively dense gas component. However, this would require very large amounts of gas far out in the disk. As an example we consider the distance of 100 AU. Our observations exclude a radial velocity component exceeding 5 km s-1 and assuming that the main gas component is atomic hydrogen we find that the gas density must be at least . As the thickness (or scale height) of the gas component of the disk is unknown, it is hard to judge if this minimum density is in conflict with other observations.
Even though we cannot at present rule out this explanation for the balancing of the radiation pressure, we propose an alternative: Due to the low ionisation potential of Na I (5.1 eV), one would expect the stellar UV radiation to provide a high degree of ionisation. As Na II lacks strong transitions within the range of the stellar spectrum, the radiation pressure on the ionised sodium gas does not counterweigh the gravitation. Thus, if the gas density is low, a sodium atom will quickly take up speed outwards. But it will stay neutral just for a short time and then, as singly ionised, it will have a long time to adapt to the motion of the main gas component.
To quantitatively test this idea we estimate the degree of ionisation. As we can exclude higher ionisation stages (the ionisation potential is 47 eV for Na II) the equation of ionisation equilibrium reads
where is the dilution factor of the radiation density at the distance from the star compared to that at the stellar surface, is the ionisation rate at the stellar surface, is the total recombination coefficient and the electron density. Using a model atmosphere from Allard et al. (2000) and cross sections from Cunto et al. (1993) we estimate . Assuming 100 K as a typical electron temperature in the disk we get (Verner and Ferland, 1996). The electron density remains to be estimated. The stellar far-UV continuum does not suffice to ionise H, He (if at all present), C, N and O. Assuming solar abundances (Holweger and Rentzsch-Holm, 1995) for elements with ionisation potentials eV (longward of 1500 Å) we estimate . If we, finally, assume a constant thickness of the disk (the half power width of the dust disk is in fact close to constant from 30 AU and outwards, see Heap et al. (2000)) we can use the radial distribution derived for Na I in combination with the column density to derive the degree of ionisation as a function of the distance to the star. We find that sodium is indeed highly ionised with throughout the disk. In Fig. 6, we show the radial distribution of (Na I) and (Na II). These analytical results have been confirmed by self-consistent photoionisation computations, which produce the observed line fluxes. The details will be given in a forthcoming article.
We conclude that the radiation pressure on sodium, averaged over time, would be small. We must, however, also estimate what speed a neutral atom would typically achieve until it becomes ionised. Both the UV continuum and the sodium D lines are optically thin throughout the disk and thus both ionisation rate and the resonance scattering rate roughly scale as the inverse square of the distance to the star. Therefore, the number of scattered photons per period of neutral state is constant and we find that typically scattering events will occur until an atom becomes ionised. The scattered radiation is essentially isotropic and the transferred momentum would cause an outward velocity of merely 0.4 km s-1. After that, there will be a long period of time during which the sodium ion will interact with the main gas components and conform to the general velocity pattern, be it basically circular Keplerian rotation or not. This also means that the radiation pressure may cause a slow, stepwise motion of each sodium atom outwards resulting in a net flow from the inner to the outer parts of the disk.
3.4 The amount of atomic gas in the disk
From the radial distribution of Na I we were able to derive the radial distribution of Na II (Fig. 6). The number density is typically (Na)= and the column density from 30 to 140 AU is (Na)=. If the Na/H ratio were solar, this would indicate a hydrogen column density of (H) = . Further discussion of these aspects will be deferred to a forthcoming paper.
4 Conclusions
We have observed Na I D1 and D2 emission along the disk of Pic from a projected distance of 30 to 140 AU. The velocity pattern mimics circular Keplerian rotation, but the deduced mass is somewhat lower than that expected for an A5V star (1.4 compared to 1.75 M⊙). This difference is probably due to radiation pressure that to some extent counterbalances gravity. We find that the sodium gas is mainly ionised, with Na II/Na I around and for this reason, the radiation pressure does not accelerate the sodium gas component to high velocities. This is simply because the number of scattering events during a neutral period of a sodium atom only would suffice to give an outward velocity of 0.4 km s-1 and then, during the typically times longer period of singly ionised state, the radiation pressure is negligible. So, there is plenty of time for the sodium gas to conform, through gas friction, to the motion of the main gas component (i.e. H, O, C and N) that has only a weak direct interaction with the radiation field.
It is, finally, clear that the observations presented in the present Letter only mark a starting point of spectroscopic investigations as both the spectral and the spatial resolutions as well as the straylight level can be significantly improved upon. In addition, other lines like the Ca II H & K doublet and a number of resonance lines in the UV, accessible from e.g. the HST, will probably be detected in the disk.
References
- Allard et al. (2000) Allard, F., Hauschildt, P. H., & Schweitzer, A. 2000, ApJ, 539, 366
- Artymowicz (1997) Artymowicz, P. 1997, Ann. Rev. Earth. Planet Sci., 25,175
- Augereau et al. (2001) Augereau, J.C., Nelson, R.P., Lagrange A.M., Papaloizou, J.C.B. and Mouillet, D. 2001, A&A, in press
- Aumann (1985) Aumann, H.H. 1985, PASP, 97, 885
- Cremonese et al. (1997) Cremonese, G., Boehnhardt, H., Crovisier, J. et al. 1997, ApJ, 490, L199
- Crifo et al. (1997) Crifo, F., Vidal-Madjar, A., Lallement, R., Ferlet, R. and Gerbaldi, M. 1997, A&A, 320, L29
- Cunto et al. (1993) Cunto, W., Mendoza, C., Ochsenbein, F., Zeippen, C. J. 1993, A&A, 275, L5
- Freudling et al. (1995) Freudling, W., Lagrange, A.-M., Vidal-Madjar, A., Ferlet, R., Forveille, T., A&A, 301, 231
- Heap et al. (2000) Heap, S. R., Lindler, D. J., Lanz, T. M. 2000, ApJ, 539, 435
- Holweger and Rentzsch-Holm (1995) Holweger, H., Rentzsch-Holm, I. 1995, A&A, 303, 819
- Kalas and Jewitt (1995) Kalas, P., Jewitt, D. 1995, AJ, 110, 794
- Lagrange, Backman and Artymowicz (2000) Lagrange, A.-M., Backman, D. E., Artymowicz, P. 2000, in Protostars and Planets IV (eds Mannings, V., Boss, A.P. and Russell, S.S.) 639-672 (Univ. Arizona Press, Tucson)
- Lagrange et al. (1998) Lagrange, A.-M., Beust, H., Mouillet, D., et al. 1998, A&A, 330, 1091
- Lecavelier des Etangs, Hobbs and Vidal-Madjar (2000) Lecavelier des Etangs, A., Hobbs, L. M., Vidal-Madjar, A. 2000, A&A, 356, 691
- Lecavelier des Etangs et al. (2001) Lecavelier des Etangs, A., Vidal-Madjar, A., Roberge, A., et al. 2001, Nature, 412, 706
- Liseau and Artymowicz (1998) Liseau, R., Artymowicz, P. 1998, A&A, 334, 935
- Pantin, Lagage and Artymowicz (1997) Pantin, E., Lagage, P. O., Artymowicz, P. 1997, A&A, 327, 1123
- Roberge, Feldman and Lagrange (2000) Roberge, A., Feldman, P. D., Lagrange, A.-M. 2000, ApJ, 538, 904
- Smith and Terrile (1984) Smith, B. A., Terrile, R. J. 1984, Science, 226, 1421
- Thi et al. (2001) Thi, W. F., Blake, G. A., van Dishoeck, E. F., et al. 2001, Nature, 409, 60
- Verner and Ferland (1996) Verner, D. A., Ferland, G. J. 1996, ApJS, 103, 467
- Vidal-Madjar et al. (1986) Vidal-Madjar, A., Hobbs, L. M., Ferlet, R., Gry, C., Albert, C. E. 1986, A&A, 167, 325
- Vidal-Madjar et al. (1994) Vidal-Madjar, A., Lagrange-Henri, A.-M., Feldman, P. D., et al. 1994, A&A, 290, 245