The Relation between Near-Infrared Luminosity of RGB Bumps and Metallicity of Galactic Globular Clusters
Abstract
Using photometric data from the 2MASS second incremental release point source catalog we constructed vs. () color-magnitude diagrams (CMDs) of Galactic globular clusters (GGCs) for which the photometric data have been made available up to now. On the CMDs of 13 GGCs we identified RGB bump features and derived luminosities of bumps in () and in () for 11 of them. We reconfirm the relation between and metallicity [Fe/H]CG97 or [M/H] such that the luminosity of bump becomes brighter as metallicity [Fe/H]CG97 or [M/H] decreases. This result is similar to that obtained by Ferraro et al. (1999) for the relation between and [M/H] based on observations of 47 GGCs which were conducted in the optical region (in vs. () CMDs). Our results show the same trend as those found by Ferraro et al. (2000) for the relations between and metallicity [Fe/H]cg97 and [M/H] derived from observations of 8 GGCs in the same near-infrared region ( vs. () CMDs). Combining with the data of Ferraro et al. (2000), we derive a robust relation for the metal-dependent luminosities of the bumps.
1 Introduction
The red giant branch (RGB) bump in globular clusters was theoretically predicted by Thomas (1967) and Iben (1968) as a region where evolution through the RGB is stalled for a time when the H burning shell passes the H abundance inhomogeneity envelope. This is produced by the stellar outer convection zone at the H shell burning RGB stage after the first dredge-up of a star in a globular cluster. The first convincing identification of the bump was that of the metal-rich cluster 47 Tuc (King, Da Costa, & Demarque 1985). The position in luminosity of the RGB bump is a function of metal abundance, helium abundance, and stellar mass (and hence cluster age) as well as any additional parameters that determine the maximum inward extent of the convection envelope or the position of the H burning shell. Thus the position of this peak on the giant branch of GGCs should provide observational constraints on these parameters.
RGB bumps in Galactic globular clusters (GGCs) were first observationally identified in a systematic way by Fusi Pecci et al. (1990). They found RGB bumps in 11 GGCs from the peaks in the differential luminosity function and a change in the slope of the integrated luminosity function using vs. () color-magnitude diagrams (CMDs). They discovered a correlation between the positions of RGB bumps in the GGCs and their metallicities. Subsequent to this work, many studies on this subject have been carried out (Sarajedini & Norris 1994; Brocato et al. 1996; Saviane et al. 1998). Recently, Ferraro et al. (1999) systematically identified the positions of RGB bumps in 47 GGCs in vs. () CMDs and confirmed the strong correlation between the absolute magnitudes of RGB bumps and metallicities of GGCs.
In the near-infrared band, the the locations of RGB bumps were identified for 8 GGCs in vs. () CMDs and a similar correlation between absolute magnitudes of RGB bumps and metallicities was derived by Ferraro et al. (2000).
The advantage of observing GGCs in the near-IR is an enormous reduction in reddening. The interstellar reddening in the band () is roughly 10 of that in the visual () part of the spectrum. This imparts a great advantage to near-infrared observations especially toward the disk and severely obscured bulge directions. Therefore, near-infrared observations are much preferred for disk and severely obscured bulge GGCs and for as yet unknown GGCs severely reddened by the Galactic bulge in the visual bands. Near-infrared observations are also useful for normal disk and halo GGCs because the color index is a good temperature indicator.
In the near-infrared band, RGB bumps of GGCs can be a very useful distance indicator because they are relatively bright, and their position in CMDs is close to the HB (Horizontal Branch). Moreover, the HB, which is a good distance indicator in the band is not useful in the near-infrared CMDs. In the near-IR CMDs, the HB is diagonally slanted from the upper right to the lower left position and is not horizontal at all. So it is difficult to measure the HB levels of GGCs in the near-IR CMDs. It is expected that the RGB bump is a distance indicator which would have the same amount of observational error as the HB used in the optical region since it has a similar HB metallicity dependency.
The goal of this work is to obtain the absolute magnitudes of RGB bumps in as many GGCs as possible in the near-IR band and to derive a robust relation between the luminosities of the bumps and metallicities of GGCs for use as distance indicators in the IR bands. Using the photometric data from the 2MASS (Two Micron All Sky Survey) second incremental release point source catalog we have investigated the existence of RGB bumps in GGCs and have found a correlation between the absolute magnitudes of RGB bumps and metallicities of GGCs, comparing our findings with the results of Ferraro et al. (2000). Combining with their data we provide a more robust correlation for the use of RGB bumps as standard candles for deriving distances to other GGCs.
In 2 we discuss some characteristics of GGCs’ near-infrared CMDs and in 3 investigate the location in luminosity of the RGB bumps and the relation between the luminosity of the bump and metallicity of GGCs, and in 4 we briefly summarize our results.
2 IR Color-Magnitude Diagrams
We used photometric data from the 2MASS second incremental release point source catalog which were obtained at two 1.3-m telescopes in the northern and southern hemispheres in the near-infrared bands at (1.25m), (1.65m), and (2.17m; short = medium modified ). Limiting magnitudes of the 2MASS second incremental release point source catalog photometric data are about 15 mag and the released data from 2MASS now covers 47 of the sky.
The photometric data for GGCs in Harris’ (1996) catalog which are relatively close to the Sun are obtained from the IPAC (Infrared Processing and Analysis Center) and vs. () CMDs are constructed. We rejected data whose errors are larger than 0.15 mag. We can construct CMDs of about 46.8 of GGCs in Harris’ (1996) catalog from the 2MASS second incremental release point source catalog. However, the quality of many CMDs is not good enough to find the bumps because the limiting magnitudes are too bright.
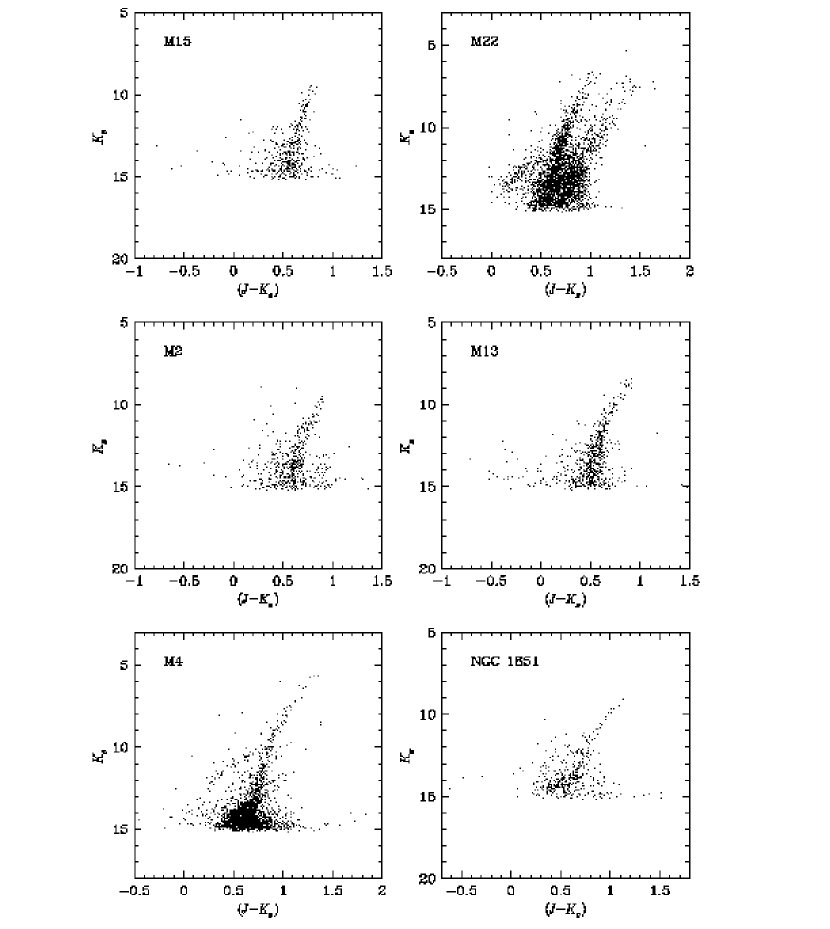
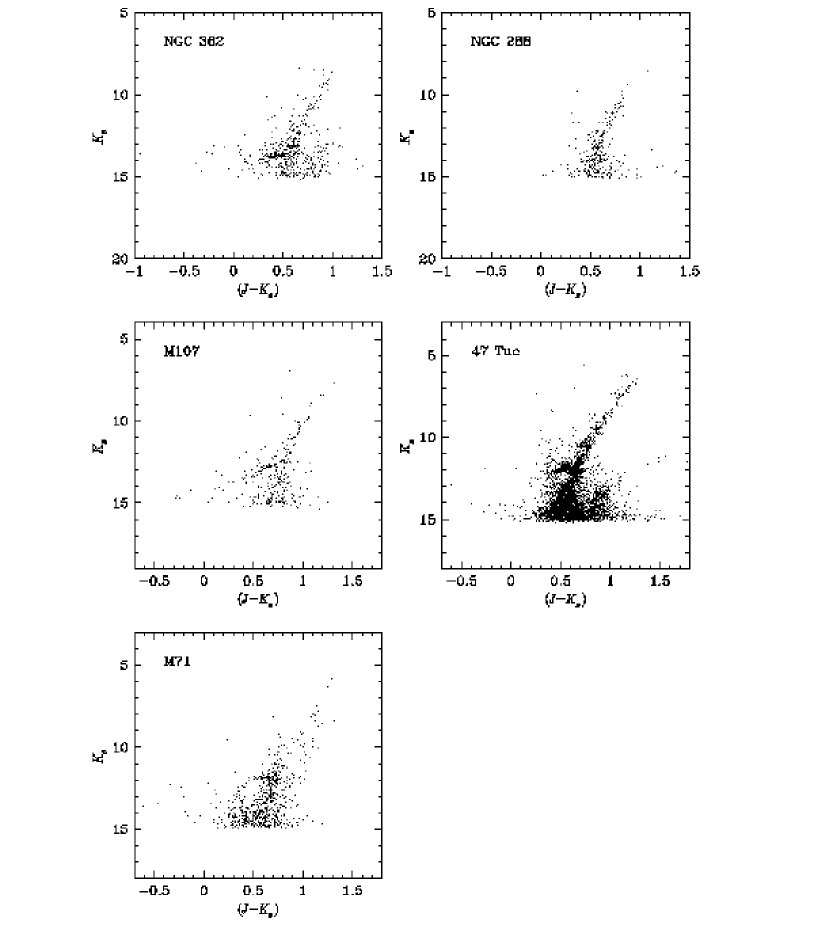
In Figure 1 we present CMDs of 11 GGCs for which the RGB bump positions are accurately measured by the systematic analytical method described in 3.1. According to Figure 1 the major characteristics of the CMDs of GGCs in the vs. plane are as follows.
First, the BHB (Blue Horizontal Branch) and RHB (Red Horizontal Branch) are diagonally tilted from the upper right to the lower left position and such features are obvious in the CMDs of M4 (NGC 6121) and M107 (NGC 6171) which have both BHB and RHB. Even the RHB of 47 Tuc (NGC 104), which has only RHB, is clearly tilted. So in the vs. CMDs it is difficult to determine the HB level of any GGC and to correlate RGB bump positions and HB levels in the near-infrared CMDs, in contrast to the case for optical CMDs.
Second, the brightness interval between the MSTO (Main Sequence Turnoff) and RGB tip is larger (9 mag) than in optical CMDs (6.5 mag), as can be easily seen in M4. So the magnitude resolution in the vs. CMDs is larger than in optical CMDs. However, color resolution in the vs. CMDs is smaller than in optical CMDs because in the latter the RGB and AGB (Asymptotic Giant Branch) are separated from one another at least in the lower part of the AGB. In contrast, in the vs. CMDs the RGB and AGB overlap, as clearly shown in the CMD of 47 Tuc whose AGB is relatively rich. In the optical CMDs of NGC 362, 47 Tuc, and M71 (NGC 6838), the separation of their RGBs and RHBs is clearly seen but they partially overlap in the vs. CMDs. This also results from the fact that the color resolution in the vs. CMDs is lower than that in optical CMDs.
Third, in the case of M22 (NGC 6656), its RGB is broader than those of other GGCs as found in the optical CMD (Peterson & Cudworth 1994). Moreover, in the lower part of the RGB, contamination from bulge component stars is severe. To the right of the RGB of M22 there exists another RGB component. This RGB component would be due to bulge RGB stars, which extend prominently redward in the optical CMD (in our unpublished data) because of the strong blanketing effects of heavy metals as found in metal-rich GGCs such as NGC 6553 (Ortolani, Barbuy, & Bica 1990).
Last, because NGC 362 and 47 Tuc CMDs are located in the direction of the SMC, a contribution from the SMC appears in the lower right region of their CMDs.
3 The RGB Bump
3.1 The Luminosity of the RGB Bump
In order to accurately measure the luminosity of the RGB bump and construct luminosity functions of the GGCs, we applied several standard procedures to delineate only the RGB sequences for all GGCs except for M22 and M71. First we rejected visually clear HB stars and AGB stars in the process of distinguishing outlying field stars from RGB stars. Second, by binning the RGB sequences in 0.5 mag intervals we measured the average and sigma of each bin and rejected stars 2 away from the mean value of each bin. We then remeasured the average and sigma of each bin and further rejected stars 2 away from the remeasured average of each bin, and iterated this process until no stars were rejected and the average and sigma of each bin converged. Third, from each RGB sequence after field star rejection, we constructed a differential luminosity function and an integral luminosity function for each GGC following the classical method of Fusi Pecci et al. (1990).
Then, we searched for a significant peak in the differential luminosity function and a corresponding large slope change in the integral luminosity function simultaneously for each GGC. Where the significant peak position in the differential luminosity function and the position of large slope change in the integral luminosity function coincide, we identified the significant peak as the RGB bump of the given GGC and measured this position (). However, in several GGCs the existence of RGB bumps is very clear only when considering the differential luminosity functions.
In the case of M22, since its CMD is severely contaminated by field and bulge stars, we clipped off the proper region in order to isolate the RGB sequence to 13. Below 13, isolation of the RGB sequence is difficult because of severe contamination by the field and bulge stars.
In the case of M71, the RGB is too poorly populated to be clearly defined. So in order to isolate the RGB sequence of M71 we used the 2 clipped RGB sequence of 47 Tuc with a similar metallicity as a template for the RGB sequence of M71. The remaining processes were the same as for the other GGCs.
Differential luminosity functions and integral luminosity functions for each GGC are shown in Figure 2.
In order to derive absolute magnitudes of GGC RGB bumps () from their apparent magnitudes we need absolute distance moduli and interstellar reddenings. We take these values from Table 2 of Ferraro et al. (1999) except for M22 and M2 (NGC 7089). Ferraro et al. (1999) derived absolute distance moduli in a very systematic way using the HB level as a distance indicator, or more strictly speaking the ZAHB (Zero Age Horizontal Branch) level. They derived ZAHB levels for GGCs by comparing the CMDs of GGCs with synthetic H-R diagrams. Then they derived absolute distance moduli using absolute magnitude levels of the ZAHB () and interstellar reddening. For interstellar reddening they adopted values from the compilation of Harris (1996).
In the cases of M22 and M2, which are not in the list of Ferraro et al. (1999), we calculated their absolute distance moduli based on the same method described in Ferraro et al. (1999), referring to other sources for the physical values. For derivation of the absolute distance moduli of M22 and M2 we used the magnitude difference between the apparent visual magnitude of the ZAHB () and the absolute visual magnitude of the ZAHB () of each cluster. That is as follows:
| (1) |
For we used equation (2) in 5 of Ferraro et al. (1999):
| (2) |
By the way, -element enhanced global metallicity [M/H] values for M22 and M2 were computed by equation (1) in 3.4 of Ferraro et al. (1999):
| (3) |
where is the enhancement factor of the -elements. According to Ferraro et al. (1999), for the 19 GGCs with [/Fe] listed by Salaris & Cassisi (1996) or Carney (1996), they adopted = . For all the others they assumed = if [Fe/H] and = if [Fe/H] . So, for M22 we adopted [/Fe] = 0.32 from Carney (1996), averaged over 9 stars which include all 3 stars of M22 in Salaris & Cassisi (1996). For M2 [/Fe] is not listed in Salaris & Cassisi (1996) or Carney (1996). So, we adopted = because [Fe/H] of M2 is . For we used equation (4) for [Fe/H] in 6.4 of Ferraro et al. (1999):
| (4) |
For we adopted = 3.08 from He et al. (1995) and for , which is used in the calculation of apparent magnitude distance moduli for program GGCs, we adopted = 0.32 from He et al. (1995). All parameters of M22 and M2 are listed in Table 1.
All these final values for absolute distance moduli and interstellar reddening of program GGCs are listed in Table 2. According to Ferraro et al. (1999) the global uncertainty of the absolute distance moduli is of the order of about 0.2 mag considering that the derived absolute distance moduli are affected by many uncertainties (namely, the evaluation of the ZAHB level, the zero point and dependence on metallicity of the ZAHB level, reddening, etc.). Finally, using absolute distance moduli and interstellar reddenings we derived absolute magnitudes of the RGB bumps of GGCs () listing them in Table 2 together with . In Table 2, errors in column (6) are measurement errors and errors in column (7) are a combination of measurement errors in column (6) and the global uncertainty of the absolute distance moduli, which is equal to 0.2 mag.
In the case of M2, the RGB bump appears in the expected position according to equations (5a), (5b) and (6a), (6b) in the next section, but the bump is relatively broader compared to those of other GGCs, and the quality of its IR CMD is poor compared to the optical CMD of Lee & Carney (1999).
Cudworth (1985) claimed that in the optical CMD of M71 there is a strong clump just below the HB whose position in the vs. plane is 15 and 1.2. Transforming these values into the vs. plane by the color transformation table of Bessell, Castelli, & Plez (1998), 15 transforms into 11.92 and 1.2 transforms into 0.77. Also, according to Girardi et al.’s (2000) evolutionary tracks the former values correspond to 11.94 and 0.72. These transformed and values of the strong clump of M71 in the vs. CMD nearly match the RGB bump position 11.95 and 0.72 derived in this work. So the strong clump reported by Cudworth (1985) in the vs. CMD of M71 must be the RGB bump derived in this work in the vs. CMD.
In the cases of M69 (NGC 6637) and Cen (NGC 5139) we can see the RGB bump features in their CMDs. However, for M69 it is difficult to measure the RGB bump position by systematic analysis because it exhibits a CMD which is too scatted to analyze. Also for Cen we abandoned the analysis because Cen has a wide RGB suggesting a metallicity spread (Lee et al. 1999; Pancino et al. 2000), which renders measurement of RGB bump position meaningless in this work.
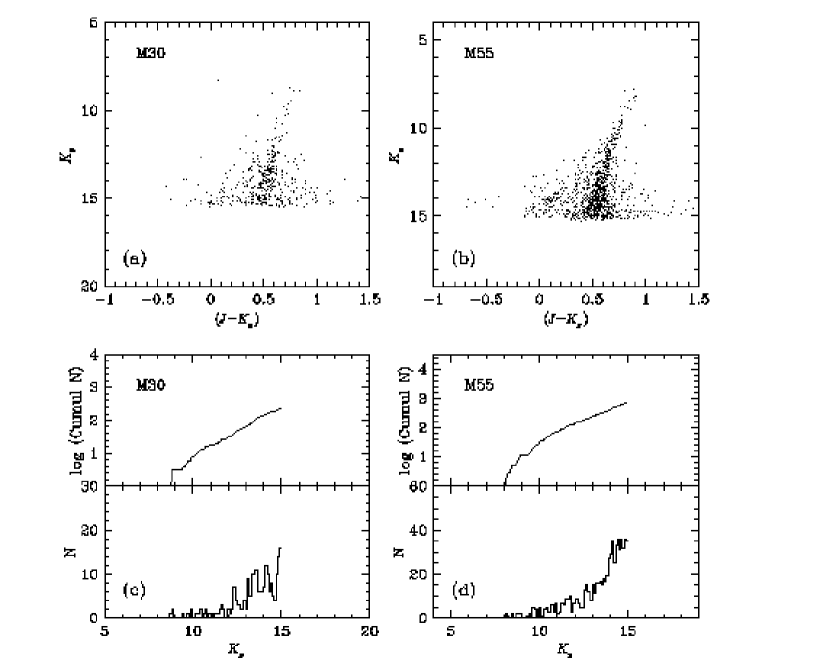
However, in the cases of M30 (NGC 7099) and M55 (NGC 6809), we cannot detect RGB bumps at the expected positions taking into account their metallicity after careful analysis of their differential and integral luminosity functions. Figure 3 shows their vs. CMDs, differential luminosity functions, and integral luminosity functions. For M30 there are hints of bumps at 12.5 and 13.5. However, no slope changes around those magnitudes are found in the integral luminosity function. For M55 neither a bump nor a significant slope change are found.
3.2 The Relation between the luminosity of RGB bump and metallicity
There are two widely used metallicity scales, the Zinn & West scale (Zinn & West 1984; Zinn 1980, 1985; Armandroff & Zinn 1988) and the Carretta & Gratton scale (Carretta & Gratton 1997). The Zinn & West scale (hereafter ZW scale) employs the most complete data set but is not based on high resolution spectra. However, the Carretta & Gratton scale (hereafter CG97 scale) is based on systematic high resolution spectra obtained by their own team, and there is a transformation relation between the ZW scale and the CG97 scale in equation (7) of Carretta & Gratton (1997). The CG97 scale is more robust since it relies on recent high resolution spectroscopic measurements and up-to-date atmospheric models. Moreover, in order to compare our results directly with those of Ferraro et al. (2000) which employed the CG97 scale, we adopted the CG97 metallicity scale.
The CG97 scale metallicity of each GGC is given in Table 2. Since only 24 GGCs have metallicity determinations from direct high resolution spectra in the CG97 scale, the metallicities of NGC 1851 and M107 are interpolated from equation (7) of Carretta & Gratton (1997), and the metallicity of M2 is adopted from the value determined by the morphological parameters of RGB stars by Lee & Carney (1999). Recently, Carretta & Gratton’s group published high resolution spectroscopic metallicities of NGC 6553 (Cohen et al. 1999; Carretta et al 2001) and NGC 6528 (Carretta et al. 2001, hereafter CG), extending the CG97 metallicity scale into the high metallicity region ([Fe/H]CG 0.00), and established a new transformation equation between ZW scale metallicity and CG scale metallicity. However, in the metallicity range of [Fe/H]CG97 the interpolated metallicity values are coincident within 0.1 dex in the two different transformation equations and it seems that transformation equation (7) of Carretta & Gratton (1997) is tighter than transformation equation (3) of Carretta et al. (2001). We did not revise the metallicities of NGC 1851, M107, M2, M55, and M69, which have no metallicity measurements from direct high resolution spectra in the CG97 metallicity scale. But for metallicities of NGC 6553 and NGC 6528, which were extrapolated by Ferraro et al. (1999) since their ZW scale metallicities are outside the validity range of the transformation to the CG97 scale metallicities by equation (7) of Carretta & Gratton (1997), we adopted the new high resolution spectroscopic measurements of Carretta et al. (2001). Metallicities of the other GGCs are taken from the directly determined values of Carretta & Gratton (1997).
We also consider the global metallicity [M/H] which incorporates -element enhancement into the CG97 metallicity scale [Fe/H]CG97 according to equation (1) of Ferraro et al. (1999). In the case of [M/H] we directly adopted the values in Table 1 of Ferraro et al. (1999) except for M22, M2, NGC 6553, and NGC 6528. In the cases of M22 and M2 we calculated [M/H] as described in 3.1 and in the cases of NGC 6553 and NGC 6528 we first calculated [/Fe] using equation (2) of Carney (1996) with the -element abundances listed in Carretta et al. (2001) and then calculated [M/H] using equation (3) in 3.1. Values of [/Fe] of NGC 6553 and NGC 6528 are 0.20 0.07 and 0.21 0.04, respectively.
When we compare with the CG97 metallicity scale [Fe/H]CG97 or the -element enhanced global metallicity scale [M/H] given in Table 2, we find clear quadratic correlations as shown in Figure 4. The relations expressed in equations (5a) and (5b) imply that as metallicity decreases, the luminosity of the RGB bump becomes brighter, which is an identical result to that of Ferraro et al. (2000).
| (5a) | |||
| (5b) | |||
The photometric data of Ferraro et al. (2000) were homogeneous, making use of Glass’ standard stars (Ferraro et al. 1994; Montegriffo et al. 1995). The 2MASS photometric data are also homogeneous and have undergone Global Photometric Calibration (Nikolaev et al. 2000). Therefore, if we estimate the photometric zero point differences between them we can combine the two sets of photometric data by correcting for the zero point difference. Comparison of RGB bump positions of clusters common to both works can be used for estimation of the zero point difference. However, since the two works were conducted in different photometric systems, we first have to render the photometric data in the same sustem, that is to say in the 2MASS system.
We transformed Ferraro et al.’s (2000) results into the 2MASS system using equation (A1) of Carpenter (2001). Equation (A1) of Carpenter (2001) can transform the Bessell & Brett (1988) system into the 2MASS system. The Bessell & Brett system is the homogenized Glass system, and the photometric data of Ferraro et al. (2000) are in the Glass system since the data are standardized by Glass’ standard stars. So, we transformed the data of Ferraro et al. (2000) in the Glass system into the 2MASS system using equation (A1) of Carpenter (2001).
The 3 GGCs of this work overlap with those of Ferraro et al. (2000), and the RGB bump luminosities of the two works are listed in Table 3. We list the luminosities of the RGB bumps in the Glass system which are original and those in the 2MASS system after transformation from the Glass system for the 8 GGCs of Ferraro et al. (2000) in Table 4. According to Table 3, in the cases of M15 (NGC 7078) and 47 Tuc, the RGB bump positions in this work are fainter by 0.09 mag than those of Ferraro et al. (2000), and in the case of M107, the RGB bump position in this work is brighter by 0.01 mag than that of Ferraro et al. (2000). However, since these differences are smaller than the errors of the data, we can neglect the zero point difference between the two works. Therefore, we combined the data in the two works without applying any zero point correction. The results are shown in Figure 5.
The sample of 8 GGCs in Ferraro et al. (2000) covers a wide range in metallicity despite its small size. While our sample is a little larger, comprising 11 GGCs, it covers a limited range in metallicity. Therefore, the combined data set increases the sample of GGCs to 16 and covers a wider range in metallicity than that of the sample GGCs of our work. We have found clear relations between GGC metallicity and luminosity of the RGB bump, as shown in Figure 5. By taking error-weighted mean averages for the 3 common GGCs and combining the remaining data we have the reduced regression equations (6a) and (6b) and we plot the results in Figure 5 as solid lines.
| (6a) | |||
| (6b) | |||
Dashed lines are from equations given in Figure 13 of Ferraro et al. (2000) transformed into the 2MASS system and dot-dashed lines are from equations (5a) and (5b). Although dashed lines and dot-dashed lines are not exactly coincident with each other, their forms are very similar. The first terms of equations (6a) and (6b) are negligible if the errors in the parameters are considered. Therefore solid lines are nearly linear and deviate from the dashed lines slightly at the metal rich ends. This is due to metallicity revision of NGC 6553 and NGC 6528. Their original values in Ferraro et al. (2000), which were extrapolated to be [Fe/H]CG97 and , and [M/H] and , respectively, have been revised to [Fe/H]CG97 and 0.07, and [M/H] 0.08 and 0.22, respectively.
The overall trend for the RGB bump positions of GGCs to become brighter with decreasing metallicity has been supported by many theoretical models derived from the first such model established by Sweigart (1978). However, there is also a moderate helium abundance dependency (Sweigart 1978) and a weak age dependency (Ferraro et al 1999; Yi et al. 2001) of RGB bump positions for a given metallicity.
According to Yi et al. (2001) and Ferraro et al. (1999), the RGB bump luminosity varies with metallicity by 0.96 in the metallicity range [Fe/H] 0.0 and in the age range of 7 Gyr 16 Gyr. Yun & Lee (1979) found that RGB bump bolometric luminosity varied with [Fe/H] according to a nearly constant relation in the helium abundance range 0.1 0.3. in the theoretical luminosity function analysis of 46 RGB models of Sweigart & Gross (1978). Therefore, we assume that the RGB bump luminosity varies with [Fe/H] constantly by 0.96 in the metallicity range [Fe/H] 0.0, in the age range of 7 Gyr 16 Gyr, and in the helium abundance range 0.1 0.3. The total luminosity change of RGB bump has been found to be 1.83 in (Ferraro et al. 1999) and 1.76 in (Ferraro et al. 2000) in the same metallicity range. So, we derive the RGB bump luminosity variation in with [Fe/H] as 0.92 in the metallicity range [Fe/H] 0.0, in the age range of 7 Gyr 16 Gyr, and in the helium abundance range 0.3.
According to the theoretical luminosity function analysis of 46 RGB models of Sweigart & Gross (1978) by Yun & Lee (1979), when mass , the RGB bump bolometric luminosity variation with helium abundance is in the helium abundance range and in the metallicity range [Fe/H] . Here is bolometric magnitude which is proportional to and taken to be 0 at the RGB tip. Comparison of the theoretical RGB bump bolometric variation rate by Yun & Lee (1979) with the theoretical RGB bump luminosity variation rate in by Yi et al. (2001) gives . So, when mass , the RGB bump luminosity variation in with helium abundance is found to be in the helium abundance range and in the metallicity range [Fe/H] .
According to Yi et al. (2001) and Ferraro et al. (1999), the RGB bump luminosity variation in with age is 0.04 in the age range of 7 Gyr 16 Gyr and in the metallicity range [Fe/H] 0.0, where represents age in Gyr unit. Since the relation between the total luminosity changes of the RGB bump in and in is , RGB bump luminosity variation in with age is found to be 0.04 in the age range of 7 Gyr 16 Gyr and in the metallicity range [Fe/H] 0.0.
Applying equation (11) of Buzzoni et al. (1983) for the relation between (, the ratio of the number of HB stars to the number of RGB stars brighter than the HB) and helium abundance to values of 26 GGCs (Zoccali et al. 2000), the maximum range of helium abundance in GGCs at a given [Fe/H] is 0.06 ( ). However, according to the data of Sandquist (2000) for 43 GGCs, the maximum range of helium abundance in GGCs at a given [Fe/H] is 0.10 ( ). So, the maximum RGB bump luminosity variation in caused by helium abundance variation in GGCs at a given [Fe/H] is found to be 0.20 mag.
However, the maximum age spread of GGCs at a given [Fe/H] is 6 Gyr (3 Gyr) according to Chaboyer et al. (1996), Richer et al. (1996), Salaris & Weiss (1997), Buonanno et al. (1998), Rosenberg et al. (1999), and VandenBerg (2000). So, the maximum RGB bump luminosity variation in caused by age variation in GGCs at a given [Fe/H] is found to be 0.12 mag.
Therefore, the maximum variation of RGB bump luminosity in with helium abundance and age spreads in GGCs at a given [Fe/H] is 0.24 mag. This implies that the relations between the absolute magnitude of the RGB bump () and metallicity or [M/H] derived in this work can be used to determine distance moduli of other GGCs with an uncertainty of approximately 0.24 mag at a given metallicity.
4 Summary
Using photometric data from the 2MASS second incremental release point source catalog we found RGB bump features in 13 GGCs in vs. () CMDs and measured accurate positions of RGB bumps for 11 GGCs excluding M69 and Cen. We have found clear relations between and metallicity [Fe/H]CG97 or [M/H], thereby independently confirming the results of Ferraro et al. (2000).
Combining the present sample and that of Ferraro et al. (2000), we extend the number of GGCs to 16 whose RGB bump positions have been measured, and determined more robust correlations between the absolute magnitudes of RGB bumps () and metallicity [Fe/H]CG97 or [M/H]. Furthermore, these equations can be used to determine distance moduli of other GGCs with an uncertainty of 0.24 mag at a given metallicity.
References
- Armandroff and Zinn (1988) Armandroff, T. E., and Zinn, R. 1988, AJ, 96, 92
- Bessell and Brett (1988) Bessell, M. S., and Brett, J. M. 1988, PASP, 100, 1134
- Bessell et al. (1998) Bessell, M. S., Castelli, F., and Plez, B. 1998, A&A, 333, 231
- Brocato et al. (1996) Brocato, E., Buonanno, R., Malakhova, Y., and Piersimoni, A. M. 1996, A&A, 311, 778
- Buonanno et al. (1998) Buonanno, R., Corsi, C. E., Pulone, L., Fusi Pecci, F., and Bellazzini, M. 1998, A&A, 333, 505
- Buzzoni et al. (1983) Buzzoni, A., Fusi Pecci, F., Buonanno, R., and Corsi, C. E. 1983, A&A, 128, 94
- Carney (1996) Carney, B. W. 1996, PASP, 108, 900
- Carpenter (2001) Carpenter, J. M. 2001, AJ, 121, 2851
- Carretta et al. (2001) Carretta, E., Cohen, J. G., Gratton, R. G., and Behr, B. B. 2001, AJ, 122, 1469
- Carretta and Gratton (1997) Carretta, E., and Gratton, R. G. 1997, A&AS, 121, 95
- Chaboyer et al. (1996) Chaboyer, B., Demarque, P., and Sarajedini, A. 1996, ApJ, 459, 558
- Cohen et al. (1999) Cohen, J. G., Gratton, R. G., Behr, B. B., and Carretta, E. 1999, ApJ, 523, 739
- Cudworth (1985) Cudworth, K. M. 1985, AJ, 90, 65
- Ferraro et al. (1994) Ferraro, F. R., Fusi Pecci, F., Guarnieri, M. D., Moneti, A., Origlia, L., and Testa, V. 1994, MNRAS, 266, 829
- Ferraro et al. (1999) Ferraro, F. R., Messineo, M., Fusi Pecci, F., De Palo, M. A., Straniero, O., Chieffi, A., and Limongi, M. 1999, AJ, 118, 1738
- Ferraro et al. (2000) Ferraro, F. R., Montegriffo, P., Origlia, L., and Fusi Pecci, F. 2000, AJ, 119, 1282
- Fusi Pecci et al. (1990) Fusi Pecci, F., Ferraro, F. R., Crocker, D. A., Rood, R. T., and Buonanno, R. 1990, A&A, 238, 95
- Girardi et al. (2000) Girardi, L., Bressan, A., Bertelli, G., and Chiosi, C. 2000, A&AS, 141, 371
- Harris (1996) Harris, W. E. 1996, AJ, 112, 1487
- He et al. (1995) He, L., Whittet, D. C. B., Kilkenney, D., and Spencer Jones, J. H. 1995, ApJS, 101, 336
- Iben (1968) Iben, I. 1968, Nature, 220, 143
- King et al. (1985) King, C. R., Da Costa, G. S., and Demarque, P. 1985, ApJ, 299, 674
- Lee and Carney (1999) Lee, J.-W., and Carney, B. W. 1999, AJ, 118, 1373
- Lee et al. (1999) Lee, Y.-W., Joo, J.-M., Sohn, Y.-J., Rey, S.-C., Lee, H.-C., and Walker, A. R. 1999, Nature, 402, 55
- Montegriffo et al. (1995) Montegriffo, P., Ferraro, F. R., Fusi Pecci, F., and Origlia, L. 1995, MNRAS, 276, 739
- Nikolaev et al. (2000) Nikolaev, S., Weinberg, M. D., Skrutskie, M. F., Cutri, R. M., Wheelock, S. L., Gizis, J. E., and Howard, E. M. 2000, AJ, 120, 3340
- Ortolani et al. (1990) Ortolani, S., Barbuy, B., and Bica, E. 1990, A&A, 236, 362
- Pancino et al. (2000) Pancino, E., Ferraro, F. R., Bellazzini, M., Piotto, G., and Zoccali, M. 2000, ApJ, 534, L83
- Peterson and Cudworth (1994) Peterson, R. C., and Cudworth, K. M. 1994, ApJ, 411, 103
- Richer et al. (1996) Richer, H. B., et al. 1996, ApJ, 463, 602
- Rosenberg et al. (1999) Rosenberg, A., Saviane, I., Piotto, G., and Aparicio, A. 1999, AJ, 118, 2306
- Salaris and Cassisi (1996) Salaris, M., and Cassisi, S. 1996, A&A, 305, 858
- Salaris and Weiss (1997) Salaris, M., and Weiss, A. 1997, A&A, 327, 107
- Sandquist (2000) Sandquist, E. L. 2000, MNRAS, 313, 571
- Sarajedini and Norris (1994) Sarajedini, A., and Norris, J. E. 1994, ApJS, 93, 161
- Saviane et al. (1998) Saviane, I., Piotto, G., Fagotto, F., Zaggia, S., Capaccioli, M., and Aparicio, A. 1998, A&A, 333, 479
- Sweigart (1978) Sweigart, A. V. 1978, in IAU Symp. 80, The HR Diagram, ed. A. G. D. Philip & D. S. Hayes (Dordrecht: Reidel), 333
- Sweigart and Gross (1978) Sweigart, A. V., and Gross, P. G., 1978, ApJS, 36, 405
- Thomas (1967) Thomas, H.-C. 1967, Z. Astrophys., 67, 420
- VandenBerg (2000) VandenBerg, D. A. 2000, ApJS, 129, 315
- Yi et al. (2001) Yi, S., Demarque, P., Kim, Y.-C., Lee, Y.-W., Ree, C. H., Lejeune, T., and Barnes, S. 2001, ApJS, 136, 417
- Yun and Lee (1979) Yun, H.-Y., and Lee, S.-W. 1979, J. Korean Astron. Soc., 12, 17
- Zinn (1980) Zinn, R. 1980, ApJS, 42, 19
- Zinn (1985) ———. 1985, ApJ, 293, 424
- Zinn and West (1984) Zinn, R., and West, M. 1984, ApJS, 55, 45
- Zoccali et al. (2000) Zoccali, M., Cassisi, S., Bono, G., Piotto, G., Rich, R. M., and Djorgovski, S. G. 2000, ApJ, 538, 289


| M22 | M2 | |||||
|---|---|---|---|---|---|---|
| Parameter | Value | Reference | Parameter | Value | Reference | |
| 1.48 | 1 | 1.46 | 5 | |||
| 1.25 | 2 | 1.26 | 2 | |||
| 14.10 | 3 | 15.93 | 5 | |||
| 14.16 | 2 | 15.99 | 2 | |||
| 0.59 | 2 | 0.59 | 2 | |||
| 0.34 | 4 | 0.02 | 5 | |||
| 12.52 | 2 | 15.34 | 2 | |||
References. — (1) Carretta & Gratton (1997); (2) this work; (3) Peterson & Cudworth (1994); (4) Harris (1996); (5) Lee & Carney (1999)
| Cluster | [Fe/H]CG97 | [M/H] | ||||
|---|---|---|---|---|---|---|
| M15 (NGC 7078) | 2.12 | 1.91 | 0.09 | 15.15 | 12.95 0.05 | 2.23 0.21 |
| M22 (NGC 6656) | 1.48 | 1.25 | 0.34 | 12.52 | 10.80 0.10 | 1.83 0.22 |
| M2 (NGC 7089) | 1.46 | 1.26 | 0.02 | 15.34 | 13.55 0.05 | 1.80 0.21 |
| M13 (NGC 6205) | 1.39 | 1.18 | 0.02 | 14.43 | 12.55 0.05 | 1.89 0.21 |
| M4 (NGC 6121) | 1.19 | 0.94 | 0.36 | 11.68 | 10.00 0.10 | 1.80 0.22 |
| NGC 362 | 1.15 | 0.99 | 0.05 | 14.68 | 13.15 0.05 | 1.55 0.21 |
| NGC 1851 | 1.08 | 0.88 | 0.02 | 15.46 | 13.80 0.10 | 1.67 0.22 |
| NGC 288 | 1.07 | 0.85 | 0.03 | 14.73 | 13.25 0.05 | 1.49 0.21 |
| M107 (NGC 6171) | 0.87 | 0.70 | 0.33 | 13.95 | 12.50 0.10 | 1.56 0.22 |
| 47 Tuc (NGC 104) | 0.70 | 0.59 | 0.04 | 13.32 | 12.10 0.10 | 1.23 0.22 |
| M71 (NGC 6838) | 0.70 | 0.49 | 0.25 | 12.97 | 11.95 0.05 | 1.10 0.21 |
Note. — Metallicities, interstellar reddenings, and distance moduli of GGCs are taken from Table 1 of Ferraro et al. (1999) except for M22 and M2 whose values are taken from Table 1 of this work. More details are described in the text.
| Ferraro et al. (2000) | This work | AverageaaWeighted mean average by errors. | ||||||
|---|---|---|---|---|---|---|---|---|
| Cluster | ||||||||
| M15 | 12.86 0.05 | 2.32 0.21 | 12.95 0.05 | 2.23 0.21 | 2.28 0.15 | |||
| M107 | 12.51 0.05 | 1.55 0.21 | 12.50 0.10 | 1.56 0.22 | 1.55 0.15 | |||
| 47 Tuc | 12.01 0.05 | 1.32 0.21 | 12.10 0.10 | 1.23 0.22 | 1.28 0.15 | |||
Note. — Ferraro et al.’s (2000) original results in Glass system were transformed into 2MASS system according to equation (A1) of Carpenter (2001).
| Cluster | [Fe/H]CG97 | [M/H] | ||
|---|---|---|---|---|
| M15 (NGC 7078) | 2.12 | 1.91 | 2.28 0.21 | 2.32 0.21 |
| M68 (NGC 4590) | 1.99 | 1.81 | 2.30 0.21 | 2.34 0.21 |
| M55 (NGC 6809) | 1.61 | 1.41 | 1.94 0.21 | 1.98 0.21 |
| M107 (NGC 6171) | 0.87 | 0.70 | 1.51 0.21 | 1.55 0.21 |
| 47 Tuc (NGC 104) | 0.70 | 0.59 | 1.28 0.21 | 1.32 0.21 |
| M69 (NGC 6637) | 0.68 | 0.55 | 1.15 0.21 | 1.19 0.21 |
| NGC 6553 | 0.06aaThese values were taken from Carretta et al. (2001). | 0.08bbThese values were calculated by equation (3) in 3.1 and more details are described in the text. | 0.75 0.22 | 0.79 0.22 |
| NGC 6528 | 0.07aaThese values were taken from Carretta et al. (2001). | 0.22bbThese values were calculated by equation (3) in 3.1 and more details are described in the text. | 0.54 0.22 | 0.58 0.22 |
Note. — Cols. (2) and (3) list metallicities taken from Table 1 of Ferraro et al. (2000) except for NGC 6553 and NGC 6528. Col. (4) lists absolute magnitudes of RGB bumps in Glass system and col. (5) lists those values transformed into 2MASS system according to eq. (A1) of Carpenter (2001).