The Optical, Infrared and Radio Properties of Extragalactic Sources Observed by SDSS, 2MASS and FIRST Surveys
Abstract
We positionally match sources observed by the Sloan Digital Sky Survey (SDSS), the Two Micron All Sky Survey (2MASS), and the Faint Images of the Radio Sky at Twenty-cm (FIRST) survey. Practically all 2MASS sources are matched to an SDSS source within 2 arcsec; 11% of them are optically resolved galaxies and the rest are dominated by stars. About 1/3 of FIRST sources are matched to an SDSS source within 2 arcsec; 80% of these are galaxies and the rest are dominated by quasars. Based on these results, we project that by the completion of these surveys the matched samples will include about 107 stars and 106 galaxies observed by both SDSS and 2MASS, and about 250,000 galaxies and 50,000 quasars observed by both SDSS and FIRST. Here we present a preliminary analysis of the optical, infrared and radio properties for the extragalactic sources from the matched samples. In particular, we find that the fraction of quasars with stellar colors missed by the SDSS spectroscopic survey is probably not larger than 10%, and that the optical colors of radio-loud quasars are 0.05 mag. redder (with significance) than the colors of radio-quiet quasars.
1Princeton University, 2University of California, 3The New York University, 4The John Hopkins University, 5University of Sussex, 6Pennsylvania State University, 7University of Washington, 8Fermi National Accelerator Laboratory, 9Max-Planck-Institute für Extraterrestrische Physik
1. Introduction
The increasing availability of large scale digital sky surveys spanning many wavelengths offers an unprecedented view of the Universe. The positional matching of such surveys is of obvious scientific interest. Not only can wide wavelength coverage provide a comprehensive description of the various classes of astrophysical object, but characterizing the most populous families can help isolating more peculiar, and usually more interesting, objects. In this contribution we discuss the matching of early SDSS data with 2MASS and FIRST surveys. The details of this work are presented elsewhere (Finlator et al. 2000, Menou et al. 2001, Knapp et al. 2001, Ivezić et al. 2001, Ivezić et al. 2002) and here we summarize the most important results.
The SDSS (York et al. 2000, Stoughton et al. 2002, and references therein) is a digital photometric and spectroscopic survey which will cover one quarter of the Celestial Sphere in the North Galactic cap and produce a smaller area (225 deg2) but much deeper survey in the Southern Galactic hemisphere. It utilizes five broad bands (, , , , ) with central wavelengths ranging from 3550 Å to 8930 Å, and will detect about 108 stars and a similar number of galaxies brighter than 22m. For about one million brightest galaxies and 100,000 quasar candidates SDSS will also obtain high-quality spectra. The 2MASS (Skrutskie et al. 1997) surveyed the entire sky in near-infrared light (, , and bands) and catalogued 300 million stars, as well as several million galaxies. The FIRST survey (Becker et al. 1995) provides the most comprehensive view of the Universe at 20 cm and will detect about a million radio galaxies and quasars.
2. SDSS Color-color and color-magnitude diagrams
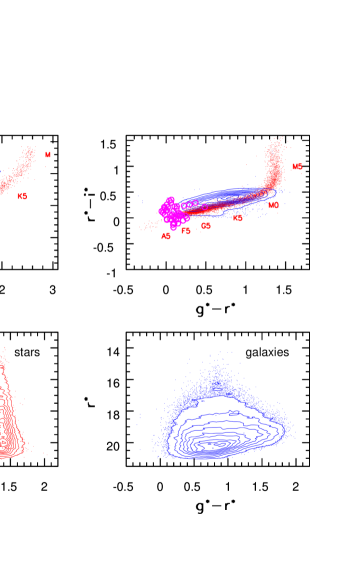
Of the three surveys discussed here, SDSS provides the most detailed information about the detected objects due to its multi-color optical photometry, the highest angular resolution, and the spectroscopic data. The position of an object in SDSS color-color and color-magnitude diagrams can be efficiently used to constrain its nature. The color-color and color-magnitude diagrams which summarize photometric properties of SDSS sources are shown in Figure 1 (magnitudes are marked as because the calibration is still uncertain within 5%). We use the “model” magnitudes, as computed by the photometric pipeline (“photo”, Lupton et al. 2002). The model magnitudes are measured by fitting an exponential and a de Vacouleurs profile, and using the formally better model in to evaluate the magnitude. Photometric errors are typically 0.03m at the bright end (), and increase to about 0.1m at , the faint limit relevant in this work (for more details see Ivezić et al. 2000 and Strateva et al. 2001, hereafter S01).
The top two panels in Figure 1 display the vs. and vs. color-color diagrams for 300,000 objects observed in 20 deg2 of sky. The unresolved sources are shown as dots, and the distribution of resolved sources is shown by linearly spaced density contours. The low-redshift quasars (z 2.5), selected by their blue colors indicating UV excess (0.6 0.6, -0.2 0.6), are shown as circles. Most of the unresolved sources marked as dots are stars. For a more detailed discussion of the stellar properties in SDSS photometric system see Finlator et al. (2000, hereafter F00) and references therein. Here we only briefly mention that the position of a star in color-color diagrams is mainly determined by its spectral type, as marked, and that the modeling of the stellar populations observed by SDSS (F00) indicates that the majority of these stars (99%) are on the main sequence. The lower two panels in Figure 1 display the color-magnitude diagrams for unresolved (left) and resolved (right) sources, with the distributions shown by linearly spaced density contours. The distribution of galaxies in the SDSS color-color diagrams has been studied by Shimasaku et al. (2001) and S01. S01 found that galaxies show a strongly bimodal distribution of the color, also visible in the upper left panel in Figure 1, and demonstrated that the two components can be associated with the spiral (blue component) and elliptical (red component) galaxies.
The aim of this work is to find out where in the diagrams shown in Figure 1 2MASS and FIRST sources are found, and how many 2MASS and FIRST sources are not detected by SDSS.
3. The Positional Matching of SDSS and 2MASS Sources
| Region | Counts | Blue | Red | PSCb | XSCb | FIRST | |
|---|---|---|---|---|---|---|---|
| Ia | 24.60.5 | 95.0 | 5.0 | 38.6 | 17.9 | 3.9 | |
| Ib | 58.00.7 | 16.0 | 84.0 | 77.9 | 38.8 | 4.4 | |
| Ic | 13.20.3 | 2.2 | 97.8 | 79.1 | 20.9 | 8.8 | |
| all I | 95.80.9 | 34.5 | 65.5 | 67.9 | 31.0 | 4.9 | |
| IIa | 3171.8 | 97.4 | 2.6 | 1.9 | 0.0 | 0.1 | |
| IIb | 5172.2 | 54.3 | 45.7 | 2.2 | 0.0 | 0.2 | |
| IIc | 3041.8 | 7.4 | 92.6 | 14.4 | 0.0 | 0.8 | |
| IId | 84.00.9 | 2.4 | 97.6 | 21.0 | 0.1 | 3.3 | |
| all II | 12223.5 | 50.2 | 49.8 | 6.5 | 0.0 | 0.5 | |
| I + II | 13183.7 | 49.1 | 50.9 | 10.9 | 2.3 | 0.9 |
a) All entries are percentages, except counts which are deg-2.
b) Refers to 2MASS catalogs.
The positional matching of SDSS and 2MASS sources is described by F00, who also discussed the optical and infrared properties of stars. The analysis of extragalactic sources observed by both SDSS and 2MASS will be described in detail by Ivezić et al. (2002). Practically all 2MASS sources (98% for point sources from the PSC and 97% for extended sources from the XSC) are matched to an SDSS source within 2 arcsec. About 11% of the 2MASS PSC sources are optically resolved galaxies and the rest are dominated by stars. Practically all (98%) sources from the 2MASS XSC are associated with an optically resolved source.
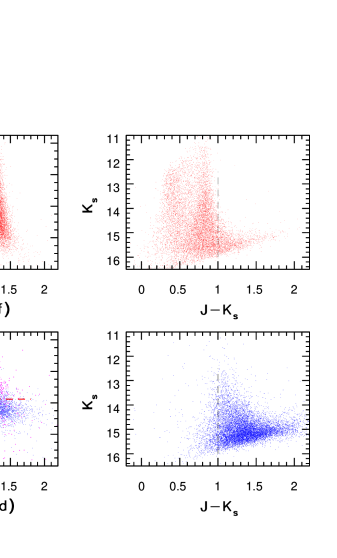
Figure 2 shows the color-magnitude diagrams for sources observed by both SDSS and 2MASS. The top two panels show representative optical and near-IR diagrams for 10,000 stars, and the bottom two panels show analogous diagrams for a similar number of galaxies. The vertical dashed lines at in the two right panels roughly separate stars from galaxies in 2MASS data (only 22% of these galaxies are resolved in 2MASS images). The horizontal dashed line in the lower left panel shows the magnitude limit for SDSS spectroscopic galaxy survey. Practically all sources from the 2MASS XSC are brighter than that limit, and are shown as magenta dots (on top of blue dots that mark sources from the 2MASS PSC). The fraction of 2MASS galaxies in each of the regions in the vs. color-magnitude diagram that track different morphological types (shown by dashed lines in Figure 6, for details see Ivezić et al. 2002) is listed in Table 1. Based on the matched source density, we project that by the completion of SDSS the matched SDSS-2MASS sample will include about 107 stars and 106 galaxies. About half of these galaxies will be part of the SDSS spectroscopic survey, and about about 105 will have photometry better than 0.1 mag. in all 8 bands.
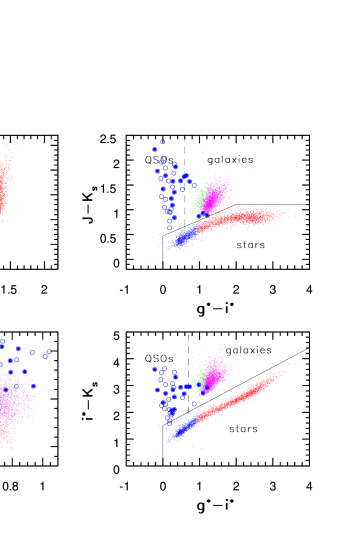
Figure 3 shows the color-color diagrams for stars and galaxies from Figure 2, which also have better than 10 detections in all three 2MASS bands. Stars are shown as blue and red dots, separated by =0.7 which approximately corresponds to K0 spectral type (F00). Galaxies are shown as green and magenta dots, separated by which approximately separates spiral and elliptical galaxies (S01). The unresolved sources with optical colors indicative of low-redshift quasars are shown as blue circles (open for sources with better than 5 detections in all three 2MASS bands and solid for better than 7). Note that it is not possible to separate galaxies from stars using only optical colors (see upper left panel). However, the addition of IR data allows nearly perfect separation, and the lines shown in the two right panels outline the regions populated by stars, galaxies and low-redshift quasars (the - color is based on the “psf” magnitude). This clean separation can be used to gauge the success of the SDSS star-galaxy separation at the bright end. We find that 99.3% of the sources deemed as resolved by SDSS photometric pipeline are found in the region marked as “galaxies”. The bottom left panel shows an infrared color-color diagram constructed with 2MASS data. Using SDSS data we find that sources with are predominantly extragalactic, while the bluer sources are stars.
3.1. Search for Reddened Quasars Using SDSS and 2MASS
Dust-reddened quasars are hard to distinguish in optical color-color diagrams because the plausible reddening vectors are roughly parallel to the stellar locus. However, such objects may be more easily distinguishable from stars in optical-infrared color-color diagrams because the reddening moves objects from the region marked “QSOs” to the region marked “galaxies”, thus missing the stellar locus (because quasars have redder colors than stars). Since SDSS imaging data can easily separate optically unresolved and resolved sources, selecting sources with e.g. and can in principle reveal dust-obscured quasars. In a pilot study, we have obtained spectra for 30 optically unresolved sources from the region marked “galaxies”. Most of them are M stars, and not a single one was confirmed to be a quasar. This null result places a strong upper limit on the fraction of reddened quasars.
Cutri et al. 2001 discuss the selection of red AGNs from the 2MASS PSC database using the condition that . These sources may be dust-reddened quasars with optical colors indistinguishable from those of stars and thus missed by SDSS spectroscopic targeting of quasars. We have analyzed a sample of 241 such candidates selected from a 220 deg2 large region (Ivezić, Cutri, Nelson, et al. 2002). The majority of these sources are optically resolved (226), and are dominated by red (elliptical) galaxies (194) with redshifts up to 0.4. Their very red colors seem to be a consequence of the K correction. The majority of optically unresolved matches (13 out of 15) show UV excess indicative of quasars with redshifts 2.5 and thus are easily distinguishable from stars using optical colors alone. This is confirmed for 9 sources for which SDSS spectra are available. One of the remaining two unresolved sources is a confirmed L dwarf, and the other one has optical-infared colors consistent with also being an L dwarf. Consequently, this preliminary analysis indicates that the fraction of moderately reddened quasars () which are missed by SDSS quasar survey is small. While the precise value of this fraction is somewhat model-dependent, it seems to be less than 10%.
4. The Positional Matching of SDSS and FIRST Sources
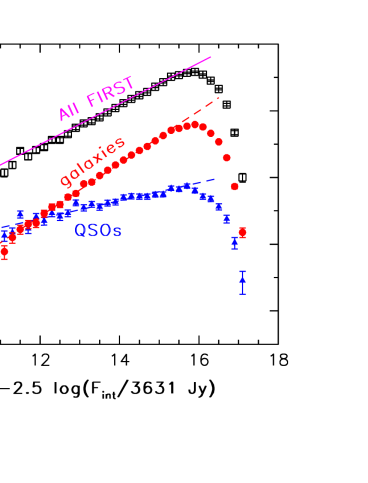
The positional matching of SDSS and FIRST sources is described in detail by Ivezić et al. 2001 (see also Menou et al. 2001 and Knapp et al. 2001). Optical identifications can be made for 31% of FIRST sources. The majority of the FIRST sources identified with an SDSS source are optically resolved, and their fraction among the matched sources is a function of the radio flux, increasing from 50% at the bright end to 90% at the FIRST faint limit (1 mJy). The cumulative fraction of the optically unresolved sources among the SDSS-FIRST matches is 16%. The colors of optically unresolved sources, as well as SDSS spectra for objects brighter than the flux cutoff for the spectroscopic targeting, indicate that they are dominated by quasars. Figure 4 compares the differential radio counts for SDSS-detected quasars, marked by dots, and galaxies, marked by triangles (we introduced an AB radio magnitude defined as , where is the total radio flux). The dashed lines show the best fits in the 11.5 15.5 range: for quasars
| (1) |
and for galaxies
| (2) |
We find no significant differences in the counts of FIRST sources with and without an optical identification: they both follow relations. To illustrate this point, we compare the sum of counts for quasars and galaxies (renormalized to account for the matching fraction), shown as open squares, to the counts of all FIRST sources, shown by the solid line. As evident, the two distributions are similar.
Based on the matched source density, by the completion of SDSS and FIRST the matched sample will include 250,000 galaxies and 50,000 quasars. As discussed in detail by Ivezić et al. 2001, the majority of these quasars are radio-loud.
4.1. The Properties of Quasars Observed by SDSS and FIRST
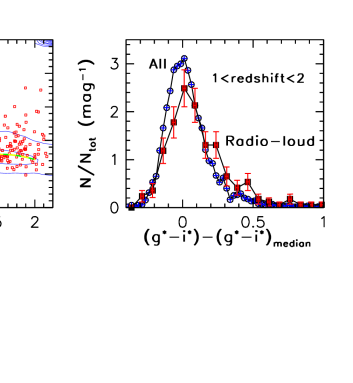
One of the most important advantages of a radio-selected sample of quasars is that it can be used to estimate the fraction of quasars with stellar colors that are missed by optical surveys, such as SDSS. The majority of optically unresolved SDSS-FIRST sources have non-stellar colors. We find that the fraction of sources with colors indistinguishable from stellar is 10%, assuming that the colors of radio-loud (, for more details see Ivezić et al. 2001) quasars are similar to the colors of radio-quiet quasars. We do, however, detect a small but statistically significant difference between the colors of radio-loud quasars and radio-quiet quasars. The left panel in Figure 5 shows the dependence of QSO - color on redshift (for a similar dependence of other SDSS colors on redshift see Richards et al. 2001). The distribution of optically selected and unresolved quasars with 19 is shown by contours. The 464 radio-loud quasars from the matched sample are shown as squares. The dashed line shows the median - color of all optically selected quasars in the redshift range 1–2, which is subtracted from the - color to obtain a color excess. The right panel compares the distribution of this color excess for all optically selected quasars in that redshift range, shown by circles, to the distribution for 225 radio-loud quasars, shown by squares. The - color-excess distribution for radio quasars appears to be different from the distribution for the whole sample. First, the median excess for the radio subsample is redder by 0.05 mag, with about significance. Second, the fraction of objects with very large color excess is larger for the radio subsample. Adopting 0.5 mag for the minimum value of the color-excess, we find that 2.40.2% of quasars have such extreme - colors, while this fraction is 7.11.8% for the radio-loud quasars.
4.2. The Properties of Galaxies Observed by SDSS and FIRST
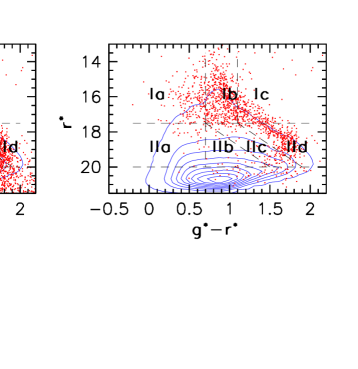
Figure 6 displays the vs. color-magnitude diagram for SDSS-FIRST galaxies, shown by dots, compared to the distribution of all SDSS galaxies, shown by linearly-spaced contours. The left panel shows the distribution of the SDSS-FIRST galaxies brighter than =21.5, and the right panel shows the distribution of galaxies for which SDSS spectra are available. For details about the spectroscopic targeting of SDSS galaxies see Strauss et al. 2001 and Eisenstein et al. 2001. The dashed lines outline regions with different galaxy morphology and fraction of radio galaxies, as listed in Table 1. At the bright optical end ( 17.5) these radio-galaxies represent 5% of all SDSS galaxies, with the radio fraction for red galaxies 2 times higher than for blue galaxies. In the magnitude range 17.5 20, 0.5% of SDSS galaxies are detected by FIRST, and the radio fraction of the reddest galaxies, dominated by giant ellipticals, is 40 times larger than the radio fraction of the bluest galaxies. We find that radio galaxies in a redshift-limited sample have statistically indistinguishable colors and luminosity distribution from other galaxies from the same volume. Nevertheless, the preliminary analysis of spectra indicates that the fraction of active galaxies is higher for the FIRST-detected galaxies than for all SDSS galaxies selected in the same regions of the optical color-magnitude diagrams. A more quantitative analysis of this effect will be presented in a future publication.
5. Discussion
The preliminary analysis of sources in common to SDSS, 2MASS and FIRST surveys indicates the enormous potential of combining the modern digital sky surveys. The eight-color highly accurate photometry, the morphological information, radio properties, and redshift information for several orders of magnitude larger samples than previously available is bound to place the studies of extragalactic sources at an entirely new level. A good example of a result made possible by both a large sample and accurate photometry is the small, yet statistically significant, difference between the optical colors of radio-loud and radio-quiet quasars. Another result with potentially large astrophysical significance is the upper limit of 10% on the fraction of quasars with stellar colors, and finding that optical colors of FIRST-detected galaxies are not significantly different from other galaxies in a volume-limited sample.
Acknowledgments
The Sloan Digital Sky Survey (SDSS) is a joint project of The University of Chicago, Fermilab, the Institute for Advanced Study, the Japan Participation Group, The Johns Hopkins University, the Max-Planck-Institute for Astronomy (MPIA), the Max-Planck-Institute for Astrophysics (MPA), New Mexico State University, Princeton University, the United States Naval Observatory, and the University of Washington. Apache Point Observatory, site of the SDSS telescopes, is operated by the Astrophysical Research Consortium (ARC). Funding for the project has been provided by the Alfred P. Sloan Foundation, the SDSS member institutions, the National Aeronautics and Space Administration, the National Science Foundation, the U.S. Department of Energy, the Japanese Monbukagakusho, and the Max Planck Society. The SDSS Web site is http://www.sdss.org/.
References
- Becker et al. 1995 Becker, R.H., White, R.L., & Helfand, D.J. 1995, ApJ, 450, 559
- Cutri et al. 2001 Cutri, R.M., 2001, in The New Era of Wide Field Astronomy, ASP Conference Series, Vol. 232. Eds. R. Clowes, A.Adamson, and G. Bromage. San Francisco: Astronomical Society of the Pacific. ISBN: 1-58381-065-X, p.78
- Eisenstein et al. 2001 Eisenstein, D., et al. 2001, in prep.
- Finlator 2000 Finlator, K., et al. 2000, AJ, 120, 2615 (F00)
- Ivezić et al. 2000 Ivezić, Ž., et al. 2000, AJ, 120, 963
- Ivezić et al. 2001 Ivezić, Ž., et al. 2001, Optical and Radio Properties of Sources Observed by the FIRST Survey and the Sloan Digital Sky Survey, in prep.
- Ivezić et al. 2002 Ivezić, Ž., et al. 2002, Optical and Infrared Colors of Extragalactic Objects Observed by the Two Micron All Sky Survey and the Sloan Digital Sky Survey, in prep.
- Ivezić, Cutri, Nelson et al. 2002 Ivezić, Ž., Cutri, R.M., Nelson, B., et al. 2002, The Properties of the 2MASS AGN Candidates Observed by the Sloan Digital Sky Survey, in prep.
- Knapp et al. 2001 Knapp, G.R., et al. 2001, in prep.
- Lupton et al. 2002 Lupton, R.H. et al. 2002, The SDSS Photometric Pipeline, in prep.
- Menou et al. 2001 Menou, K., et al. 2001, ApJ, Broad Absorption Line Quasars in the Sloan Digital Sky Survey with VLA-FIRST Radio Detections, in press (November issue), also astro-ph/0102410
- Richards et al. 2001 Richards, G.T., et al. 2001, AJ, 121, 2308
- Skrutskie et al. 1997 Skrutskie, M.F. et al. 1997, The Impact of Large-Scale Near-IR Sky Surveys, ed. F. Garzon et al. (Dordrecht: Kluwer), 25
- Stoughton et al. 2002 Stoughton, C., et al. 2002, SDSS: Early Data Release, AJ, in press
- Strateva et al. 2001 Strateva, I., et al. 2001, AJ, 122, 1861 (S01)
- Strauss et al. 2001 Strauss, M., et al. 2001, in prep.
- York et al. 2000 York, D.G., et al. 2000, AJ, 120, 1579