An SDSS Survey For Resolved Milky Way Satellite Galaxies I: Detection Limits
Abstract
We present the detection limits of a new survey for resolved low surface brightness satellite galaxies to the Milky Way, based on the Sloan Digital Sky Survey (SDSS). Our survey exploits SDSS’s major strengths (multi-color photometry, depth, large-scale, and uniformity) by combining filter smoothing with limits in both magnitude and color space to search for low surface brightness galaxies and stellar counterparts to the Compact High Velocity Clouds out to the Milky Way’s virial radius ( kpc). Our calculated detection limits for a purely old stellar population vary with galaxy size and distance between 26.7 and 30.1 mag/. These limits will allow us to detect systems whose surface brightnesses are .5-3.9 mag/ fainter than Sextans, the lowest surface brightness Local Group member known. Our survey not only is sensitive to lower surface brightness stellar populations than possible with previous Local Group surveys, but will also allow us to make an unbiased and well defined assessment of the completeness of the observed Local Group galaxy luminosity function, so that we may compare the results with the predictions of various structure formation scenarios.
Subject headings:
(galaxies:) Local Group — surveys .1. Introduction
Detailed investigation of the faint end of the Local Group (LG) luminosity function yields several constraints on the process of galaxy formation. First, the faint end of the LG luminosity function hosts the highest M/L, lowest mass and lowest luminosity systems accessible for study, allowing us to probe the extreme limits of galaxy formation pathways. Second, these galaxies are sufficiently close that they can be resolved into individual stars, permitting direct study of their detailed star formation history and their chemical and dynamical evolution. Third, the number of the lowest mass LG halos and their observed mass profiles can be used to help distinguish between various dark matter, structure formation, and reionization scenarios.
In particular, results of recent N-body simulations have reignited a need for a well-defined and unbiased measurement of the galaxy mass function down to the lowest possible scales. These simulations suggest that both ”standard” and +Cold Dark Matter (CDM) cosmologies overpredict the number of low mass dark matter halos around the Milky Way and M31 by over an order of magnitude (Klypin et al. 1999, Moore et al. 1999), compared to existing catalogs of the Local Group (see §2). Many solutions to this discrepancy between theory and observations have been suggested, including: modification of the traditional CDM paradigm with warm (Hogan & Dalcanton 2000) or self interacting dark matter (Spergel & Steinhardt 2000) and inclusion of dynamical friction, tidal stripping and reionization on the results of cosmological formation simulations (Bullock, Kravtsov & Weinberg 2000a and b). However, the possibility remains that the discrepancy at least partially results from under counting the population of dwarfs in the Local Group (e.g. the predictions of Benson et al. 2001).
Roughly 40 dwarf galaxy members of the Local Group have been identified to date, 9 of which are dwarf spheroidal companions to the Milky Way (Mateo 1998). Several of these LG dwarfs have only been discovered within the last few years. Empirically, these recent discoveries of new Local Group members (for example, Whiting, Hau & Irwin 1999, Armandroff, Davies & Jacoby 1998, Karachentsev & Karachentseva 1999) suggest that we have not necessarily identified all of the faint Local Group galaxies accessible with existing large-sky survey data.
These recent discoveries resulted from large-area searches that attempted to rectify incompleteness in Local Group membership. The surveys have generally fallen into one of two categories: visual searches of unprocessed POSS-II (Karachentsev & Karachentseva 1999) or ESO/SERC survey plates (Whiting, Irwin & Hau, 1997, Whiting, Hau & Irwin 1999, Karachentsev et al. 2000, Karachentseva & Karachentsev 2000) or visual searches of digitally scanned and filtered POSS-II images (Armandroff, Davies & Jacoby 1998, Armandroff, Jacoby & Davies, 1999). Even these most recent identifications of new Local Group members have, on some level, required visual evaluation of images, and thus are prone to selection effects which are difficult to quantify. They are also fundamentally limited in surface brightness, due to the limited contrast of sparse dwarf spheroidals against the noise of the sky background.
We anticipate that substantial progress towards completeness and uniformity in the known luminosity function can be made with the Sloan Digital Sky Survey (SDSS) (York et al 2000), an on going 5-color large area CCD survey that will encompass a quarter of the celestial sphere. Instead of searching for smooth overdensities of diffuse stellar light, we will isolate overdensities of resolved stars, taking advantage of SDSS’s faint photometric limits, multiple filters, and robust star-galaxy separation (Ivezić et al 2000).
A survey based on resolved stars has a number of benefits. Use of resolved stars allows us to substantially suppress galactic foreground stars relative to a galaxy’s resolved stellar population (see §3 and 5) by analyzing data in small bins of color and/or magnitude. As we show below, these cuts can greatly increase the contrast of the dwarf galaxy against the background, and should allow us to reach unprecedentedly low surface brightnesses. Also, unlike surveys for Local Group galaxies based on diffuse light, a survey using a red color cut and resolved stellar counts will not be biased towards detecting galaxies with recent star formation. By identifying galaxies by their resolved stars, we remove a bias towards detecting galaxies with young main sequence stars, which contribute a disproportionate fraction of the total light of a galaxy relative to the number of stars they represent.
In this paper, we describe the particular survey we have undertaken with the SDSS imaging data set. We begin by describing the likely prospects for the existence of undetected dwarf galaxies in §2. We then describe the actual survey in §3, calculate the detection limits in §4, present the results in §5, and demonstrate our approach using the Draco dSph in §6. The prospects for future work on the survey and the application to the regions near Compact High Velocity Clouds (Braun & Burton 1999, see also Willman et al, in preparation) are then considered in §7.
2. Predictions of Existing N-body Simulations
The first issue we wish to investigate is whether there is any compelling expectation that new Local Group dwarfs might remain undetected within the virial radius of the Milky Way. If CDM is the correct description of dark matter, then the current generation of N-body simulations suggest that there is indeed fertile ground for discovering new dwarfs in our local neighborhood. For example, Moore et al (1999)’s CDM simulations predict over 400 substructures within the Milky Way’s virial radius, roughly 10 of which have a circular velocity, 30 km/sec (where ). Assuming a homogeneous spatial distribution, these numbers translate to approximately 100 subhalos within the volume that we can probe with SDSS. For halos with 30 km/sec, these numbers are significantly reduced by reionization, dynamical friction, tidal stripping and gas dynamics (Thoul & Weinberg 1996, Quinn et al. 1996, Bullock, Kravtsov, & Weinberg 2000a and b, Benson et al. 2001), although the degree to which these processes play a role is uncertain. For example, the results of recent simulations of the tidal stirring of dwarf galaxies (Mayer et al 2001) suggest that previous estimates of tidal disruption as a means to destroy low mass halos may have been overestimated.
The above modifications of CDM simulations may well produce observable consequences. For example, if the central densities of dark matter halos increase with decreasing mass, as CDM predicts, then there may be observable dense stellar cores left as remnants of any disruption process. Likewise, if CDM is not the correct form of dark matter, then the number of halos is also likely to be lower.
Independent of the number of halos which may be expected in a particular cosmological scenario, our survey will be sensitive to a range of galaxy structural parameters which have been previously inaccessible to existing surveys. We anticipate that we could detect new galaxies with comparable masses and distances of known MW companions but higher mass-to-light ratios, and thus lower surface brightnesses and/or those galaxies with similar mass-to-light ratios as known MW companions but lower masses, and thus lower surface brightnesses. It is unclear whether such lower mass systems would host a detectable stellar population, as any gas initially accreted in such halos may be unable to cool, and could “boil out” after reionization (see Barkana & Loeb 1999). However, the detection or non-detection of lower mass dwarfs will place constraints on any such line of reasoning.
3. Methodology of Survey
3.1. Sloan Digital Sky Survey Data
The Sloan Digital Sky Survey will cover steradians in the North Galactic Cap. The sky will be observed nearly simultaneously through 5 broad photometric filters ( and ) and will be complete (S:N 5:1) to limiting magnitudes of roughly 22.3, 23.3, 23.1, 22.3 and 20.8 respectively (see Fukugita et al. (1996) for details of Sloan’s photometric system). The photometric calibration system for SDSS filters has not yet been finalized, so the preliminary magnitudes as presented in this paper will be denoted as ,,,, and . The system used in this paper will differ absolutely from the final photometric system by only a few percent in every band except for , where it will differ by no more than (Yanny et al 2000). The imaging data are taken in drift-scan mode by a camera consisting of 30 2048x2048 CCDs (see Gunn et al. (1998) for details on the camera used for SDSS). SDSS’s accurate astrometry combined with color and morphological information derived from the digital images provides robust star-galaxy separation to a limiting magnitude of 21.5 (Ivezić et al 2000). See York et al (2000) and references therein for an overview of the project and further details about the photometric survey.
For this paper, we used data from runs 94 and 125 taken in Spring ’99 and Fall ’98. Each run is composed of 6 parallel strips that are separated by 0.2 degrees. The full 2.5 degree wide equatorial stripe is then composed of 12 interleaved strips from 2 slightly offset runs observed a few days apart (Yanny et al 2000).
All magnitudes presented in this paper have been corrected for reddening due to Galactic extinction with the maps of Schlegel, Finkbeiner and Davis (1998).
3.2. Survey Technique
We identify candidate dwarf galaxies as spatial overdensities of resolved stars in subfields of SDSS data. Assuming foreground stars are approximately spatially uncorrelated, Poissonian fluctuations govern the random noise in the stellar foreground. Therefore, to increase the contrast of extragalactic systems against the foreground of Milky Way stars, we apply magnitude binning and color selection criteria to the stellar sources in a field. Stars which pass the criteria are binned into a spatial array, which is then smoothed with an exponential filter. Candidates are automatically identified as overdensities in the smoothed sky map. Each field of sky is analyzed multiple times, once for each magnitude bin combined with either a red color cut or no color cut.
These techniques have been utilized in different forms in other Local Group surveys. For example, Armandroff et al (1998) convolved digitized red POSSII images with a ”square spatial median filter” before visually identifying candidates for unresolved M31 companions. Other groups working with SDSS data have used a number of similar methods to trace substructure in the Milky Way’s halo. Yanny et al. (2000) demonstrate that a color cut can isolate faint A stars, which can be used to trace nearby halo substructures when analyzed in position-magnitude space. Odenkirchen et al. (2001a and b) use specialized color-magnitude templates tailored for the stellar populations of Palomar 5 and Draco, to trace their structure to fainter levels than possible with the generalized scheme presented here.
3.2.1 Color Cut for Red Stellar Sources
In galaxies more distant than 125 kpc, only red giant branch and (for the nearest systems) horizontal branch stars are bright enough to be resolved by SDSS. Therefore, to optimize analyses for extragalactic systems, we have chosen a color-color cut to select stars with colors consistent with those of a metal poor red giant branch population (although Sloan’s photometric system may not be able to distinguish a red giant from a red dwarf). A cut in the colors and (Figure 1) was selected based upon Krisciunas et al’s (1998) observation of the globular cluster M15 ([Fe/H] = -2.22) through Sloan filters, Lenz et al’s (1998) theoretical colors of stars in Sloan filters for a range of metallicities and surface gravities, and a linear fit to the observed SDSS stellar locus (Ivezić, private communication) coupled with a color-magnitude diagram (CMD) of the globular cluster Palomar 5 ([Fe/H] = -1.38) created with SDSS commissioning data (Figure 2). Because the average photometric errors in the faintest magnitude bins are the half width of the color cut in (0.05 mag), stars are only required to have a chance of fulfilling the color criteria, given photometric errors, to satisfy the cut. We chose this lower probability limit to be less than so that, when photometric errors are considered, stars whose quoted colors lie outside the color cut may scatter back in. In particular, we chose the limit to be no less than so that only stars whose colors are less than outside of the color cut may scatter back in. This loose restriction on the color cut also allows for the fact that the psf magnitude quoted in the survey are systematically underestimated by (Stoughton et al., 2001).
When the red color cut is applied to field stellar sources with 17.0 21.5, as shown in Figure 1, approximately 3/4 of field stars are eliminated. Figure 3 shows the color cut applied to the Galactic globular cluster Palomar 5, where the cluster stars that satisfy the cut are denoted with s. In Figure 3, the red giant branch colors would shift down and to the left with decreasing metallicity.
In §5 we demonstrate that we expect this color cut to enhance detection sensitivity for galaxies more distant than 50 kpc. Closer than this, however, main sequence stars, that do not satisfy the color cut, make a substantial contribution to the resolved stellar luminosity function (LF), and including the cut reduces our sensitivity. Thus, we chose to analyze the data both with and without the red cut, to optimize our sensitivity to both distant and nearby galaxies, respectively.
3.2.2 Binning in Magnitude Space
We can also increase our sensitivity by limiting our analysis to small bins in magnitude space. Limiting our analysis by magnitude serves to isolate the subset of the resolved stellar population that produces the strongest signal over the foreground noise. For example, the only stars resolved in the most distant old population systems within our virial radius would be red giant branch stars with 20.0. Including stellar sources brighter than 20.0 in the analysis adds greatly to the noise and nothing to the signal. Likewise, for a somewhat closer system, the magnitude bin containing a more densely populated portion of the lower red giant branch would provide the strongest signal over the foreground noise.
We apply the magnitude cuts in overlapping bins of 1.5 magnitude width spanning . The upper limit of this range represents the magnitude to which the star-galaxy separation is reliable (eg. at = 21.5 the star-galaxy classification is repeatable at a level better than ) (Lupton et al. 2001, in preparation, and Yasuda et al 2001).
3.2.3 Smoothing with Exponential Filter
Many groups have found that spatial smoothing increases their sensitivity to LSB galaxies (for example, Davies et al. (1994) and Armandroff, Davies & Jacoby (1998)). A smoothing filter serves to suppress random fluctuations in foreground field stars, increasing the signal-to-noise of fluctuations on scales comparable to the size of the smoothing kernel. Davies et al. (1994) show that convolution filters that match the scale length of a low surface brightness (LSB) galaxy within a factor of 2 still serve to nearly maximally enhance the galaxy signal for detection. For our general survey, we will smooth the spatial array of stellar sources that satisfy color and magnitude cuts with a exponential filter, to optimally enhance the signal from galaxies with physical scale lengths matching those of the known LG dwarfs and with distances between 30 and 350 kpc. We will also use a 7’ smoothing filter in a more targeted analysis of regions containing known Compact High Velocity Clouds, to better match their observed sizes (see Braun & Burton 1999).
3.3. Detection Criteria
Once the stellar sources have been restricted in magnitude and color, and their surface density spatially smoothed, we use a minimum signal threshold and a minimum size as the two primary criteria for candidate selection.
The minimum signal threshold is defined as a surface density fluctuation which is above the stellar foreground density. We choose the signal threshold such that, for a given smoothing length, there is no more than expected false detection per 100 square degrees of sky, in the absence of any other discriminant besides minimum size. Contiguous regions whose signal exceeds the threshold and are larger than (smoothing length/2)2, satisfy the minimum size requirement. This requirement eliminates many spurious detections of only one or two square arcminutes.
We create a color-magnitude diagram each galaxy candidate’s resolved stars, which we can use to identify the source of the detection and discriminate against possible contaminants. Possible contaminants will include both completely false detections due to rare random positive fluctuations and clusters of galaxies, which may be a problem in the faintest magnitude bins where star-galaxy separation is difficult.
4. Determining Detection Limits
The detection limits of this survey are primarily a function of the stellar surface densities produced by different types of potential new Local Group galaxies and the fluctuation level of the foreground stellar surface density above which galaxies must be detected. We simulated the stellar surface density of old population Local Group galaxies at a range of sizes and distances, by creating template stellar luminosity functions from SDSS observations of the globular cluster Palomar 5. We used a foreground stellar field from the SDSS data to determine the effect of color and magnitude criteria on the foreground fluctuation level.
4.1. Stellar Luminosity Function of Palomar 5
Located 22.6 kpc from the Sun, Palomar 5 (Pal 5) has a large core radius ( = 2.9 pc), a low central surface brightness () and a moderately high metallicity ([Fe/H] = -1.38) for a globular cluster (Harris 1996). Smith et al. (1986) use isochrone fitting to infer an age of 14-15 Gyr for the cluster, which is comparable to the ages of the oldest populations in most known LG dwarf galaxies (Mateo 1998). The metallicities of the known Local Group dwarfs range from [Fe/H] = -0.8 to -2.2, which are also comparable to the metallicity of Palomar 5.
We note that the stellar population of Palomar 5 may contain departures from that of a ”typical” globular cluster (GC). Low mass stars and stars in the base of the subgiant branch appear to be underpopulated (Smith et al 1996) and the horizontal branch appears to be overpopulated relative to the main sequence (Sandage & Hartwick 1977) when compared with the luminosity function of M3. These departures are likely due to the ongoing tidal disruption of the Pal 5 system (Odenkirchen et al. 2001a). Despite these possible departures from the typical stellar distribution of an old population, Pal 5’s proximity and low central surface brightness allow us both to characterize an old stellar population’s CMD beyond the main sequence turnoff and not worry about the effects of crowding in the central regions when creating the stellar templates from the data. In our final analysis of the survey results when the SDSS is complete, we will be able to use a superposition of a number of observed dwarf galaxy populations to create a more precise template. However, we have already repeated the entire analysis presented in this paper with the SDSS observations of the Draco dSph (see §6), and the resultant detection limits differed from the ones determined using only Pal 5 as the template, from insignificantly up to a couple tenths of a magnitude (depending on the galaxy size and distance).
We constructed Pal 5’s stellar LF from the SDSS data by magnitude binning its stars, with and without a color cut, and subtracting the mean stellar luminosity function of the surrounding field. Figure 4 shows the resulting luminosity functions. We then projected the LF to systems with distances ranging from to roughly 350 kpc. The new LF was constructed by shifting the color-magnitude diagram fainter and recalculating the luminosity function. The surface density of stellar counts was then scaled by distance squared.
4.2. Calculating Limiting
We calculate the survey’s limiting for galaxies with a range of exponential scale lengths and distances. To determine the limits, we created numerous galaxies with a range of surface brightnesses, sizes, and distances, placed them in constructed spatial arrays of foreground stars and applied our survey algorithm to the resultant artificial data sets.
Our simulated galaxies were given exponential scale lengths and distances that ranged between 1′ and 13′ and 23 to 350 kpc. For each set of parameters, we created 500 trial galaxies in a range of surface brightness centered around an initial ’best guess’ detection limit. Each trial galaxy was populated with an integral number of stars drawn from a Poisson distribution of the Palomar 5 stellar surface density template appropriate to the distance and scaled to the appropriate surface brightness for the specific trial.
We created the stellar foreground spatial array by calculating the surface density of stellar sources observed by SDSS around and assuming a random stellar distribution. This assumption will tend to underestimate , since foreground stars may be somewhat correlated.
Once we analyzed the artifical data sets with our survey algorithm, we did a linear fit to determine the surface brightness at which there is a 50 detection efficiency for galaxies at each combination of size and distance.
4.3. Caveats
There are a few important caveats which can affect the universality of the detection limits calculated above. First, all of the limits presented are dependent on the details of a stellar system’s star formation history. The fact that Palomar 5 is a purely old population stellar system results in detection limits for only the old stellar population in a galaxy. Recent star formation adds more to a galaxy’s surface brightness than to the overall stellar counts, so our calculated ’s are only upper limits (lower limits in brightness) for galaxies with star formation within the last 10 Gyr.
Second, the limits are dependent on the particular and of the foreground field. We calculated detection limits for a direction representative of the region , but the actual limits will be brighter as one looks closer to the Galactic plane and, likewise, fainter as one looks towards the Galactic pole.
Also, as mentioned above, we may be underestimating of the stellar foreground due to our assumption of a random foreground stellar distribution.
5. Resulting Detection Limits
Figure 5 displays the detection limits of our survey, performed both with and without the red color cut, as a function of galaxy physical scale length and distance. Each line follows the detection limit for a galaxy of a given exponential scale length (in pc) as it moves further away. Open points represent the known Milky Way galaxy companions fainter than , including Sextans, the lowest surface brightness Local Group member with a of 26.2 (Mateo 1998). These points are given as lower limits, since the limiting is calculated for a purely old stellar population (see §4.3), and some dwarf spheroidals show signs of more recent star formation. Comparison of the two panels shows that for all but the closest distances, the red color cut makes a notable improvement in galaxy detectability.
The most obvious and general result of our analysis is that our survey will be sensitive to dwarf galaxies, within the Galaxy’s virial radius, with unprecedentedly low surface brightnesses. In addition to this, our limits display 2 general trends: 1) larger scale length systems are easier to detect at a given distance and 2) the red color cut causes systems with pc to have a SNR that does not decrease with distance. The first trend simply results from the fact that the signal from a galaxy with a larger angular scale length falls off less quickly than that with a smaller length. The second trend, although perhaps initially counterintuitive, is due to two combined effects: a system’s surface brightness remains constant with distance, but its stellar density increases with distance squared, and outer halo stellar populations can only be detected in the magnitude bins containing their RGB stars, which are specifically selected by the color cut.
6. Application of Survey Technique to Draco dSph
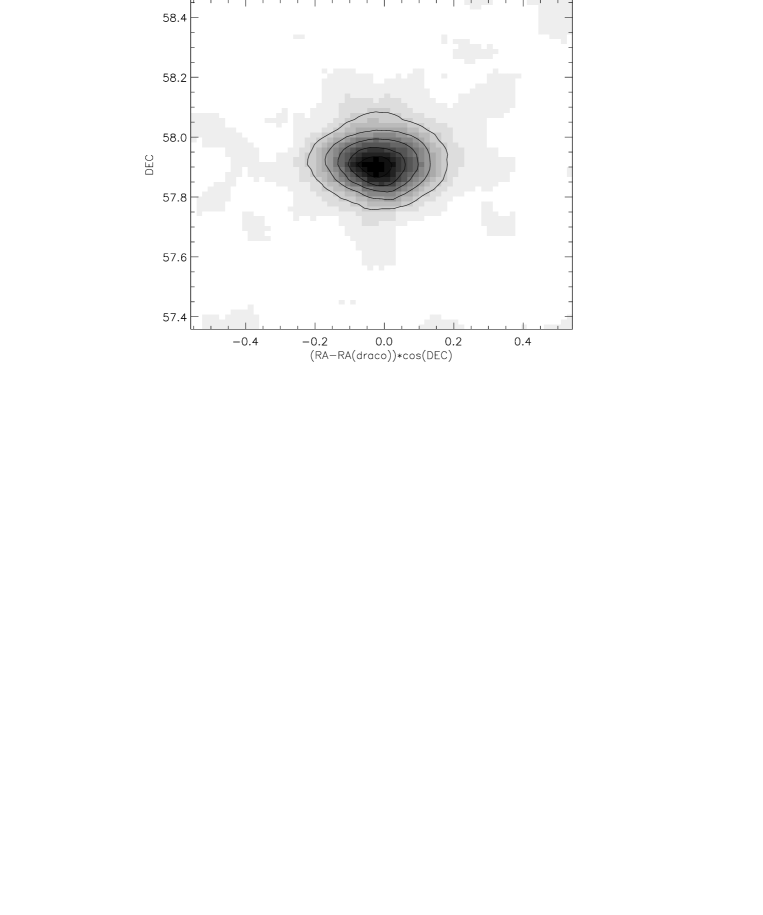
To demonstrate our methodology and to test the feasibility of the detection limits presented above, we analyzed a field centered on the Draco dSph galaxy, which was recently by SDSS in data runs 1356 and 1359. Draco has a distance of 82 kpc, of 4.5′, and a central surface brightness mag/. Draco is one of the two least luminous galaxy in the Local Group, with and (Mateo 1998). Figure 6 shows a smoothed stellar density map of Draco with overlaid contours, where each contour represents a fluctuation above the mean smoothed stellar distribution. This map was constructed from stars with 19.5 21.0 that pass the red color cut. One can see that our survey identifies the central regions of Draco at a level of above the field.
This result confirms that on the angular scale of Draco, we should be able to detect systems at least 2.5log() mag/ fainter than Draco, or mag/. This is in good agreement with our expectations from Figure 5 (roughly mag/ for a scale length galaxy at 80 kpc). The .8 magnitude offset between the Draco observation and our calculated limit is easily accounted for by the facts that Draco lies closer to the galactic plane than the region we used to calculate our detection limits, so the density of the stellar foreground is about x greater than our artificial foreground field and we have assumed a spatially uncorrelated foreground distribution in our calculations.
7. Conclusion
We have presented approximate detection limits of a new Local Group survey for resolved low surface brightness galaxies. Our detection limits for a purely old stellar population vary with galaxy size and distance between about 26.7 and 30.1, and are .5-3.9 mags/ fainter than the lowest surface brightness Local Group members known.
Our survey will provide a much needed systematic analysis of the content of the Local Group for comparison with theoretical cosmological models of structure formation. Independent of whether or not we do detect additional faint end Local Group galaxies or stellar counterparts with the Compact High Velocity Clouds, our calculated detection limits will quantitatively describe the region of unsampled Local Group parameter space for the first time and, therefore, still yield valuable constraints on various structure formation scenarios.
References
- Armandroff, Davies & Jacoby (1998) Armandroff, T. E., Davies, J. E., Jacoby, G. H. 1998, AJ, 116, 2287
- (2) Armandroff, T. E., Jacoby, G. H., & Davies, J. E. 1999, AJ, 118, 1220
- (3) Barkana, R., & Loeb, A. 1999, ApJ, 523, 54
- (4) Benson, A. J., Frenk, C. S., Lacey, C. G., Baugh, C. M., & Cole, S., 2001, preprint, astro-ph/0108218
- Braun and Burton (1999) Braun, R., & Burton, W.B., 1999, A&A, 341, 437
- Bullock, Kravtsov and Weinberg (2000a) Bullock, J., Kravtsov, A. V. Weinberg, D. H. 2000, ApJ, 539, 517
- Bullock, Kravtsov and Weinberg (2000b) Bullock, J., Kravtsov, A. V. Weinberg, D. H. 2000, ApJ, submitted (astro-ph/0007295)
- Davies et al. (1994) Davies, J.I., Disney, M.J., Phillipps,S., Boyle, B.J. Couch, W.J. 1994, MNRAS, 269, 349
- Fukugita et al. (1996) Fukugita, M., Ichikawa, T., Gunn, J. E., Doi, M., Shimasaku, K., & Schneider, D. P. 1996, AJ, 111, 1748
- Gunn et al. (1998) Gunn, J. E., et al. 1998, AJ, 116, 3040
- Harris W.E. (1996) Harris, W. E. 1996, AJ, 112, 1487
- (12) Hogan, C. J., Dalcanton, J. 2000, PhRvD, 62, 817
- Karachentsev and Karachentseva (1999) Karachentseva, I. D., Karachentsev, V. E. 1999 A&A, 127, 409
- Karachentsev and Karachentseva (2000) Karachentseva, V. E., Karachentsev, I. D. 2000 AAS, 146, 359
- (15) Karachentsev, I. D., Karachentseva, V. E., Suchkov, A. A., Grebel E. K. 2000 AAS, 145, 415
- Klypin et al. (1999) Klypin, A. A., Kravtsov, A. V., Valenzuela, O., Prada, F. 1999, ApJ, 522, 82
- Krisciunas, Margon, Szkody (1998) Krisciunas, K, Margon, B, Szkody, P. 1998, PASP, 110, 1342
- Ivezić et al (2000) Ivezic, Z. et. al. 2000, AJ, 120, 963
- Lenz et al. (1998) Lenz, D.D., Newberg, H.J., Rosner, R., Richards, G.T. Stoughton, C. 1998, ApJS, 119, 121L
- Mateo (1998) Mateo, M. 1998 ARA&A, 36, 435
- Mayer et al (2001) Mayer, L., Governato, F., Colpi, M., Moore, B., Quinn, T., Wadsley, J., Stadel, J., Lake, G. 2001, ApJ, in press (astro-ph/0103430)
- Moore et al (1999) Moore, B., Ghigna, S., Governato, F., Lake, G., Quinn, T., Stadel, J., Tozzi, P. 1999, ApJ, 524, 19L
- (23) Odenkirchen, M., et al. 2001a, ApJ, 548, L165
- (24) Odenkirchen, M., et al. 2001b, AJ, submitted (astro-ph/0108100)
- Quinn et al (1996) Quinn, T., Katz, N., & Efstathiou, G. 1996, MNRAS, 278, L49
- Sandage and Hartwick (1977) Sandage, A. Hartwick, F. D. A. 1977, ApJ, 82, 459
- Schlegel, Finkbeiner and Davis (1998) Schlegel, D.J., Finkbeiner, D.P., Davis, M. 1998, ApJ, 500, 525
- Smith et al. (1986) Smith, G. H., McClure, R. D., Stetson, P. B., Hesser, J. E. Bell, R. A. 1986, AJ, 91, 842
- Spergel and Steinhardt (2000) Spergel, D. N. Steinhardt, P. J. 2000, Phys. Rev. Lett., 84, 3760
- (30) Stoughton, C., et al. 2001, in preparation
- Thoul and Weinberg (1996) Thoul, A.A., Weinberg, D.H. 1996, ApJ, 465, 608
- Whiting, Irwin and Hau (1997) Whiting, A. B., Irwin, M., Hau, G. K. T. 1997, AJ, 114, 996
- Whiting, Hau and Irwin (1999) Whiting, A. B., Hau, G. K. T. Irwin, M. 1999, AJ, 118, 2767
- Yanny et al (2000) Yanny, B. et al. 2000, ApJ, 540, 825
- Yasuda et al (2001) Yasuda, N. et al. 2001, AJ, in press
- York et al (2000) York, D. G., et al. 2000, AJ, 120, 1579