An X-ray Selected Galaxy Cluster at in the Rosat Deep Cluster Survey11affiliation: Based in part on observations obtained at the W.M. Keck Observatory 22affiliation: Based in part on observations obtained at Palomar Observatory 33affiliation: Based in part on observations obtained with the Chandra Observatory
Abstract
We report the discovery of an X-ray luminous galaxy cluster at . RDCS J0910+5422 was selected as an X-ray cluster candidate in the ROSAT Deep Cluster Survey on the basis of its spatial extent in a Rosat PSPC image. Deep optical and near-IR imaging reveal a red galaxy overdensity around the peak of the X-ray emission, with a significant excess of objects with and colors typical of elliptical galaxies at . Spectroscopic observations at the Keck II telescope secured 9 galaxy redshifts in the range yielding a mean cluster redshift of . Eight of these galaxies lie within a 30 arcsec radius around the peak X–ray emission. A deep Chandra ACIS exposure on this field shows extended X-ray morphology and allows the X-ray spectrum of the intracluster medium to be measured. The cluster has a bolometric luminosity ergs s-1, a temperature of keV, and a mass within Mpc of ( km s-1 Mpc-1, , and ). The spatial distribution of the cluster members is elongated, which is not due to an observational selection effect, and followed by the X-ray morphology. The X-ray surface brightness profile and the spectrophotometric properties of the cluster members suggest that this is an example of a massive cluster in an advanced stage of formation with a hot ICM and an old galaxy population already in place at .
1 Introduction
The identification and study of distant galaxy clusters is of great interest in current astronomical research. As the largest gravitationally bound structures in the universe, the properties and histories of galaxy clusters are highly sensitive to the physics of cosmic structure formation and to the values of the fundamental cosmological parameters (Eke et al., 1996; Bahcall et al., 1997). While clusters in such well-defined samples as the Rosat Deep Cluster Survey (Rosati et al., 1998, RDCS) have been used to constrain and (Borgani et al., 2001a), the uncertainty in the relation between cluster mass and measurables such as or limits the precision obtainable in calculations of cosmological parameters to 50%. To improve on this, a better understanding of the mass– relation and its evolution is necessary. To that end, we need to study in detail a well-defined sample of clusters at high redshift with independent measures of the cluster mass based on (Evrard et al., 1996) and weak lensing (Tyson et al., 1990).
Another equally important use of galaxy clusters lies in studying the formation and evolution of galaxy populations. Progress in understanding early-type galaxy evolution in clusters is being driven by the need to reproduce recent observational results indicating both lower number fractions (Dressler et al., 1997; Couch et al., 1998; van Dokkum et al., 2000) and strong homogeneity and slow evolution in the stellar populations of ellipticals and S0s in moderate redshift clusters (Aragon-Salamanca et al., 1993; Ellis et al., 1997; Stanford et al., 1998; Pahre, 1998; Bender et al., 1998; van Dokkum et al., 1998a; De Propris et al., 1999; Kelson et al., 2000). A self-consistent explanation of these results can be achieved by invoking an observational bias: the progenitors of the youngest, low-redshift early-types drop out of samples constructed in high redshift clusters. van Dokkum & Franx (2001a) have suggested how morphological evolution at coupled with star formation at (, ) can explain the results cited above. More complex semi-analytic models of galaxy formation and evolution set in a CDM universe naturally predict the morphological evolution that is a central tenet in the currently fashionable paradigm of cluster galaxy evolution: ellipticals are formed by mergers at of sub galaxies formed at (van Dokkum et al., 1999), and the Butcher-Oemler effect is the result of spirals being converted into S0s at moderate redshifts (Dressler et al., 1997). For example, the models of Kauffmann & Charlot (1998) are able to match the small scatter in the color-mag relation of the early-types even at , and the evolution found by e.g. van Dokkum et al. (1998b) can be predicted (Diaferio et al., 2001). However the accuracy as well as the details of this scenario for galaxy evolution in clusters is yet open to debate. In the case of the early-types, the arguments are based heavily on observations of only a few high-z clusters e.g., MS105403 at (van Dokkum et al., 1998b).
Finding clusters at moderate redshifts has become almost routine using serendipitous X-ray searches. The advent of the ROSAT-PSPC, with its unprecedented sensitivity and spatial resolution, enabled archival searches for extended X-ray sources to become a very efficient method to construct large, homogeneous samples of galaxy clusters out to (Rosati et al., 1998; Scharf et al., 1997; Collins et al., 1997; Vihklinin et al., 1998). The RDCS has shown no evidence of a decline in the space density of galaxy clusters of X-ray luminosity over a wide redshift range, (see Rosati 2000 for a recent review), though the evolution of the bright end remains controversial. The fact that the bulk of the X-ray cluster population is not evolving significantly out to this large redshift increases the chances of finding clusters at even higher redshifts, since clusters at ( in the [0.5-2.0] keV band, roughly the Coma cluster) can be detected as extended X-ray sources in deep ROSAT pointed observations, provided that the X-ray surface brightness profile does not evolve significantly.
At fainter fluxes ( in the RDCS) the identification of real clusters becomes more difficult due to the increasing confusion and low signal-to-noise ratio of the X-ray sources which makes it more difficult to discriminate between point-like and extended sources. Below the X-ray completeness level can be as low as 50%, and the spurious rate as high as 50%. But it is at these flux levels that the most distant clusters in the survey are expected. To improve the success rate of identifying very high redshift clusters in the RDCS, we have been carrying out a program of near-infrared imaging of faint unidentified X-ray candidates. Relative to the optical, near-IR imaging is advantageous at high redshifts because the expected k-correction significantly dims the dominant population of early-type cluster galaxies in even the observed -band for . Stanford et al. (1997) have shown that optical-infrared colors can be used to considerably enhance the contrast of high redshift cluster galaxies against the field galaxy population and, at the same time, to obtain a useful estimate of the cluster redshift. The cluster found by Stanford et al. (1997), RDCS J0848+4453 at , and its neighbor, RDCS J0849+4452 at (Rosati et al., 1999), have been used to push the study of evolution in the colors and morphology of early-type galaxies beyond . But such studies continue to be severely limited by the dearth of such high redshift clusters (Dickinson, 1997; Fabian et al., 2001).
In this paper, we describe the imaging and spectroscopic follow-up observations of the extended X-ray source RDCS J0910+5422, which has led to the discovery of a galaxy cluster at . Unless otherwise stated, we adopt the parameters km s-1 Mpc-1, , and .
2 Observations
2.1 Optical and IR Imaging
The extended X-ray source RDCS J0910+5422 was selected from a deep ROSAT-PSPC observation; details of the selection procedure are given in Rosati et al. (1999). The candidate field was observed in the optical at the Palomar 5 m telescope with COSMIC, which contains a TEK3 CCD that provides pixels over a 9.5 arcmin field of view. An exposure of 2820 s was obtained in the gunn -band on 18 February 1999 UT in non-photometric conditions with seeing. The field was observed again with COSMIC in the gunn -band in photometric conditions for 300 s on 2000 April 30. 5 standard stars were observed on the latter night and used to calibrate the photometry onto the Vega system. The data were reduced using standard methods. The second observation was used to calibrate the deeper, nonphotometric image before the two reduced images were summed.
We obtained and imaging at the Palomar 5 m telescope with the Prime-Focus Infrared Camera (Jarrett et al., 1994). This camera provides a field of view with pixels. RDCS J0910+5422 was observed in photometric conditions on 1998 March 24. The flux scale was calibrated using observations of three UKIRT standard stars obtained on the same night. The data were taken using a sequence of dither motions with a typical amplitude of 15″ and a dwell time between dithers of 30 seconds. The data were linearized using an empirically measured linearity curve, and reduced using DIMSUM111 Deep Infrared Mosaicing Software, a package of IRAF scripts available at ftp://iraf.noao.edu/contrib/dimsumV2. The total integration times and resolutions of the resulting images are 2310 s and at , and 2880 s and at .
A catalog of objects in the -band image was obtained using SExtractor (Bertin & Arnouts, 1996) after first geometrically transforming the and images to match the -band frame. The resolution of the IR images was also degraded slightly to match that of the -band image. Objects were detected on the -band image with the requirement that 10 contiguous pixels, covering an area of 0.78 arcsec2, must be 1.5 above the background. For reference the 3 detection limit is in a 2 arcsec aperture. All detected objects down to this limit were inspected visually to eliminate false detections. The catalog was then applied to the and band images to obtain matched aperture photometry.
2.2 Keck Spectroscopy
Spectroscopic observations of galaxies in a 6′ region around RDCS J0910+5422 were obtained using the Low Resolution Imaging Spectrometer (Oke et al., 1995, LRIS) on the Keck II telescope. Objects were assigned slits based on their and colors. Spectra were obtained using the 150 l mm-1 grating which is blazed at 7500 Å, and covers the entire optical region, with a gradual blue cutoff imposed by the LRIS optics at 5000 Å. The dispersion of 4.8 Å pixel-1 resulted in a spectral resolution of 23 Å as measured by the FWHM of emission lines in arc lamp spectra. Usually each mask was observed in a series of 1800 s exposures, with small spatial offsets along the long axis of the slitlets. One slitmask on the field was used to obtain spectra on 1999 March 10 with a total exposure time of 7200 s, and a second slitmask was used on 2000 February 18 for a total of 10800 s.
The slitmask data were separated into individual slitlet spectra and then reduced using standard longslit techniques. A fringe frame was constructed for each exposure from neighboring frames in the observation sequence and then subtracted from each exposure to greatly reduce fringing in the red. The exposures for each slitlet were reduced separately and then coadded. One–dimensional spectra were extracted for each of the targeted objects. Wavelength calibration of the 1-D spectra was obtained from arc lamp exposures taken immediately after the object exposures. A relative flux calibration was obtained from longslit observations of the standard stars HZ 44 and G191B2B (Massey et al., 1988; Massey & Gronwall, 1990). While these spectra do not straightforwardly yield an absolute flux calibration of the slit mask data, the relative calibration of the spectral shapes is accurate.
2.3 Chandra Imaging
RDCS J0910+5422 was observed for a total of 200 ks in two pointings in observation 800166 with ACIS-I. The first pointing, exposure ID#2452, was performed on 2001 April 24 for 76 ks while the second pointing, exposure ID#2227, was conducted on 2001 April 29 for 124 ks. For each pointing, we removed events from the level 2 event list with a status not equal to zero and with grades one, five and seven. In addition, we used Alexei Vikhlinin’s software for removing background events in data observed with the very faint telemetry mode. We then cleaned bad offsets and examined the data on a chip by chip basis, removing times when the count rate exceeded three standard devations from the mean count rate per 3.3 second interval. For chip one, we specifically excluded the three brightest objects. One of these objects, identified with HD 237786, a G5V star, underwent a flare in the second pointing. For this problem, we excluded the peak time intervals in the flare by hand. We then cleaned each chip for flickering pixels, i.e. times where a pixel had events in two sequential 3.3 second intervals. We finally merged the event lists from the two pointings using the combine_obsid shell script provided for this purpose. The resulting effective exposure time for the summed data is 163 ks. The main reason for the relatively large amount of time lost from the total exposure is flaring from the bright star in the field.
3 Results
3.1 Optical and Near-IR
The presence of a group of very red galaxies at the position of RDCS J0910+5422 is obvious in Figure 1. The spatial distribution of the very red galaxies in Figure 1 is somewhat linear from the NE to the SW; we will return to this point when discussing the Chandra imaging. Figure 2 shows the and color-magnitude diagrams for all objects in a 200 arcsec area around RDCS J0910+5422. A red sequence characteristic of a galaxy cluster may be seen at in the lower panel of Figure 2. This sequence lies some 0.5 mag to the blue of the predicted no-evolution location for early-type galaxies at the cluster redshift. This prediction was made using photometry of Coma galaxies as detailed in SED98. This amount of bluing in the color is consistent with the color change due to passive evolution of a single age stellar population formed in a 0.1 Gyr burst at (using the GISSEL models of Bruzual & Charlot (2000)). There is an indication that the red sequence in RDCS J0910+5422 has a flatter slope relative to the Coma sequence, but this result is very uncertain. The slope difference is not likely to be due to differences in the photometry of the galaxies in Coma and RDCS J0910+5422—e.g., apertures of the same physical size were used on both clusters. A similarly flatter slope was tentatively found in RDCS J0848+4453 at (van Dokkum et al., 2001b). The observed scatter in the colors of the member galaxies is 0.09 mag and the measurement error is 0.08 mag, indicating a very small amount of intrinsic scatter, 0.04, in the rest frame colors.
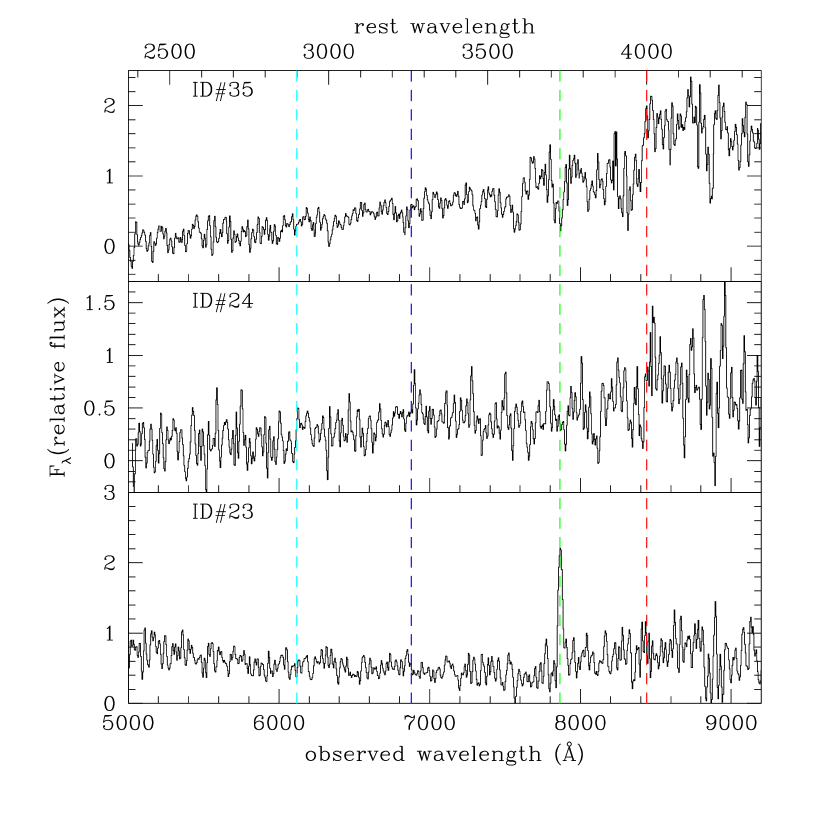
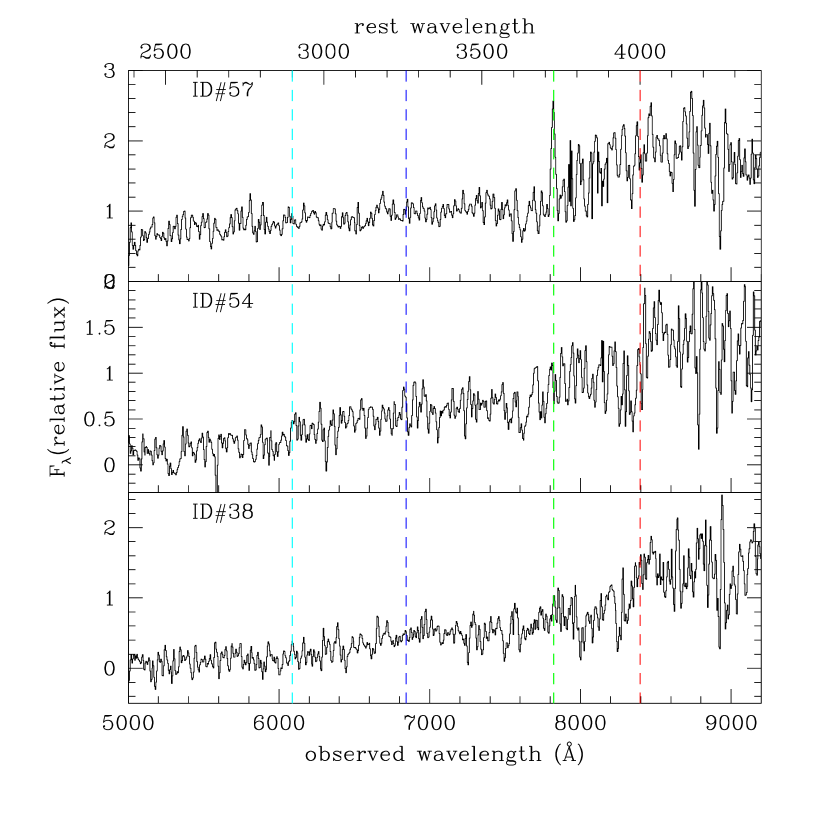
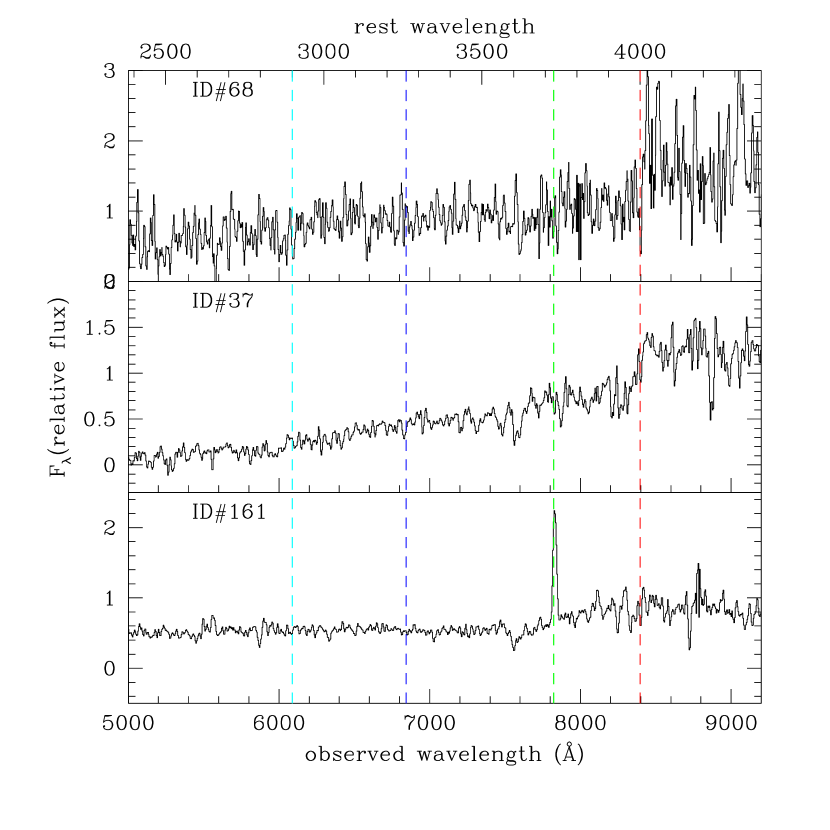
The optical spectra for the 9 member galaxies are presented in Figure 3. Redshifts were calculated both by visual identification of emission and absorption features and by cross-correlating the spectra with an E template from Kinney et al. (1996) using the IRAF Package RVSAO/XCSAO (Kurtz et al., 1991) and are listed in Table 1. The redshift measurements primarily are based on major features such as Ca II H+K and OII, and is also sensitive to spectral breaks such as D4000 and B2900. Spectra were obtained for a total of 15 color-selected targets; of these redshifts were determined for 13 and 8 are cluster members (one serendipitous spectrum is a member). The locations of the member galaxies are shown on the color composite image in Figure 1. ID #161, which lies outside our image, was discovered serendipitously in an LRIS mask to be at the cluster redshift and has relatively strong [OII]. Two objects (ID #23 and 57) show weak [OII] emission, while the remaining member galaxies have spectra typical of early-type galaxies in the present epoch, albeit with smaller D4000.
3.2 X-ray
To measure the X-ray flux in the ACIS-I image, we centered a circular aperture with a radius of 100″ at 09h10m449, +54d22m089 (J2000). The position was chosen by the flux weighted centroid of all events at 0.5–2.0 keV within 20″ of the visual center of the cluster. From this circular aperture, we excluded seven point sources. Each point source was identified from the smoothed contour map overlaid on the composite optical and near infrared image. We then fit an elliptical model and a constant background to the events within the 0.5–2.0 keV map. We used a map binned into 1″ pixels and fit the model using the CIAO package Sherpa (Freeman, Kashyap, & Siemiginowska, 2000) with the Cash statistic (Cash, 1979). We first explored the parameter space with 3000 Monte Carlo samples, and then refined the best fitting Monte Carlo result. Our best fitting model has a core radius of 194 0.6 and a . Our best-fitting model was mildy elliptical, with an ellipticity of . At the redshift of the cluster, the core radius would be 171.1 5.3 kpc. These values are typical of low redshift clusters.
For an estimate of the background spectrum, we chose three separate regions. Each background region was visually inspected which resulted in the removal of bright point sources. We fit all three regions jointly, using the program XSPEC (Arnaud, 1996), with a two component model (refered to as a background model in the program XSPEC) consisting of a powerlaw, not convolved with the telescope effective area, and a Gaussian for the 2.1 keV Au emission line. Each region had a seperate normalization for the two components. We used separate response matrices for each region, and we generated these using Alexei Vikhlinin’s calcarf/calcrmf tools.
We extracted a spectrum of the cluster using an elliptical aperture. The semi-major axis of the ellipse was twice the core-radius of the cluster. We fixed the background to the values from the best fitting model above, with the normalizations rescaled by the relative area in the aperture. Freezing the background and the absorption by galactic hydrogen at cm-2, obtained from the 100 µm maps of Schlegel et al. (1998), we fit a Raymond-Smith spectrum using the Cash statistic to the spectrum shown in Figure 7 in the source aperture. We found a best fitting temperature of kT keV. The best fitting flux in the ROSAT band of 0.5-2.0 keV was within the 388 aperture. The flux as measured in the RDCS in the same band from Rosat data was . Most of the difference between the Rosat and Chandra fluxes is due to the exclusion of the point sources detected in the ACIS image from the latter flux. The total bolometric luminosity of RDCS J0910+5422 is when integrated over the whole of the model. The errors on the temperature, flux, and luminosity were determined using 2000 iterations of the fakeit command in XSPEC. Unfortunately we are unable to determine the metallicity of the ICM to see if the canonical 1/3 seen in clusters up to (Donahue et al., 1999; Mushotzky & Loewenstein, 1997) continues beyond .
A total mass can be estimated from the , assuming an isothermal sphere and extrapolating the X-ray emission to Mpc using the best fit profile (Borgani et al., 1999; Horner et al., 1999). The total mass of RX J0910+5422 derived from the new X-ray data is within Mpc. Recent results obtained with Chandra and XMM on the ICM in lower-redshift clusters indicate that, apart from drops in the central regions due to cooling flows, the temperature profiles are fairly constant out to large radii, implying that mass estimates based on the assumption of isothermality are reasonable (Borgani, 2001b).
Several point sources were detected in the vicinity of the extended X-ray emission of the cluster, demonstrating the importance of high spatial resolution when attempting to accurately measure the properties of the ICM in high- clusters. One of the fainter point sources is associated with a cluster member, ID#23, which has weak emission lines and a relatively blue continuum. This object has in the [0.5–10] keV band. As seen in Figure 1 there is a close neighbor with which ID#23 could be interacting; higher resolution imaging will be useful to answer this question. ID#23 is probably a low luminosity AGN, though we did not find evidence of the NeV line at 3426 in our LRIS spectrum which is usually detected in such objects. A second much brighter X-ray point source () just to the northeast of cluster center is associated with the -band object ID#21 which has the colors ( and ) of a cluster galaxy but for which we have no spectrum. A third point source, ID#61, is also of interest because it is a hard X-ray source and a photometric member. Such galaxies are of particular value as they may represent a source of early heating during the formation of the ICM.
Though the X-ray morphology largely appears to be that of a relaxed system, there are indications that this cluster is still forming. Indeed given its high redshift and the expectations of cluster building which should occur at these redshifts according to CDM simulations, evidence of e.g. mergers are to be expected. As shown in Figure 8, there is some evidence in the ACIS data for temperature structure or merging in the ICM. The soft component dominates the central area of the X-ray emission, while to the south there is a harder component. Such a temperature distribution in the ICM could be due to an infalling group, or to mass streaming in along a filament. Indeed, the spatial distribution of the galaxies in the cluster gives the impression of filamentary structure, reminiscent of that seen in CDM simulations of cluster formation (Frenk et al., 1999).
4 Summary
4.1 The cluster galaxy population
The spectrophotometric properties of all the known members in RDCS J0910+5422 are summarized in Table 1. Two of the member galaxies show signs of current star formation, and one of these may be an AGN due to its X-ray emission. The spectra and colors of 6 of the spectroscopic members are broadly similar to those of a passively evolving elliptical galaxy formed at . But from these data alone, it is unclear if the luminous galaxies in the red sequence formed via hierarchical merging at or as a single object at . Age dating the spectra could provide additional information on the formation epoch of the galaxies; but such detailed modelling is burdened with its own uncertainities due to the age–metallicity degeneracy. Progress on the issue of the assembly of early-type galaxies in clusters is most likely to occur with determining the morphologies of the member galaxies using high resolution HST imaging on a large sample within RDCS J0910+5422, and in other similarly high- clusters.
4.2 ICM
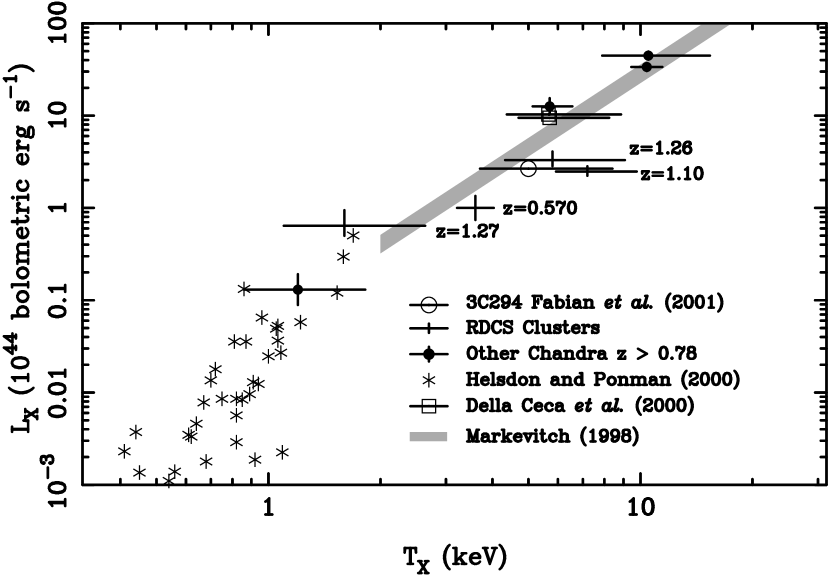
The Chandra data conclusively show the presence of hot gas trapped in the potential well of a massive cluster. This is the third instance in the RDCS of a cluster at with a well-defined ICM. The ACIS spectra yield a keV, and a total , both near the values for an cluster in the present epoch. Furthermore, the position of RDCS J0910+5422 in a plot of vs , shown in Figure 9, shows little if any evolution in the relation at , in keeping with the results of Borgani et al. (2001). Along with the well-defined red envelope, these properties indicate that RDCS J0910+5422 is another example of a massive cluster with an old galaxy population and a hot ICM already in place at .
References
- Aragon-Salamanca et al. (1993) Aragon-Salamanca, A., Ellis, R.S., Couch, W.J., & Carter, D. 1993, MNRAS, 262, 764
- Arnaud (1996) Arnaud, K.A. 1996, Astronomical Data Analysis Software and Systems V, eds. Jacoby G. and Barnes J., p17, ASP Conf. Series volume 101.
- Bahcall et al. (1997) Bahcall, N., Fan, X., & Cen, R. 1997, ApJ, 485, L53
- Bender et al. (1998) Bender, R., Saglia, R.P., Ziegler, B., Belloni, P., Greggio, L., Hopp, U., & Bruzual, G. 1998, ApJ, 493, 529
- Bertin & Arnouts (1996) Bertin, E. & Arnouts, S. 1996, A&AS, 117, 393
- Borgani et al. (1999) Borgani, S., Rosati, P., Tozzi, P., & Norman, C. 1999, ApJ, 517, 40
- Borgani et al. (2001a) Borgani, S., Rosati, P., Tozzi, P., Stanford, S.A., Eisenhardt, P.E., Lidman, C., Holden, B., Della Ceca, R., & Norman, C. 2001, ApJ, in press
- Borgani (2001b) Borgani, S. 2001 in “Clusters of Galaxies and the High Redshift Universe Observed in X-rays”, XXI Moriond Astrophysics Meeting, astro-ph/0106471
- Bruzual & Charlot (2000) Bruzual, G. & Charlot, S. 2000
- Cash (1979) Cash, W. 1979, ApJ, 228, 939
- Collins et al. (1997) Collins, C.A., Burke, D.J., Romer, A.K., Sharples, R.M., & Nichol, R.C. 1997, ApJ, 479, L11
- Couch et al. (1998) Couch, W., Barger, Amy J., Smail, Ian, Ellis, Richard S., & Sharples, Ray M. 1998, ApJ, 497, 188
- De Propris et al. (1999) De Propris, R., Stanford, S.A., Eisenhardt, P.R., Dickinson, M., & Elston, R. 1999, AJ, 118, 719
- Diaferio et al. (2001) Diaferio, A., Kauffmann, G., Balogh, M.L., White, S.D.M., Schade, D., & Ellingson, E. 2001, MNRAS, 323, 999
- Dickinson (1997) Dickinson, M. 1997, in “The Hubble Space Telescope and the high redshift universe”, eds. N.R. Tanvir, A. Aragón–Salamanca & J.V. Wall, (Singapore: World Scientific), p. 207
- Dressler et al. (1997) Dressler, A. et al. 1997, ApJ, 490, 577
- Donahue et al. (1999) Donahue, M., Voit, M., Scharf, Caleb A., Gioia, Isabella M., Mullis, Christopher R., Hughes, John P., & Stocke, John T. 1999, ApJ, 527, 525
- Ellis et al. (1997) Ellis, R.S., Smail, I., Dressler, A., Couch, W.J., Oemler, A., Butcher, H., & Sharples, R.M. 1997, ApJ, 483, 582
- Eke et al. (1996) Eke, V.R., Cole, S., & Frenk, C.S. 1996, MNRAS, 282, 263
- Evrard et al. (1996) Evrard, A., Metzler, C.A., & Navarro, J.F. 1996, ApJ, 469, 494
- Fabian et al. (2001) Fabian, A.C., Crawford, C.S., & Sanders, J.S. 2001, MNRAS, 322, L11
- Freeman, Kashyap, & Siemiginowska (2000) Freeman, P. E., Kashyap, V., & Siemiginowska, A. 2000, American Astronomical Society Meeting, 197, 2203
- Frenk et al. (1999) Frenk, C. et al. 1999, ApJ, 525, 554
- Horner et al. (1999) Horner, D.J., Mushotzky, R.F., & Scharf, C. 1999, ApJ, 520, 78
- Jarrett et al. (1994) Jarrett, T.H., Beichman, C.A., Van Buren, D., Gautier, N., Jorquera, C., & Bruce, C. 1994, ExA 3, 133
- Kauffmann & Charlot (1998) Kauffmann, G. & Charlot, S. 1998, MNRAS, 297, 23
- Kelson et al. (2000) Kelson, D.D., Illingworth, G.D., van Dokkum, P.G., & Franx, M. 2000, ApJ, 531, 137
- Kinney et al. (1996) Kinney, A., Calzetti, D., Bohlin, R.C., McQuade, K., Storchi-Bergmann, T., & Henrique, R. 1996, ApJ, 467, 38
- Kurtz et al. (1991) Kurtz, M.J. et al. 1991, in Astronomical Data Analysis Software and Systems I, ASP Conf.Ser., eds. D.M.Worrall, C.Biemesderfer, and J.Barnes, 25, 432
- Massey et al. (1988) Massey, P., Strobel, K., Barnes, J., & Anderson, E. 1988, ApJ, 328, 315
- Massey & Gronwall (1990) Massey, P. & Gronwall, C. 1990, ApJ, 358, 344
- Mushotzky & Loewenstein (1997) Mushotzky, R.F. & Loewenstein, M. 1997, ApJ, 481, L63
- Oke et al. (1995) Oke, J.B. et al. 1995, PASP, 107, 3750
- Pahre (1998) Pahre, M.A. 1998, Ph.D. thesis
- Rosati et al. (1995) Rosati, P., Della Ceca, R., Burg, R., Norman, C., & Giacconi, R. 1995, ApJ, 445, L11
- Rosati et al. (1998) Rosati P., Della Ceca R., Norman C., & Giacconi R. 1998, ApJ, 492, L21
- Rosati et al. (1999) Rosati, P., Stanford, S.A., Eisenhardt, P.R., Elston, R., Spinrad, H., Stern, D., & Dey, A. 1999, AJ, 118, 76
- Rosati (2000) Rosati P. 2000, in “Large Scale Structure in the Universe”, in press, (astro-ph/0001119)
- Scharf et al. (1997) Scharf, C.A., Jones, L.R., Ebeling H., Perlman, E., Malkan, M., & Wegner, G. 1997, ApJ, 477, 794
- Schlegel et al. (1998) Schlegel, D.J., Finkbeiner, D.P., & Davis, M. 1998, ApJ, 500, 525
- Stanford et al. (1998) Stanford, S.A., Eisenhardt, P.R., & Dickinson, M. 1998, ApJ, 492, 461
- Stanford et al. (1997) Stanford, S.A., Elston, R., Eisenhardt, P.R., Spinrad, H., Stern, D., & Dey, A. 1997, AJ, 114, 2232 (S97)
- Tyson et al. (1990) Tyson, J.A., Wenk, R.A., & Valdes, F. 1990, ApJ, 349, L1
- van Dokkum et al. (1998a) van Dokkum, P.G., Franx, M., Kelson, D.D., Illingworth, G.D., Fisher, D., & Fabricant, D. 1998, ApJ, 500, 714
- van Dokkum et al. (1998b) van Dokkum, P.G., Franx, M., Kelson, D.D., Illingworth, G.D. 1998, ApJ, 504, L17
- van Dokkum et al. (1999) van Dokkum, P.G., Franx, M., Fabricant, D., Kelson, D.D., & Illingworth, G.D. 1999, ApJ, 520, L95
- van Dokkum et al. (2000) van Dokkum, P.G., Franx, M., Fabricant, D., Illingworth, G.D., & Kelson, D.D. 2000, ApJ, 541, 95
- van Dokkum & Franx (2001a) van Dokkum, P.G. & Franx, M. 2001, ApJ, 553, 90
- van Dokkum et al. (2001b) van Dokkum, P.G., Stanford, S.A., Holden, B., Eisenhardt, P.R., Dickinson, M., & Elston, R. 2001, ApJ, 552, L101
- Vihklinin et al. (1998) Vikhlinin et al. 1998, ApJ, 498, L21


| ID | R.A. | Dec. | ||||
|---|---|---|---|---|---|---|
| 23 | 9:10:48.34 | 54:22:29 | 17.86 | 2.15 | 4.02 | 1.1108 |
| 24 | 9:10:44.99 | 54:22:02 | 17.89 | 1.82 | 3.96 | 1.1075 |
| 35 | 9:10:44.88 | 54:21:59 | 18.39 | 1.75 | 3.84 | 1.1196 |
| 37 | 9:10:46.27 | 54:22:11 | 18.43 | 2.14 | 4.07 | 1.105 |
| 38 | 9:10:42.85 | 54:21:43 | 18.50 | 1.95 | 3.87 | 1.0951 |
| 54 | 9:10:45.34 | 54:22:04 | 18.83 | 1.67 | 3.86 | 1.0997 |
| 57 | 9:10:48.30 | 54:22:24 | 18.96 | 1.92 | 3.46 | 1.0989 |
| 68 | 9:10:50.15 | 54:21:03 | 19.22 | 2.21 | 3.94 | 1.107 |
| 161aaObject outside area covered by our band image. | 9:10:30.08 | 54:18:45 | 1.1136 |