X-ray and UV Variability in the Core of M15: the nature of X2127+119/AC211
Abstract
The prototypical post-core-collapse globular cluster M15 provides an ideal environment for the formation of exotic binaries, it being already known to contain a luminous LMXB (X2127+119, optically identified with the 17.1 hour eclipsing binary AC211) and six millisecond pulsars in the core. However, the X-ray properties of X2127+119 are strange in that it appears to be a high inclination accretion disc corona source (ADC) from which we only see scattered X-radiation, and yet it has produced extremely luminous type I X-ray bursts, which may or may not have come from AC211. We have therefore examined the 5-year RXTE/ASM light curve of this object in order to search for long-term modulations which might shed light on this unusual behaviour, and which led to our discovery of further X-ray bursts. Furthermore we have used archival HST UV images of the M15 core to search for other variable objects which might indicate the presence of a second LMXB. From these we have found one highly variable () object which we interpret as a dwarf nova.
keywords:
Accretion, accretion disks , Binaries: close , Stars: individual: X2127+119/AC211 , X-rays: stars1 Introduction
The dense cores of globular clusters are now well established as breeding grounds for the creation of exotic interacting binaries (e.g. Verbunt & van den Heuvel 1995). In particular, it has been noted for almost 20 years that luminous low-mass X-ray binaries (LMXBs) are found in 12 globular clusters, an overdensity relative to the field of a factor 100, indicating a greatly enhanced formation mechanism in the dense cluster environment (both 2-body (tidal) and 3-body (exchange) mechanisms are still actively considered, see e.g. Elson, Hut & Inagaki 1987 and references therein). And the descendants of LMXBs, the millisecond radio pulsars (MSPs), are also found in substantial numbers in clusters, with 8 of them in M15 alone (of which 6 are within 8 arcsecs of the core; see e.g. Lyne 1996). Furthermore these LMXBs have a range of properties more extreme than those in the field. All except one have produced type I X-ray bursts (e.g. Charles 1989 and references therein), and hence are accreting neutron stars, but their period distribution is skewed to include at least two extremely short period binaries (including the shortest orbital period currently known, X1820-30 in N6624) which require both members of the binary to be degenerate (Rappaport et al 1987). Recent UV surveys with HST (de Marchi & Paresce 1994, 1995, 1996) have revealed a population of very blue stars (VBS) in M15, the nature of which is as yet undetermined, but their very high density in the core indicates a population segregation that must be related to other properties of the cluster.
Against this background, M15 houses one of the more enigmatic of these high luminosity LMXBs, X2127+119 in that it was identified 15 years ago (Aurière et al 1984; Charles et al 1986) with by far the most luminous optical counterpart (AC211) of any galactic LMXB. This 15th magnitude extremely blue, highly variable (1 mag in U) object was photometrically monitored by Ilovaisky et al (1993) who showed that it was eclipsing with a 17.11 hour period. The broad eclipse feature (seen in both optical and X-rays) suggested that X2127+119/AC211 belonged to the accretion disc corona (ADC) class, in which the high inclination means that the compact object is obscured by the disc rim and hence not directly visible. This accounts for the high optical luminosity associated with a relatively faint X-ray source.
However, this model suffered a severe blow when Dotani et al (1990) and van Paradijs et al (1990) observed M15 with Ginga and discovered an extremely luminous type I X-ray burst, thereby inferring that the X-ray source must be directly visible (at least for part of the time). In which case the persistent, low apparent X-ray luminosity ( erg s-1 for an assumed distance of 10.5kpc; Djorgovski 1993) was then attributed to a genuinely low accretion rate (0.01LEdd), rather than being the result of obscuration in an ADC, and indeed there are other comparable luminosity directly-viewed LMXBs in globular clusters (see e.g. Sidoli et al 2001). However, these are all optically much fainter and hence the remarkable optical brightness of AC211 remains unexplained.
We therefore decided to use archival X-ray and UV data on M15 in order to investigate the strange properties of X2127+11/AC211 in more detail. The on-line database of the RXTE ASM provides a unique, long-term (5 yrs), continuous X-ray light curve which we could examine for behaviour that might be related to the occurrence of the bursting events (it already having been suggested by Corbet et al 1997 that there might be a 37 day modulation in earlier samples of the ASM data). Furthermore it was not clear to us that the very compact core of M15 was restricted to containing only one luminous LMXB, and so we extracted the HST archival images of the core region in order to search for variable UV sources, a study that might also shed light on the nature of the VBS.
2 RXTE/ASM Light Curve
Launched in 1996, the Rossi X-Ray Timing Explorer (RXTE) carries an All Sky Monitor (ASM), which gives continuous coverage of the entire sky. Roughly six readings - called “dwells” - are taken of each of a list of sources per day, lasting about 90 seconds per dwell. Timing information is obtained to within a thousandth of a day, as well as crude spectral information. The ASM is sensitive to photon energies between 1.3 and 12.1 keV, broken into three energy channels (1.3-3.0 keV, 3.0-5.0 keV and 5.0-12.1 keV).
For weak sources such as X2127+119, which averages only 1, particular attention must be paid to problems with the RXTE environmental background (see figure 1). To that end we utilised the software provided by MIT (Levine et al 2000) which sets levels of background activity for rejection of data which are significantly better at removing contaminated data than the standard data product provided on-line. Data was kept only if the fit had a value between 0.05 and 1.5, and the background at the time of the dwell was less than 10 . This produces a substantial improvement in the data quality.
To identify longterm trends in the ASM lightcurve of a weak source such as X2127+119, it is instructive to bin the data, and we chose a binning of five days per bin and required a minimum of five datapoints ber bin. The resulting lightcurve and rms error are shown in figure 2. We see regions of extended activity at about day number 160 and 460, lasting 50d in each case.


2.1 Period Search
Because the ASM data is unevenly sampled, it was necessary to replace the Fourier Transform with the Lomb-Scargle periodogram (LS) when searching for periodicities (Scargle, 1982). The LS periodogram is a Discrete Fourier Transform modified to take account of unevenly sampled data. Phase Dispersion Minimisation (PDM) detects periodicities by folding the data on trial periods, producing a measure of the scatter in the resulting fold. Because any periods found by this method do not depend on the form of the underlying modulation, PDM is a useful check on any periodicities found with LS techniques and is used here to provide an independent measure of the period. The resulting periodograms are shown in Figures 3 and 4.
With a source as weak as X2127+119 it is necessary to determine the significance of detected periods. This is accomplished by performing the period analysis on a large number of simulated datasets, where the simulations are composed of Gaussian noise on the sampling of the ASM data. The Lomb-Scargle power in the resulting power spectrum of each dataset is calculated, allowing us to measure the correspondence between the power of an LS peak and the probability that the peak arose from a genuinely periodic signal, and was not due to noise. From our simulations, we find that an LS power of 12 corresponds to 99 percent confidence that the power is due to a real signal, assuming white noise (for full details see Homer et al, 1996).
Figure 3 shows the period analysis performed over long periods, from 2 to 1000 days. For the purposes of period detection, the data was binned up to one day averages. There is no sign from this analysis of the 37d period reported by Corbet et al 1997. By adding sinusoidal signals to our simulated light curves, a rough upper limit was set for the amplitude of a 37d periodic signal that might go undetected with the time sampling of the ASM dataset. This upper limit occurs at about 0.08 , or roughly 8 percent of the average quiescent level.
It must be borne in mind that this analysis was carried out for the full energy range of the ASM; whereas Corbet et al point out that this modulation is only prominent in ASM Channel 1. Therefore power spectra were computed for the individual channels (figure 4), and these also showed no significant periodicities. A plot of the log-log binned power spectrum shows that white noise is a good model for individual channel data. The 37d period can therefore be safely dismissed as an artefact.
Recent analysis of ASM data for the dipper X1916-053 (Homer et al., 2001), however, shows that significance levels based on a white noise model may not be valid for the total ASM count rate, and the noise can be frequency dependent. Plotting the binned power spectrum on a log-log scale shows that the noise is better described by the sum of a power law “red noise” component and a white noise component, with a break at frequencies 0.02 cycles per day. The result is that the LS power corresponding to a 99 significant periodicity detection varies with frequency. With this in mind, model spectra were computed using the best-fit red-noise model for X2127+119, following the method of Uttley et al (2001). The structure in the power spectrum was found to be entirely consistent with this noise model. Consequently, we find no candidate periodicities distinguishable from noise.


Finally, a similar period analysis performed over a range of slightly shorter periods confirms that the 17.1 hour orbital period of AC211 continues to appear in the ASM dataset. This has been analysed in more detail elsewhere; Homer & Charles 1998 examined the first 2 years of ASM data in search of a period derivative, and more recently Ioannou et al. (2001) performed a similar search on the full five year dataset.
2.2 X-ray burst candidates
The coverage of the ASM is such that a few individual dwells (of 90s each) are obtained each day, at an average rate of about one every few hours. This sampling rate is an order of magnitude longer than typical type I X-ray burst durations - the October 1988 burst, for example, lasted less than 200s. However, given the extent of the ASM database, we might still expect to see a burst event in the ASM lightcurve, as a single, high datapoint. With this in mind, a search was undertaken for similar X-ray bursts to the October 1988 event.
While selecting for background, the cleaning procedures detailed in the previous section also select the data based on minimising a least squares fit. While appropriate for most analyses of RXTE data, this tends to reject single high points - the target of this search for bursts! We therefore decided to refilter the raw data based on behaviour of the background levels; all points with a background level greater than 20 counts per second were rejected. A burst is then recognised if the burst profile differs from the background profile, whatever the absolute value of the background. All points with no background information were rejected.
At , the quiescent output of X2127+119 is so low that with the exception of burst candidates, which have 5 times the signal-to-noise ratio, variations in the shape of the lightcurve are indistinguishable from noise. This is especially true of data for the individual channels, with values typically 1/3 . For this reason, the shape of the lightcurve either side of a burst candidate is useless when attempting to discern bursts; another measure must be found that uses only the burst candidate events themselves. The method chosen to examine candidates was to compare their approximate peak photon energies.
The classical type I X-ray burst profile consists of a fast rise to peak luminostity, (rise time typically 1 - 10s), followed by a more gradual decay to quiescence (decay time typically from 10s to 1 minute). Decay times are generally much shorter at higher photon energies, producing a softening of the burst profile during decay that is ascribed to the cooling of the neutron star photosphere after the initial detonation (Lewin et al, 1995).
The implication for any burst search is that we should expect to see a contribution to the burst from all three ASM channels. This allows us to reject burst candidates with activity in one channel only. A further implication is that we should see a rough anticorrelation between total luminosity and hardness ratio as defined in this paper (section 2.5), as the more luminous points would arise from earlier points in the profile with higher photon energies.
2.3 The clockwork burster X1826-238: a comparison source
To demonstrate the validity of our search strategy, the X-ray burster X1826-238 was examined with the ASM. X1826-238 displays a remarkable near-periodicity in its burst behaviour, with seventy bursts observed by the BeppoSAX Wide Field Camera over 2.5 years. Analysis by Ubertini et al (1999) revealed a significant quasi-periodicity in the bursts of 5.76hr (with a FWHM to the distribution of only 0.617hr).
The periodicity of this source allows us to predict possible windows in which we might expect to see a burst, given the precise timing and periodicity from Ubertini et al. A burst candidate for X1826-238 is plotted from the ASM lightcurve in Figure 5: as can be seen, it fits within the expected window very well. The energy distribution is weighted towards the higher energies, which supports the standard model for type I bursts given that the candidate occurs early in the predicted burst window.
If the method of searching for a rough luminosity-hardness ratio anticorrelation is valid, then X1826-238, with its dependable burst activity, should be the ideal calibration source. Plotting the ASM count rate against hardness ratio for this source does indeed show such a relation; the points with the highest count rate correspond to those with the hardest photon energies.
At 2 ASM , the quiescent level of X1826-238 is similar to X2127+119, making it a good comparison source. Figure 6 shows the count rate - hardness ratio plot for both X1826-238 and our X2127+119 burst candidates.
2.4 Previous bursts and their implications for the ASM search
We must also consider profiles that are a little more varied than the classical type I profiles exhibited by X1826-238, as the October 1988 burst (and the recent event reported by Smale 2001) was by no means a typical type I burst. To begin with, after ten years, this burst is still one of the most luminous X-ray bursts seen, which at 4.51038 erg s-1 is near-Eddington for this system. (By considering gravitational redshifting at the neutron star surface, van Paradijs et al (1990) obtain a figure of 51038 erg s-1 for the Eddington limit of this system). At 150s, the burst was unusually long for a classical type I burst, and there was also a precursor burst 6s before the main burst. Finally, the profile was unusual for a type I burst, with the peak occurring later, at successively higher energies, causing a hardening of the spectrum. These properties are thought to be hallmarks of photospheric radius expansion on the neutron star as a result of the burst (Lewin et al., 1995)
A second burst was detected with the PCA in September 2000 (Smale, 2001), that shares many characteristics with the October 1988 event. Like the 1988 burst, the profile is double-peaked, indicating photospheric expansion. Though the overall timescale for both bursts is similar, the 2000 burst displays shorter timescales for the photospheric expansion events, suggesting a smaller photospheric radius at maximum expansion. Unfortunately, due to ASM sampling (see Section 2.6), this burst was not observed by the ASM.
2.5 The X2127+119 burst candidates
Table 1 lists the candidate bursts that satisfy our search criteria. An event was selected as a burst if its ASM count rate was above 10 and the hardness ratio between 0.5 and 5. In each case the bursts take place in the absence of any significant background events, and are detected in each energy channel.
To compare candidate burst fluxes with previous bursts, it is necessary to relate PCA count rates to ASM count rates. This was accomplished through examination of publicly available ASM data and archival PCA observations of the steady output of the known burster X1735-44. The steady output was chosen rather than its bursts for the reason that no bursts were found in any of fourteen known bursters for which the same burst is detected in both the PCA and the ASM, whereas one can be confident that the steady output measured by the PCA is due to the same source behaviour as the steady output recorded by the ASM at a different point on the same day. Furthermore, the spectral properties of these sources are similar. Based on the steady output from X1735-44, an ASM count rate of 1 was found to correspond to an average PCA count rate over 90s of 50.5 2.9 . We estimate the total PCA counts recorded during the September 2000 burst at 370000 , which would then correspond to an ASM count rate of 81 6.2 . This does assume that the 90s dwell overlaps perfectly the 80s burst profile (which as we shall see in Section 2.6, is a large assumption).
The flux values given in the table are fractions of the peak flux of the September 2000 burst (6.51038 erg s-1). These values depend on both the source behaviour and the amount of overlap between dwell and burst, so cannot be taken as indicators of either quantity on its own. The hardness ratio used here is defined as the ratio of the count rate in channels 1 and 2 to that in channel 3 (strictly speaking, a “softness ratio”). The maximum duration of the burst was estimated from the data sampling each side of the event.
Galactic bulge sources have been discovered recently to exhibit extended X-ray bursts lasting several hours (e.g. Cornelisse et al 2000). The fact that we can only set rough limits on our burst candidate durations allows the possibility that an event may last longer than the few minutes of the October 1988 burst; if neutron star photospheric radius expansion is a recurrent phenomenon this might be expected. With the time resolution afforded us by the RXTE ASM, we can do little more than admit the possibility that some of our candidates may be consistent with long bursts.
The fluxes hover around 10 to 20% of the October 1988 burst, and there is quite a wide range of hardness ratios and durations for the candidates. The coverage of candidate event 11 is such that there are actually three points recorded that may be part of the same profile; this candidate is plotted alongside a probable burst from X1826-238 in figure 5.
Figure 6 shows the count rate versus hardness ratio plots for both sources. The qualitative similarity gives us some confidence that we are indeed seeing burst profiles sampled at random points from X2127+119; all points for which the low energy channels dominate also show low count rates. This is further strengthened by the behaviour in figure 6 of the variations in the known non-burster X1700-37, which show very little spectral changes.
2.6 ASM sampling and the true burst rate
Each dwell measurement lasts 90s, and there are of order 10 dwells per day. To be detected, a significant fraction of the 80s burst profile must overlap with a 90s dwell, so that the average count rate of the 90s dwell is high enough to stand out from noise. Making the assumption that the burst profile of September 2000 (Smale, 2001) is typical, the probability of burst detection can be calculated and related back to the number of bursts measured, so as to make an estimate of the true burst recurrence time.
Setting the lower limit for a burst to stand out from noise at 10 , we find that the average count rate over a 90s dwell must be at least 12 of the peak count rate if detection is to occur. This count rate is reached if either (i) the end of the dwell period occurs 4s or more into the burst profile, or (ii) the beginning of the dwell occurs 49s or more before the end of the burst profile.
Using the known average interval between dwell measurements and treating the start and end times of burst and dwell as random variables, we find that the probability of detection is 0.0234 divided by the length of time between bursts. Given that 14 burst candidates were detected in the 5 year dataset, this places a lower limit on the burst recurrence time of 1.9 days.
| Event | Day 1 | Flux2 | hardness ratio 3 | Max. burst duration (mins) |
|---|---|---|---|---|
| 1 | 587.946632 | 0.14 | 0.5 | 749.6 |
| 2 | 647.897373 | 0.14 | 1.4 | 96.5 |
| 3 | 652.492373 | 0.20 | 0.85 | 562.9 |
| 4 | 1240.353114 | 0.16 | 1.7 | 96.0 |
| 5 | 1338.510521 | 0.14 | 1.0 | 430.0 |
| 6 | 1367.671632 | 0.16 | 1.9 | 92.3 |
| 7 | 1373.595335 | 0.31 | 0.6 | 93.9 |
| 8 | 1374.19441 | 0.22 | 0.6 | 89.6 |
| 9 | 1375.124595 | 0.17 | 4.2 | 95.7 |
| 10 | 1375.255521 | 0.12 | 2.3 | 4.8 |
| 11 | 1715.607188 | 0.30 | 1.1 | 34.9 |
| 12 | 1726.483298 | 0.14 | 2.1 | 93.6 |
| 13 | 1857.959595 | 0.15 | 3.2 | 860.0 |
| 14 | 1945.611071 | 0.17 | 1.3 | 95.7 |
| 15 | 1984.320503 | 0.16 | 1.3 | 96.3 |
1 Days after January 6th, 1996
2 In units of the peak flux of the September 2000 burst
3 Defined as (1.3-5 keV/5-12.1 keV)


3 HST UV Imaging: a variability study
With its extremely bright and crowded central regions, only the brightest members of the core of M15 have been studied with ground-based telescopes (even then requiring the best natural seeing conditions e.g. Aurière & Cordoni 1981). Consequently M15 has been a regular target for the pre- and post-COSTAR corrected HST.
The most detailed optical/UV HST studies of the central stellar populations of M15 are presented by De Marchi & Paresce (1994; 1996) and Guhathakurta et al (1996) (hereafter DMP94, DMP96 and G96 respectively). DMP94 used far-UV and U band FOC images to derive colour-magnitude diagrams (CMDs) and demonstrate that there are a significant number (15) of very blue stars (hereafter VBS) in the M15 core. DMP96 show that these are located beyond the blue-straggler section of the CMD, and have properties similar to sdB or extreme horizontal branch stars (based mainly on colour and luminosity), but note that detailed spectroscopic study is necessary in order to elucidate their true nature.
However, the VBS have properties similar to active LMXBs (indeed one of them is actually AC211 itself), and the fainter ones could be accreting white dwarf binaries (i.e. CVs). Since these interacting binaries are known to be highly variable, we decided to de-archive these images and select for further study those obtained of the same regions with the same instrumental configurations, but separated in time by long intervals. In order to find blue variables in the core of M15, we analysed two sets of HST WFPC2 narrow-U archival images. The two sets of observations were made in April 1994 (UBVRI observations) and in October 1994 (U-band only).
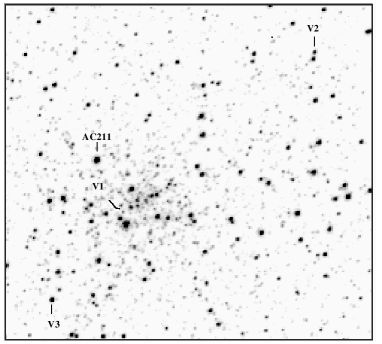
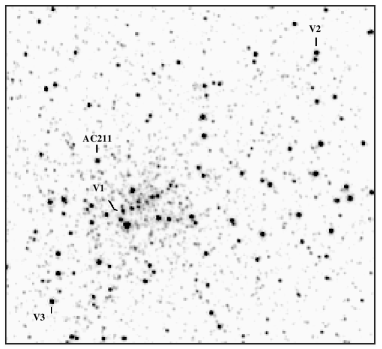
After careful alignment of the images we used iraf to form difference images in order to highlight any variable objects. We detected four blue variables in an 8-arcsec radius from the central cusp (see Table 1). One is the known LMXB AC211, but none of the other three (which we have called V1 - V3) is a previously noted VBS (which can be most clearly seen in the G96 composite colour image). We used the Vegamag photometric zeropoints for the WFPC2 to determine the magnitudes listed below. The limiting U-magnitude in these exposures (400 s in the F336W filter) is about 22.5. The variables appeared in each of the 8 U-band exposures taken in October 1994 and are therefore not cosmic rays or chip blemishes. These 3 sources (which varied by 0.8 mag between the observation epochs), are marked in Figure 7. We have not corrected for interstellar reddening, which in the direction of M15 is a very small effect; E(B-V) for M15 is 0.09 (Rosenberg et al. 2000).
| Apr 1994 | Oct 1994 | ||||
|---|---|---|---|---|---|
| Star | U | B | V | U | Location∗ |
| V1 | 22.5 | - | - | 17.60 .03 | 0.3” NE |
| V2 | 16.49 .01 | 16.20 .01 | 15.86 .02 | 15.70 .01 | 3.5” due E |
| V3 | 17.20 .02 | 16.97 .02 | 16.56 .04 | 16.07 .02 | 7.5” due W |
∗ with respect to cluster centre
On careful examination, it became clear that the variability of one of these sources (V1 in Figure 7) was due to the appearance of a transient event in the U-band images taken in October 1994. There is no trace of it in the April 1994 images and so the variability range is actually 5 mags. There is also no sign of it in any other HST images of M15 (August 1994, December 1998 or August 1999). V2 and V3 on the other hand, are likely to be RR Lyr variables given their variability range, colours and absolute magnitudes (Allen 1973).
3.1 The nature of the transient V1
Although we have no colour information about V1, we expect it to be a UV-bright object: red variables are likely to be evolved stars and much brighter than V1 in quiescence. Also, faint stars that exhibit 5-magnitude outbursts are likely to be blue objects. UV-bright transients in the cores of globular clusters have a strong possibility of being interacting binary systems containing compact objects, i.e. cataclysmic variable stars (in which the accreting object is a white dwarf) or X-ray binaries (neutron-star systems). Both these classes of variable stars have subclasses which exhibit transient behaviour. Dwarf Novae (DNe) are faint CVs (MV typically 6 to 8 in quiescence, with a large scatter; see Warner 1995) which undergo periodic outbursts of 3 to 8 magnitudes. X-ray transients are X-ray binaries which have similar quiescent absolute magnitudes to DNe, and which undergo infrequent outbursts of 6 to 9 magnitudes (see e.g. Charles 2001 and references therein).
DNe and X-ray transients in M15 (distance 10.2 kpc, distance modulus 15.31; Rosenberg et al. 2000) would be expected to have quiescent magnitudes of 21 to 24, with outburst magnitudes ranging from 14 to 21 for DNe, and from 13 to 18 for X-ray transients. At 17.6 mag, the transient V1 is well within the expected range of peak magnitudes for both DNe and X-ray transients, which makes it an event long sought after but rarely seen in the high density environments of globular cluster cores. However, we have no idea of knowing whether we have observed V1 at its peak magnitude, nor was any X-ray ASM operating at this time (RXTE was launched in Dec 1995) to give us any X-ray coverage.
If V1 is indeed a DN or an X-ray transient, it is statistically much more likely to be the former than the latter. DNe outburst recurrence times are weeks to months, while X-ray transients recur on much longer timescales, typically tens of years. The chances of catching an X-ray transient in outburst on the few occasions on which the HST has observed M15 over the last decade are extremely small.
The probability that V1 is a DN rather than an X-ray transient depends also on the relative numbers of these two kinds of object in the core of M15. While X-ray binaries are overabundant by a factor of 100 in globular clusters compared to the galactic plane, CVs appear to be underabundant by a factor of 1000. Whether this underabundance indicates that globular clusters are unfavourable environments for the formation and/or continued existence of CVs, or whether we simply have not been able to find them in the extremely challenging observing conditions of globular cluster cores, is a subject of intense debate (Livio 1996).
There is already an X-ray binary in the core of M15 (AC211) and while these objects are rare there is no reason for there not to be more than one in M15. The core of M15 contains several millisecond pulsars (Phinney 1996), end-products of LMXB evolution, and so we cannot rule out that V1 is an X-ray binary, even though the chances of catching a transient in outburst in a single HST visit are extremely small. What are the chances of detecting a DN in outburst in M15 during a single HST visit? Di Stefano & Rappaport (1994) predict a population of 200 CVs in 47 Tuc, of which 50 might be DNe. We would expect M15 to have a higher population of CVs than 47 Tuc because of its greater core mass and central density, which would lead to a higher formation rate of close binaries through tidal capture and three-body interactions. If we apply Di Stefano & Rappaport’s predictions to M15, we can assume that it has a population 50 DN. If these DN have a typical mean outburst recurrence time of 50 days and outburst length of 10 days, then in any given HST visit, one would expect to see 10 DNe in outburst. Di Stefano & Rappaport’s predictions may be over-optimistic, but they do indicate that the chances of finding a DN in outburst should be very good, and we conclude, therefore, that V1 is most likely to be a DN.
4 Discussion
The optical and X-ray light curves of X2127+119/AC211 (Homer & Charles 1998; Ioannou et al 2001) contain the very stable (and extended) eclipse feature which requires a high inclination (70∘) for this binary system. With its very low LX/Lopt ratio (20) this has provided very strong support for the ADC interpretation. But the van Paradijs et al (1990) X-ray burst from M15 is the major key factor that does not fit into the ADC model and overall scenario. Note also that the distance to M15 is well constrained at 10.5 kpc, thereby providing accurate luminosities for both the quiescent and burst X-ray emission. We consider then that there are only 3 possible explanations available to resolve this situation:
(a) the X-ray burst is actually scattered in the ADC but remains detectable as a coherent event. We believe that this is unlikely because the time profile is typical for a type I X-ray burst, and the peak luminosity is extremely high (at L4.51038 erg s-1 assuming isotropic emission; van Paradijs et al 1990) in spite of the considerable X-ray scattering and reprocessing that would otherwise be occurring (and restricts ADC sources to only a few percent of their intrinsic luminosities);
(b) there exists a long-term modulation in the X-ray light curve that could arise from a warped accretion disc (as a result of an instability to X-ray irradiation; see Wijers & Pringle 1999 and Ogilvie & Dubus 2001), allowing an occasional direct view of the inner disc/compact object. We believe that this is also unlikely for several reasons. If the X-ray source were to become directly visible at certain times, then, assuming an average LX/Lopt ratio for LMXBs (van Paradijs & McClintock 1995), the increase in X-ray brightness would be much more than the factor 2 or 3 visible in the ASM lightcurves (figure 1). Furthermore, the source would need to be bursting very frequently in order for an event to occur during a (rare) period of direct viewing. And there is simply no evidence for such frequent bursting in the extensive ASCA and RXTE monitoring campaigns (Ioannou et al 2001), which are consistent with our burst frequency limit calculated in section 2.6;
(c) there exists another LMXB (the burster) within the core region of M15 and also very close to AC211 (within 5 arcsecs). This is both expected (on the basis of the compact, high density nature of the core combined with the effects of mass segregation) and required (in order for the source not to have been resolved by previous imaging X-ray missions, particularly ROSAT). Of course, the X-ray burster could also be a chance alignment with the direction of M15, but this is extremely unlikely because of the high galactic latitude of M15 (-27∘) and the necessarily very precise alignment required (arcseconds) with the core of M15. See also the similar suggestions made by Grindlay (1992, 1993).
We consider therefore that a second active LMXB in M15 is the most likely explanation and also suggest that such a source might be associated with one of the UV variable stars we have found in the archival HST images. For the observed X-ray flux levels (now indicative of the intrinsic luminosity of the source) we may scale with respect to similar LMXB bursters in the plane (e.g. X1735-444, which has MV of 2.2, but is ten times more luminous in X-rays; see van Paradijs & McClintock 1995) to infer V19. This additional source could then be responsible for the variations present in the ASM light curve (figure 1), and hence is likely to be comparable to the currently observed flux from X2127+119, but of course must be much fainter than the intrinsic luminosity of the ADC source AC211.
Note that the observed X-ray, optical and UV 17.1hr modulation of X2127+119/AC211 demonstrates that a significant fraction of the total M15 X-ray flux must originate from this system, but if it is contaminated by another source then this implies that the X2127+119 eclipse must be deeper. There would also be implications for the spectral properties of the source (Ioannou et al 2001). To test this interpretation will require much higher spatial resolution X-ray imaging of the core of M15. Such imaging has been approved to be undertaken later this year with the Chandra HRC (which has a spatial resolution of 0.5 arcsecs), the results from which will be the subject of a future paper.∗
Acknowledgements
PAC would like to thank Marty Weisskopf for stimulating discussions about the nature of AC211 which led directly to some of the work reported in this paper, Lee Homer for comments and the use of his ASM analysis software for the period search, and Nick White for informing us of his Chandra results in advance of publication. We also thank Phil Uttley for assistance with the rednoise modelling. LvZ acknowledges the support of scholarships from the Vatican Observatory, the National Research Foundation (South Africa), and the Overseas Research Studentship Scheme (UK). This research has made use of data obtained through the HEASARC online service, provided by the NASA/Goddard Space Flight Center. In particular, we thank the ASM/RXTE teams at MIT and at the RXTE SOF and GOF at NASA’s GSFC for provision of the ASM data. WIC acknowledges the support of a PPARC Research Studentship. Based on observations made with the NASA/ESA Hubble Space Telescope, obtained from the data archive at the Space Telescope Science Institute. STScI is operated by the Association of Universities for Research in Astronomy, Inc. under NASA contract NAS 5-26555.
∗ In completing this paper we became aware of a Chandra observation by White & Angelini (2001) that had serendipitously resolved X2127+119 into 2 separate sources, confirming the suggestion made here. We note, though, that the second source is not V1, strengthening our interpretation of V1 as a dwarf nova.
References
- (1) Aurière, M., Le Fevre, O. & Terzan, A. 1984, A&A, 138, 415
- (2) Aurière, M. & Cordoni, J.-P. 1981, A&AS, 46, 347
- (3) Charles, P. A., Jones, D. C. & Naylor, T. 1986, Nature, 323, 417
- (4) Charles, P.A. 1989, The 23rd ESLAB Symposium on Two Topics in X Ray Astronomy. Volume 1: X Ray Binaries p129-137
- (5) Charles, P.A. 2001, Black Holes in Binaries and Galactic Nuclei. Proceedings of the ESO Workshop held at Garching, Germany, 6-8 September 1999. Lex Kaper, Edward P. J. van den Heuvel, Patrick A. Woudt (eds.), Springer, p. 27
- (6) Corbet, R., Peele, A. & Smith, D. A. 1997, IAUC 6632
- (7) Cornelisse, R., Heise, J., Kuulkers, E., Verbunt, F. & in’t Zand, J.J.M. 2000 A&A 357, L21
- (8) De Marchi, G. & Paresce, F. 1994, ApJ, 422, 597
- (9) De Marchi, G. & Paresce, F. 1995, A&A, 304, 202
- (10) De Marchi, G. & Paresce, F. 1996, ApJ, 467, 658
- (11) Di Stefano, R. & Rappaport, S. 1994, ApJ, 423, 274.
- (12) Djorgovski, S. & Meylan, G. 1993, AAS, 182.5015
- (13) Dotani, T., Mitsuda, K., Inoue, H., Tanaka, Y., Kawai, N., Tawara, Y., Makishima, K., van Paradijs, J., Penninx, W., van der Klis, M., Tan, J. & Lewin, W. H. G. 1990, ApJ, 350, 395
- (14) Elson, R., Hut, P. & Inagaki, S. 1987, ARAA, 25, 565
- (15) Grindlay, J.E. 1992, in “X-ray Binaries and Recycled Pulsars” (eds E. van den Heuvel & S. Rappaport), Kluwer, NATO ASI Series, 377, 365
- (16) Grindlay, J.E. 1993, ASP Conf.Ser. 48
- (17) Guhathakurta, P., Yanny, B., Schneider, D. P. & Bahcall, J. N. 1996, AJ, 111, 267
- (18) Homer, L., Charles, P. A., Naylor, T., van Paradijs, J., Aurière, M. & Koch-Miramond, L. 1996 MNRAS 282, L37
- (19) Homer, L. & Charles, P. A. 1998, NewA, 3, 435
- (20) Homer, L. et al., 2001 MNRAS 322, 827
- (21) Ilovaisky, S. A., Auriere, M., Koch-Miramond, L., Chevalier, C., Cordoni, J.-P. & Crowe, R. A. 1993, A&A, 270, 139
- (22) Ioannau et al 2001, A&A submitted
- (23) Levine, A. M., Bradt, H. V., Enevoldsen, A., Morgan, E. H., Remillard, R. A., Wen, L. & Smith, D. A. 2000, American Astronomical Society, HEAD meeting 32, 4307
- (24) Lewin, W.H.G, van Paradijs, J. & Taam, R.E. 1995 in “X-Ray Binaries”, Lewin, W.H.G, van Paradijs, J., van den Heuvel, E.P.J. (eds.) (Cambridge: Cambridge Univ. Press)
- (25) Livio, M., 1996, in Milone E. F., Mermilliod J. -C., eds, ASP Conference Series 90: The Origins, Evolution, and Destinies of Binary Stars in Clusters, p. 312.
- (26) Lyne, A.G. 1996 Proc. 7th Grossman Meeting, Stanford, World Scientific, p1213
- (27) Ogilvie, G. I. & Dubus, G. 2001, MNRAS.320, 485
- (28) Phinney E.S. 1996, in Milone E. F., Mermilliod J. -C., eds, ASPConference Series 90: The Origins, Evolution, and Destinies of Binary Stars in Clusters, p.163.
- (29) Rappaport, S., Ma, C. P., Joss, P. C. & Nelson, L. A. 1987, ApJ, 322, 842
- (30) Rosenberg et al. 2000 AAS, 145, 451
- (31) Scargle, J. D. 1982 ApJ 263, 835
- (32) Sidoli, L., Parmar, A.N., Oosterbroek, T., Stella, L., Verbunt, F., Masetti, N. & Dal Fiume, D. 2001, A&A, 368, 451
- (33) Smale, A.P. 2001 ApJ in press, astro-ph/0107593
- (34) Uttley, P. et al., 2001 MNRAS, Submitted
- (35) van Paradijs, J., Dotani, T., Tanaka, Y., Tsuru, T. 1990, PASJ, 42, 633
- (36) van Paradijs, J., McClintock, J. E. 1995, “Optical and Ultraviolet Observations of X-ray Binaries”, in X-ray Binaries, eds. W.H.G. Lewin, J. van Paradijs, and E.P.J. van den Heuvel (Cambridge: Cambridge Univ. Press), p. 58
- (37) Ubertini, P., Bazzano, A,; Cocchi, M., Natalucci, L., Heise, J., Muller, J. M. & in ’t Zand, J. J. M. 1999 ApJ 514, L27
- (38) White, N.E. & Angelini, L. 2001, ApJ in press, astro-ph/0109359
- (39) Wijers, R. A. M. J. & Pringle, J. E. 1999, MNRAS 308, 207