High spectral resolution time-resolved optical spectroscopy of V893 Sco111Based on observations obtained at ESO La Silla (ESO Proposal 64.H-0028(A))
Abstract
We present high resolution time-resolved optical spectra of the high inclination short orbital period dwarf nova V893 Sco. We performed spectral analysis through radial velocity measurements, Doppler mapping, and ratioed Doppler maps. Our results indicate that V893 Sco’s accretion disk is dissimilar to WZ Sge’s accretion disk, and does not fit any of the current accretion disk models. We derive the system parameters M1 and , and present evidence for V893 Sco as a very young cataclysmic variable and an ER UMa star. We advance the hypothesis that all ER UMa stars may be newly formed cataclysmic variables.
1 Introduction
Emission lines in high inclination short orbital period dwarf novae consist of strong hot spot emission superimposed on a double peaked profile from the accretion disk (Warner, 1995). The hot spot emission, because of the binary system orbital motion, produces the characteristic S-wave motion seen in trailed spectrograms (Honeycutt, Kaitchuck, and Schlegel, 1987). Doppler maps of dwarf novae emission lines show clear indications of both the hot spot and the accretion disk emission, the latter producing a ring-shaped bright region in velocity space (Kaitchuck et al., 1994). Emission lines from the accretion disk imply that part of the accretion disk gas is optically thin and has low density (Kaitchuck et al., 1994; Williams, 1980; Tylenda, 1981). Optically thin, low gas density accretion disks are predicted in short orbital period dwarf novae, due to their low mass transfer rate (Howell, Szkody, and Cannizzo, 1995; Howell, Rappaport, and Politano, 1997, gr sec-1).
Photometric and spectroscopic studies of short orbital period dwarf novae at quiescence show accretion disks which do not fit in the standard optically thick -disk model (e.g. WZ Sge Mason et al. 2000, Skidmore et al. 2000; Z Cha and OY Car Wood 1990). In particular, recent works on WZ Sge (Mason et al., 2000; Skidmore et al., 2000) have shown evidence for an optically thin accretion disk in the emission lines, and an optically thick hot spot elongated along the stream trajectory. Observational testing is fundamental to prove or disprove current accretion disk models and evolutionary theories. Thus, the authors have undertaken a project aimed at the study of the accretion disks in quiescent, short orbital period dwarf novae, through time resolved spectroscopy. V893 Sco was selected because it is a high orbital inclination system showing hot spot eclipse (Bruch, Steiner, and Gneiding, 2000) and strong double peaked Balmer emission lines similar to WZ Sge.
We describe our new observations of V893 Sco and the data reduction in Section 2. Results from trailed spectra, Doppler and ratioed Doppler maps, and radial velocity curves are presented in Section 3. Section 4 discusses our understanding of V893 Sco’s accretion disk structure and compares it with that of WZ Sge, a similar looking short orbital period dwarf nova. The present evolutionary status of V893 Sco is also discussed. Section 5 summarizes our results.
2 Observation and Data Reduction
Observations were carried out on 2000 March 3 and 4 UT on the NTT telescope in La Silla. EMMI222EMMI is a multi-mode instrument for optical spectroscopy in low, medium, and high spectral resolution, and optical wide field imaging. EMMI has two arms, one optimized for the Blue and one for the Red wavelength range of the optical wave-band. was used in medium resolution mode, with gratings Grat3 and Grat6 mounted in the Blue and the Red arm, respectively. Observations were performed simultaneously by the use of a dichroic with central wavelength 450 nm. A detailed log of the observations is summarized in Table 1.
Both nights were photometric and the seeing was always , thus, the slit aperture was set to . Each night the standard star Feige 56 was observed before V893 Sco for flux calibration. HeAr and ThAr arc exposures were taken only at the beginning and the end of the object observations and used for wavelength calibration of the Blue and the Red arm, respectively.
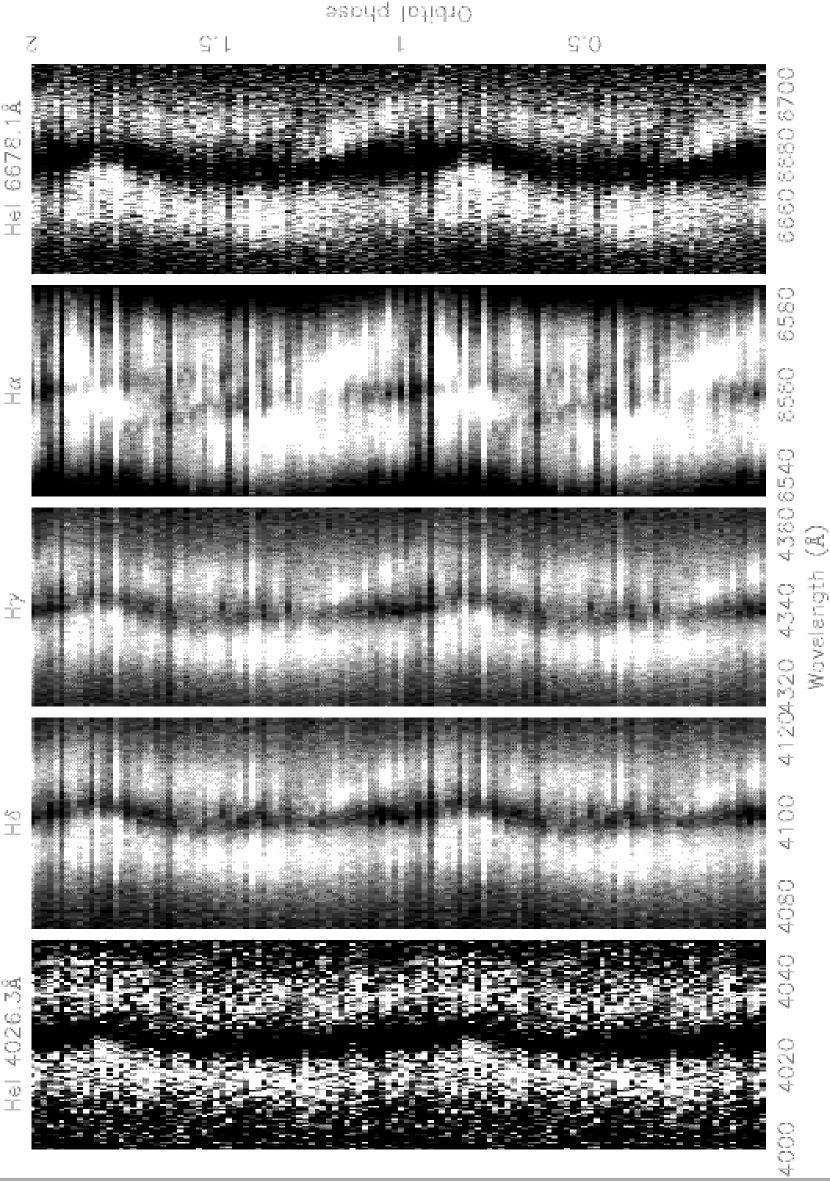
Data reduction was performed by one of us (E.M.) using the standard IRAF routines ccdred and onedspec. Each frame was bias subtracted and flat field corrected using exposures taken on the morning following each observing night. Wavelength calibration was performed by extracting the matching arc for each spectrum and by fitting the arc emission lines with a spline-3 of 1st or 2nd order in both arms. The number of fitted lines varied between 55-60 in the blue and 15-20 in the red; both fits were carried out keeping the residuals of the fitting function 10-12 Km sec-1, i.e. Å/pixel. A sample of the reduced and phase folded spectra is shown in Figure 1
3 The emission lines analysis
3.1 Trailed spectra and Doppler maps
In V893 Sco, the emission line profile evolution through an orbit (see Figure 1), appears quite confusing at first glance. The three Balmer lines show different profiles and profile evolution. For example, the H line shows multi-peaked profiles which are never observed in the blue arm spectra and not explained by the standard S-wave motion. The two HeI emission lines 4026.3 and 6678.1 seem to follow the profile evolution shown by the H and H lines.
Trailed spectrograms (Figure 2) for the five emission lines show a lack of the typical S-wave component, and and the V/R ratio is at all phases. Since the lack of the S-wave component cannot be due to the time resolution of our spectra, the following two physical interpretations can be advanced: 1) there is not significant hot spot emission, 2) the accretion disk gas is optically thick in the emission lines, thus, the line emissivity is strongly anisotropic. The line photons emerge more readily in directions along which the Keplerian velocity field provides a large Doppler shifted gradient (Horne and Marsh, 1986). The above two hypotheses are not mutually exclusive.
Doppler maps of the Balmer lines have been generated by using the back projection algorithm in the data reduction package molly (written by T. Marsh, see Horne 1991 for details of the back projection technique). The spectra were continuum subtracted (the continuum was fit by a first order spline3) and Fourier Filtered before back projection (both blue and red arm spectra). Phasing of the spectra was made according to the photometric ephemeris given in Bruch, Steiner, and Gneiding (2000). Spectra around phase were not excluded as we verified that the emission line fluxes do not show any eclipse effects.
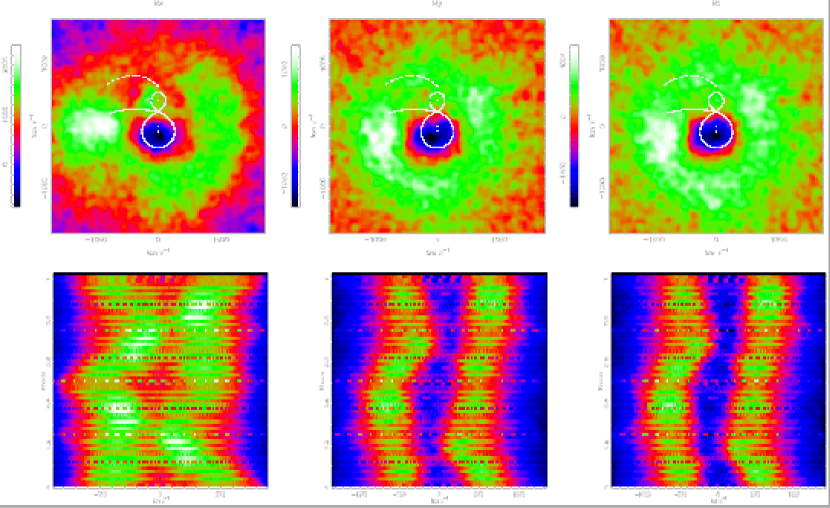
Figure 3 shows Doppler maps and reconstructed trailed spectrograms for the three Balmer lines. All three Doppler maps show a relatively strong emission at roughly the expected hot spot position. Indeed, trailed spectra in Figure 2 show enhanced emission in the Blue and Red accretion disk peak in the phase ranges 0.1-0.25 and 0.4-0.55333In the case of the H emission line also the phase range 0.7-0.85 contributes to the hot spot emission in the Doppler map., respectively, which may be evidence of some hot spot emission. The reconstructed trailed spectra show that such enhanced emission produces the hot spot region in the back projected Doppler maps. However, the hot spot emission is stronger than the accretion disk emission only by, at most, 20% and 10% in the H and H and H lines, respectively.
In the H Doppler map, the hot spot emission is centered at and Km sec-1 and is quite elongated toward negative values. Previous H Doppler maps of V893 Sco (Matsumoto, Mennickent, and Kato, 2000) show the hot spot centered at about the same position, but different in both size and orientation. The accretion disk emission appears to arise mainly from the leading side of the disk, being strong between phases 0.15-0.5 and weak otherwise. Non-uniform accretion disk emission was also pointed out by Matsumoto, Mennickent, and Kato (2000), however their Doppler maps show the accretion disk inhomogeneities to dramatically vary both in extension and position from night to night. Our H Doppler map of V893 Sco provides evidence for emission from the secondary star being irradiated by the hot spot. Irradiation of the secondary star was noticed also by Matsumoto, Mennickent, and Kato (2000), but they observed it to disappear during one of their six nights of observation, just in the pre-outburst stage. There is no evidence of irradiation in the H and H Doppler maps. Doppler maps for H and H show a quite extended hot spot region, centered slightly ahead of the H hot spot emission and possibly elongated along the axis. The hot spot peak intensity appears at , , and , Km sec-1 for H and H respectively, with the H hot spot being double peaked.
3.2 Radial Profiles, Ratioed Doppler Maps, Balmer Decrement, and Continuum Fitting
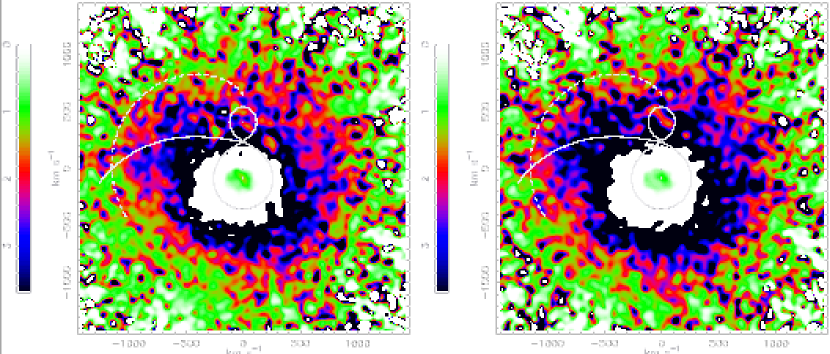
Ratioed Doppler maps444Details of producing Ratioed Doppler maps can be found in Skidmore et al. (2000) (Figure 4) show quite uniform gas densities in the accretion disk and roughly equal flux ratio at the hot spot position and the accretion disk. Radial profiles of the accretion disk emitting regions (Figure 5, first panel) show the line flux to smoothly increase toward the center of the accretion disk in all three of the Balmer lines, while the radial profiles of ratioed Doppler maps increase with the radius (Figure 5, top panels 2 and 3). The derived temperature profiles (Figure 5, bottom panels 2 and 3) are flatter than in an optically thick accretion disk. The innermost accretion disk region (0.1-0.2 R/L1) which apparently matches the temperature profile of an optically thick -disk having gr sec-1, is too noisy to allow any definitive conclusion.
The Balmer decrements H/H and H/H have been computed in three different ways: 1) by ratioing the emission line fluxes, 2) by ratioing the emission line peak intensity as described in Mason et al. (2000), and 3) by averaging either azimuthally and radially different segments in the ratioed Doppler maps. In methods 1) and 2), orbital average values were used as we did not find phase dependent modulations. The Balmer decrement at the hot spot position determined in method 3) is dubious, as the hot spot emission overlaps the accretion disk one. However, despite the different assumptions involved, methods 1), 2), and 3) provide identical Balmer decrement values, within the uncertainties (see Table 2).
In order to derive information on the temperature (and possibly density) of the accretion disk line emitting region, we averaged the three values for each Balmer decrement and . We found and , which correspond either to a blackbody of temperature K555The blackbody temperature was computed including a thermal and/or turbulent broadening correcting factor of (Williams, 1980). Neglecting the thermal broadening we find an upper limit of K for the accretion disk temperature in the optically thick case., or to an optically thin gas either of temperature T8000K and density , or temperature T10000-15000K and density (Williams, 1991, and Figure 6). In the case of optically thick accretion disk emission lines, the hot spot gas cannot have the same Balmer decrement as the accretion disk, otherwise it implies a hot spot gas temperature of TK, which is far too low for the gas impact region.
We also investigated the continuum emission from both hot spot and accretion disk gas. We determined the hot spot continuum emission by subtracting the average of 5 spectra centered at phase 0 (hot spot eclipse) from the average of 5 spectra around phase 0.8 (hot spot facing the observer), and compared the result with a blackbody. The red and blue spectral differences could not be fit with a single blackbody function. We found a 8550150 K and a 1045050 K blackbody to match the continuum slope in the red and blue arm, respectively, possibly indicating that there is a temperature structure in the optically thick hot spot continuum emission. The accretion disk continuum was derived by fitting the continuum in the blue and red arm spectra averaged over both nights. We checked to see if the continuum slope matches an optically thick -disk emission, but found it to be shallower than , matching a best fit blackbody of 11750250 K and 640050 K in the blue and red arm, respectively. The hotter blue continuum possibly indicates a higher gas temperature in the inner accretion disk.
3.3 Radial Velocity Curves
Radial velocity measurements were made on each original spectrum following the Pogson-like method described in Mason et al. (2000). We measured the accretion disk emission line wings by positioning the cursor at different levels above the continuum up to the average line intensity . We verified the wing measurements at intensity levels to not be biased by the hot spot S-wave motion, which is expected to blue-shift the blue wing and red-shift the red wing at phase 0.55 and 0.05 respectively. We observe such a hot spot bias to affect wings measurements at intensity levels . However, we still derived different radial velocity curve fitting parameters depending on the measured emission line. Thus, bias other than the hot spot, must affect our radial velocity measurements.
In order to reduce the uncertainties of the radial velocities, we applied a running-boxcar to our measurements before sine fitting the radial velocity curves. Boxcar smoothing of the radial velocity measurements was preferred to spectra-binning before radial velocity measurements as it does not reduce the phase resolution of the data set. The three smoothed radial velocity curves were fitted with the fitting function as in formula (1) of Mason et al. (2000). The best fitting parameters are summarized in Table 3, while the radial velocity curves and their correspondent fits are plotted in Figure 7. The HeI lines were too weak to allow accurate radial velocity measurements.
The phase of the red-to-blue crossing, (Table 3), corresponds to the phase offset between the spectroscopic and the photometric time for the secondary star inferior conjunction, and is believed to be proportional to the relative intensity of the hot spot emission with respect to the accretion disk emission, and to the hot spot bias in the radial velocity measurements. In the V893 Sco radial velocity curves, the phase offset is small in all three of the Balmer lines, with an average value of . We also found the phase offset not to be proportional to the excitation potential energy of the H emission lines, in contrast with WZ Sge and VY Aqr (Mason et al., 2000, and references therein).
4 Discussion
V893 Sco and WZ Sge are high inclination, short orbital period dwarf novae, both showing a hot spot eclipse in photometric observations and strong double peaked Balmer emission lines in their optical spectra. However, despite these similarities, our spectral analysis applied to V893 Sco and WZ Sge (Mason et al., 2000) provided contrasting results.
The emission lines in WZ Sge are dominated by the hot spot emission which heavily affects the line profile evolution throughout the orbital period. In V893 Sco, the emission lines does not show strong evidence of hot spot emission in any of our spectra, with the exception of H. H and H, and the two HeI lines 4026.3 and 6678.1, show V-shaped profiles and V/R ratios 1 throughout the orbit. Trailed spectrograms of WZ Sge are dominated by the S-wave component, while in V893 Sco, the trailed spectrograms show a complete lack of such a component.
Doppler maps of both WZ Sge and V893 Sco show asymmetric accretion disk emission. However, in WZ Sge, the disk emission appears weak and is superposed by an extremely strong hot spot emission, while the V893 Sco Doppler maps there is the same Balmer decrement at the hot spot position and in the accretion disk gas. Radial profiles of V893 Sco Doppler maps show increasing flux toward the center of the accretion disk, while in the case of WZ Sge the emission line flux is observed to increase outward.
Ratioed Doppler maps of WZ Sge show a statistically significant larger Balmer decrement in the accretion disk than in the hot spot, while in V893 Sco ratioed Doppler maps the Balmer decrement at the hot spot position is larger than or equal to that in the accretion disk gas. Radial profiles of the ratioed Doppler maps and the derived temperature profiles both in the case of V893 Sco and of WZ Sge do not match the profile predicted by an optically thick -disk model. Both systems have flux ratio increasing outward and a quite flat temperature profile.
The radial velocity curves yield different values for the system parameters K1, , and , depending on the accretion disk emission line measured. This is true for both WZ Sge and V893 Sco. However, in the case of V893 Sco, the derived phase offsets are small and not proportional to the excitation potential energy of the emission lines.
In V893 Sco, the V-shaped profile of the emission lines, and the V/R ratios 1, are consistent with saturated emission lines (Horne and Marsh, 1986), and anisotropic turbulence with positive correlation in the vertical and azimuthal velocity components (Horne, 1995). Optically thick emission lines also explain the lack of S-wave components in trailed spectrograms. However, the accretion disk gas temperature of K in the line forming region does not match with any of the current accretion disk models at the mass transfer rate expected in V893 Sco (Osaki, 1996, and see below). Tylenda (1981) derives gas temperatures in the range 4000-5000K, only in the case of either very low mass transfer rates ( gr sec-1), or high mass transfer rate and extended accretion disks ( gr sec-1, cm). Williams (1980) predicts a lower limit of 6000K for the accretion disk line forming region at any mass transfer rate. Both Tylenda (1981) and Williams (1980) predict emission lines to form in the outer accretion disk, while we observe the emission line flux to mostly arise from the inner accretion region.
Our observed emission line flux radial profiles fit the optically thin line hypothesis where the line forming region is a hot corona or a gas layer above the accretion disk. Within such a hypothesis, we would expect the accretion disk continuum flux to be optically thick to explain the lack of S-wave component in trailed spectra and the photometric light curve (Bruch, Steiner, and Gneiding, 2000). However, our continuum analysis was not conclusive and two different blackbodies were found to match our spectra, rather than the expected flux distribution of the optically thick -disk model. Furthermore, the optically thin emission line model does not explain the V-shaped line profiles. The observed V/R ratio 1 may be explained by a bipolar wind flowing perpendicularly to the disk plane with an outflow velocity of km sec-1. However, wind in non magnetic cataclysmic variables is typically observed in the UV band and either in outbursting dwarf novae and in nova-likes (Warner 1995). The only systems where wind has been detected in the optical are BZ Cam (Ringwald and Naylor 1998) and V592 Cas (Huber et al. 1998).
In order to better understand the physics of the ongoing accretion process, the binary system evolutionary status, and possibly constrain the accretion disk, we performed the following computations. We determined the secondary star mass, M2, and radius, R2, for a 1.82 hr orbital period system (see Howell and Skidmore, 2000). We find M and R. We then used this R2, with a first guess for M1, R1, , and the hot spot radius (Smak, 1993, cm,) and azimuth (), to geometrically constrain the orbital inclination . Applying formula 2.79 in Warner (1995) with our K1(H) determination, we computed the white dwarf mass M1. We iterated the computation of and M1 until convergence, keeping constant all the other parameters. The results are and M1=0.89.
We measured the emission line peak separation in the spectra averaged over both nights (see Table 4), to determine the accretion disk radius via the Equation (2) in Mason et al. (2000). We found the accretion disk to extend to in H and H emission lines, and to exceed the primary Roche lobe in H. We believe the H average profile to be biased by both the hot spot and the secondary star emissions which reduce the accretion disk line peak separation.
We can calculate an evolutionary model for V893 Sco using the code described in Howell, Nelson, and Rappaport (2001, Porb=1.82 hr, M1=0.89, and M2=0.175). Figure 8 plots the model results for the mass transfer rate both as a function of the orbital period (left panel) and of the “evolutionary time” (right panel). Figure 8 indicates that for the determined parameters in V893 Sco, the system is likely to be a newly formed cataclysmic variable having just begun mass transfer. This “initial contact” evolutionary phase is relatively short ( yr), and characterized by an increased due to the sudden onset of mass transfer from the secondary star as it tries to adjust itself toward a new equilibrium (Howell, Nelson, and Rappaport, 2001).
Based on the orbital period and optical appearance, V893 Sco is believed to be an SU UMa star, although none of its observed outbursts is time-resolved enough to provide evidence for the occurrence of super-outbursts with super-humps. However, the VSNET database shows outbursts every 30 days spaced by possible “mini”-outbursts (1 mag) every few days. Such a photometric signatures characterizes V893 Sco as a high mass transfer rate system belonging to the ER UMa stars class. The outburst behavior observed in V893 Sco, i.e. short recurrence time ( days) and small outburst amplitude ( mags) is consistent with a cataclysmic variable having a high mass transfer rate and a hot accretion disk at or near constant outburst, similar to the nova-likes.
Given the possible membership of V893 Sco as an ER UMa star and its probable status as a young cataclysmic variable, we examined the evolutionary code also for the ER UMa stars ER UMa, V1159 Ori, and RZ LMi. The masses of the two star components in each system were derived similarly to M1 and M2 in V893 Sco. However, given that none of the three ER UMa stars present any eclipse or partial eclipse, the imposed geometrical constraints were different. Formula 2.79 in Warner (1995) was applied using as input parameters M (where M is the Chandraseckhar upper limit, and M is the lower limit derived by the constraint in super-humps theory, Whitehurst 1988), (where is the average of the two upper limits for no eclipse derived for either a M and M), and and K1 determined by Thorstensen et al. (1997), and Szkody et al. (1996). In order to decrease the uncertainties on M1, we then averaged the derived M1 with results from observed white dwarf mass distributions in cataclysmic variables (Sion, 1999; Webbink, 1990). The input parameters for our evolutionary models corresponding to each ER UMa star are listed in Table 5. The model results show all three of the ER UMa stars to also be at the “-spike” during initial contact, thus being very young cataclysmic variables, similar to V893 Sco. We tested the validity of such a result by making the evolutionary models also for some SU UMa stars with known M1, M2, and (Ritter and Kolb, 1998).The model results were contrary to the observations, predicting incorrect orbital periods for the input masses and vice-versa. We believe that incorrect M1 determinations may be the cause as they depend, by up to 70, on the input M2 (from old, inaccurate M2- relations) in formula 2.79 in Warner (1995). The discrepant M1 values derived for V893 Sco by Matsumoto, Mennickent, and Kato (2000) and us, arise from their use of an improper M2- relationship.
5 Summary Conclusions
High resolution, time resolved spectroscopy of V893 Sco was analyzed and we found the following results:
-
•
Trailed spectra of the emission lines H, H, and H, HeI 4026.3, and HeI 6678.1 were presented. They all show a lack of the S-wave component and V/R ratio 1 (H being the exception) across the whole orbit. Doppler maps of the three Balmer lines were presented. They show a non-uniform accretion disk with the hot spot emission only being stronger than the accretion disk. Doppler maps and trailed spectra also show evidence for H emission from the secondary star irradiated by the hot spot.
-
•
The Balmer decrements, and , were determined by three different methods, all which provide similar values. Average Balmer decrements were used to determine the physical parameters of the accretion disk gas. Our computed values correspond to either an optically thin gas of T8000-15000K or an optically thick gas of T4700K. None of the current models describing emission lines from accretion disks completely satisfy the details of our results, thus, a definitive conclusion about the accretion disk gas temperature can not be reached in the present paper.
-
•
Radial velocity curves for different emission lines yield inconsistent set of systemic parameters K1, , and (as already found in WZ Sge). However, the results are different with respect to WZ Sge as we find only a small phase offset in V893 Sco and no linear-relationship between the orbital phase and the excitation potential energy for hydrogen. We conclude that the hot spot region is not elongated along the steam trajectory with gas temperature decreasing downstream. The hot spot line forming region in V893 Sco is consistent with the gas stream impacting on a denser accretion disk gas.
-
•
The white dwarf mass was determined from the secondary star mass function and the measured K1(H) amplitude. We find MWD=0.89M⊙ and a mass ratio . These system parameters match those of a newly formed cataclysmic variable in our evolutionary models. The high mass transfer rate predicted by either the model and the long term light curve of V893 Sco (VSNET database), together with the accretion disk properties we described in the previous section, imply that V893 Sco is likely to be an ER UMa star. The evolutionary code of Howell, Nelson, and Rappaport (2001) also predicts three other ER UMa stars to be newly formed cataclysmic variables.
The two high inclination, short orbital period systems, V893 Sco and WZ Sge, appear to be spectroscopically similar, yet are two completely different types of system. They not only differ in their accretion disk structure/physics as described in Section 4 but also in their outburst behavior. WZ Sge has the longest recurrence time ( years) and the largest outburst amplitude ( mag); V893 Sco has the smallest outburst amplitude (1.5-2.0 mag) and a short outburst recurrence time (30 days). The derived properties for the accretion disks in these two stars appear consistent with current evolutionary theory. WZ Sge has been shown to not fit the standard -disk model (Skidmore et al., 2000; Mason et al., 2000), is expected to have an extremely low mass transfer rate (Howell, Szkody, and Cannizzo, 1995; Osaki, 1995; Smak, 1993, gr sec-1), and to be near or past the orbital period minimum (Howell, Szkody, and Cannizzo, 1995; Ciardi et al., 1998).
V893 Sco also does not fit the the standard -disk model, nor any of models accounting for at least a partly optically thin disk. We show it to be a high mass transfer rate, short orbital period dwarf novae with in the range 1015-16 gr sec-1 and predict it to be an ER UMa star, and a newly formed cataclysmic variable. The high mass transfer rate invoked to explain the outburst recurrence time would be a natural consequence of the sudden onset of the mass transfer process. However, time resolved light curves and long term monitoring are necessary to definitely prove or disprove our hypothesis that V893 Sco is an ER UMa star, by detecting super-humps and confirming mini-outbursts.
References
- Bruch, Steiner, and Gneiding (2000) Bruch, A., Steiner, J. E., Gneiding, C. D., 2000, PASP, 112, 237
- Ciardi et al. (1998) Ciardi, D. R., Howell, S. B., Hauschildt, P. H., Allard, F., 1998, ApJ, 504, 450
- Honeycutt, Kaitchuck, and Schlegel (1987) Honeycutt, R. K., Kaitchuck, R. H., and Schlegel, E. M., 1987, ApJS, 65 451
- Horne and Marsh (1986) Horne, K., Marsh, T. R., 1986, MNRAS, 218, 761
- Horne (1991) Horne, K., 1991, Fundamental Properties of Cataclysmic Variables Star, San Diego University publ.
- Horne (1995) Horne, K., 1995, å, 297, 273
- Howell, Szkody, and Cannizzo (1995) Howell, S. B., Szkody, P., Cannizzo, J. K., 1995, ApJ, 439, 337
- Howell, Rappaport, and Politano (1997) Howell, S. B., Rappaport, S., Politano, M., 1997, MNRAS,287, 929
- Howell and Skidmore (2000) Howell, S. B., Skidmore, W., 2000, NewAR, 44, 33
- Howell, Nelson, and Rappaport (2001) Howell, S. B., Nelson, L. A., Rappaport, S., 2001, ApJ, 550, 897
- Huber et al. (1998) Huber, M. E., Howell, S. B., Ciardi, D. R., Fried, R., 1998, PASP, 110, 784
- Kaitchuck et al. (1994) Kaitchuck, R. H., Sclegel, E. M., Honeycutt, R. K., Horne, K., Marsh, T. R., White, J. C., and Mansperger, C. S., 1994, APJSS, 93, 519
- Mason et al. (2000) Mason, E., Skidmore, W., Howell, S. B., Ciardi, D. R., Littlefair, S., Dhillon, V. S., 2000, MNRAS, 318, 440
- Matsumoto, Mennickent, and Kato (2000) Matsumoto, K., Mennickent, R. E., Kato, T., 2000, A&A, 363, 1029
- Osaki (1995) Osaki, Y., 1995, PASJ, 47, 47
- Osaki (1996) Osaki, Y., 1996, PASP, 108, 39
- Ringwald and Naylor (1998) Ringwald, F. A., Naylor, T., 1998, AJ, 115, 286
- Ritter and Kolb (1998) Ritter, H., Kolb, U., 1998, AAS, 129, 83
- Sion (1999) Sion, E. M., 1999, PASP, 111, 532
- Skidmore et al. (2000) Skidmore, W., Mason, E., Howell, S. B., Ciardi, D. R., Littlefair, S., Dhillon, V. S., 2000, MNRAS, 318, 429
- Smak (1993) Smak, J., 1993, Acta Astronomica, 43, 101
- Szkody et al. (1996) Szkody, P., Silber, A., Honeycutt, R. K., Robertson, J. W., Hoard, D. W., Pastwick, L., 1996, in Cataclysmic Variables and Related Objects, Kluwer Academic Publishers, pp 55
- Thorstensen (1999) Thorstensen, J. R., 1999, IBVS, 4749
- Thorstensen et al. (1997) Thorstensen, J. R., Taylor, C. J., Becker, C. M., Remillard, R. A., 1997, PASP, 109, 477
- Tylenda (1981) 1981, Tylenda, R., Acta Astronomica, 31, 127
- Webbink (1990) 1990, Webbink, R. F., in Accretion Powered Compact Binaries, ed. W. Mauche, pp 177
- Whitehurst (1988) Whitehurst, R., 1988, MNRAS, 232, 35
- Williams (1980) Williams, R. E., 1980, AJ, 235, 939
- Williams (1991) Williams, G. A., 1991, AJ, 101, 1929
- Wood (1990) Wood, J. H., 1990, MNRAS, 243, 219
- Warner (1995) Warner, B., 1955, Cataclysmic Variable Stars, 691 Cambridge University Press, Cambridge


| Obs Date (UT) | -range (Å) | Em line | Disp (A/pix) | Exp time (sec) | of Orbits | of Spectra |
|---|---|---|---|---|---|---|
| 03/03/2000 | 6243-6865 | H | 0.39 | 300 | 1.45 | 24 |
| 03/03/2000 | 3990-4550 | H + H | 0.39 | 300 | 1.45 | 24 |
| 04/03/2000 | 6243-6865 | H | 0.39 | 300 | 2.26 | 38 |
| 04/03/2000 | 3990-4550 | H + H | 0.39 | 300 | 2.26 | 38 |
| (method 1) | (method 2) | (method 3) | |||
|---|---|---|---|---|---|
| Emission line | Peak Intensity | Ratio Maps Average Radial Profile | |||
| Disk | Hot Spot | Disk | Hot Spot | ||
| 2.270.45 | 2.030.42 | 2.390.76 | 2.251.02 | 2.220.93 | |
| 3.050.74 | 2.010.62 | 2.340.75 | 2.681.34 | 2.611.29 | |
Note. — Balmer decrement values derived for the hot spot gas via method 3) (last column in the table) are not subtracted of the accretion disk contribution. See text for further explanations.
| Line | Central Wavelength | V/R crossing | amplitude | Systemic velocity () |
|---|---|---|---|---|
| Å | km sec-1 | km sec-1 | ||
| H | 6560.03745 | 0.07980.012 | 80.67.5 | -135.34.8 |
| H | 4340.97680 | 0.03540.027 | 54.68.6 | 32.97.7 |
| H | 4102.28000 | 0.03850.016 | 83.77.6 | 42.45.4 |
| Emission Line | Half peak separation |
|---|---|
| (km sec-1) | |
| H | 393.34.6 |
| H | 606.26.9 |
| H | 649.27.3 |
| Star name | M2 (M⊙) | M1 (M⊙) | ||||||||||
|---|---|---|---|---|---|---|---|---|---|---|---|---|
| ER UMa | 0.14 | 0.860.12 | ||||||||||
| V1159 Ori | 0.14 | 0.860.12 | ||||||||||
| RZ LMi | 0.12 | 0.850.10 |
Note. — M1 determined for RZ LMi is an upper limit. Szkody et al. (1996) could not fit any sine curve to their radial velocity curve. Thus, K1=20 Km sec-1 is estimated to be an upper limit for the white dwarf Keplerian velocity.