Braking and bouncing
Abstract
I discuss the case for an efficient orbital braking mechanism in CVs, and the effect of nova outbursts on the observed range of mass transfer rates. I review the continuing problem that models have in interpreting the short–period cut–off of the CV period distribution.
Department of Physics and Astronomy, The Open University,
Walton Hall, Milton Keynes MK7 6AA, UK
1. Introduction
The commonly accepted model for the formation of cataclysmic variables (CVs) with hydrogen–rich main-sequence or brown dwarf donor stars involves four main assumptions.
-
1.
The progenitor system was a wide enough binary to allow the progenitor star of the white dwarf, an intermediate–mass star, to evolve to giant dimensions prior to Roche–lobe contact.
-
2.
The system evolved through a common envelope (CE) phase which exposes the giant’s degenerate core, the future white dwarf, and tightens the orbit.
-
3.
Orbital angular momentum (AM) losses drive the post-common envelope system into contact, and drive mass transfer in the semi–detached system.
There are various clues to the magnitude of the AM loss rate.
The overwhelming majority of CVs below 2 hrs orbital period, , are dwarf novae, while at longer periods novalikes and dwarf novae are observed with roughly equal frequency. Dwarf novae are unstable disc accretors where the mass transfer rate is below a critical limit so that the hydrogen–ionisation instability is not suppressed. The relative distribution of novalike CVs and dwarf novae with orbital period thereferore suggests that the transfer rate is significantly smaller than at short , while must be close to at longer . As the critical rate typically scales as (e.g. Shafter 1992, and references therein), the secular mean transfer rate, and hence the AM loss rate, must be significantly smaller at short orbital periods ( hr) than at longer periods.
The well known disrupted orbital braking model for the orbital period gap (Spruit & Ritter 1983, Rappaport, Verbunt & Joss 1993) is an extreme manifestation of this dependence: the AM loss rate drops essentially discontinuously by more than an order of magnitude, causing the systems to detach at the upper edge of the gap. The width of the gap requires that the mass transfer rate at this point is M yr-1 for unevolved Pop I donor stars (e.g. Stehle, Ritter & Kolb 1996). This is almost two orders of magnitude larger than the rate driven by gravitational radiation (GR). Conversely, the short–period cut–off of the observed period distribution at 78 min, when interpreted as the minimum period that coincides with the donor’s transition from a main–sequence star to a brown dwarf (Paczyński 1981), seems to require a braking rate which is at most a factor of 3 above the value set by GR.
Constraints on from estimated absolute magnitudes of CVs suffer from distance uncertainties, difficulties in determining the duty cycle of dwarf novae, and in mapping visual magnitudes to disc accretion rates. The deduced transfer rates are, on average, larger above the gap than below the gap, and there seems to be a considerable intrinsic spread of the values at least for systems above the gap (e.g. Figure 9.8 in Warner 1995).
The spectral type of CV donor stars above the gap is, on average, later than that of an unevolved main–sequence star in thermal equilibrium that would fill its Roche lobe at the same orbital period (e.g. Baraffe & Kolb 2000). In the period range 3–6 hrs this is a natural consequence if the stars experience mass loss at a rate consistent with the period gap width.
Townsley and Bildsten (2002) considered the accretional heating of white dwarfs. They assert that the observationally deduced white dwarf temperatures are consistent with a mean accretion rate of order a few yr-1 in CVs above the gap, and yr-1 below the gap.
The last three clues — gap width, late spectral types, accretional heating — constrain the long–term mean of the transfer rate, averaged over typically a thermal time of the donor star.
In the following three sections I briefly discuss the status of our understanding of magnetic braking, the effect of nova outbursts on the observed mass transfer rates, and the shape of the period distribution below 2 hrs. A recent review that covers also other applications of the standard disrupted braking model of CV evolution is given by Kolb (2001).
2. Magnetic braking
It has been suggested that magnetic stellar wind braking, usually thought to be the dominant AM loss mechanism in CVs, is much weaker than previously thought (Andronov, Pinsonneault & Sills 2001; Pinsonneault, these proceedings). This work represents a long overdue generalisation of the so–called Skumanich law for solar–type stars to rapidly rotating stars (in some cases almost as rapid as CV secondaries) and spectral types other than G. The AM loss rate has a Skumanich form at small values of the rotational angular speed , but appears to saturate for rapid rotators to give .
A note of caution applies to this “new” braking law. Building on the work of Krishnamurti et al. (1997), Sills et al. (2000), and others, Andronov et al. deduced this AM loss rate from the observed rotation rates in young open clusters. The procedure involves the deconvolution of various physical mechanisms that all affect the surface rotation of cluster stars: the pre–main sequence contraction of stars, the redistribution of angular momentum inside the star, interaction with protostellar discs, and the rotational braking by magnetic braking. It is clear, though, that the fastest rotators in young open clusters do not brake (by far) as fast as the original Skumanich law would have suggested.
It is equally clear that the AM loss rate deduced by Andronov et al. cannot account for the large accretion rates observed above the period gap, nor for the degree of thermal disequilibrium the spectral type evidence seems to suggest. Likewise, the period gap model would have to be modified because the braking rate is continuous over the fully convective boundary. Until there is a viable alternative to the current thinking that the gap arises because systems are detached while they cross the gap region, and unless all novalike systems represent, in evolutionary terms, short–lived states with a high accretion rate, the AM loss rate in CVs above 3 hrs orbital period must be much larger than the AM loss rate Andronov et al. derive for single stars.
Potential mechanisms for additional orbital braking include circumbinary discs (Spruit & Taam 2001) and accretion disc winds (Livio & Pringle 1994), the latter only in systems close to mass transfer instability (King & Kolb 1995). However, such alternative scenarios usually fail to reproduce sufficiently sharp period gap boundaries. It will be interesting to watch the evolution of the observed period distribution; the most recent list of systems (Downes et al. 2001, period as of 1 July 2001) displays gap boundaries which are less sharply defined than in earlier samples (e.g., compare Figure 1, left panel, with Fig. 1 in Kolb 1996).


3. The effect of nova outbursts
The effect of nova outbursts on the distribution of mass transfer rates in CVs with similar orbital period (henceforth transfer rate spectrum for short) has been revisited by Kolb et al. 2001. Prior work by Shara et al. (1986) pointed out that as a result of the ejection of a nova shell the transfer rate can drop by one or more orders of magnitude. They hypothesized that CVs “hibernate”, i.e. most of the time between nova outbursts they are effectively detached with no mass transfer, and accrete only in short intervals that precede a classical nova outburst. However, Shara et al. (1986) did not consider how the transfer rate varies with stellar radius and Roche lobe radius , and how both of these radii change with time.
Adopting a simple exponential law,
where is the photospheric scaleheight (e.g. Ritter 1988), and assuming that the star’s thermal relaxation is the same as in the mean evolution (averaged over individual nova outbursts), reveals an area of parameter space where significant widths of the transfer rate spectra can occur. Generally, this occurs when the ejected envelope mass is larger than a critical limit, and the effect is strongest if the ejection is ballistic, i.e. if the affected shell does not gain additional AM while ejected.
Conditions for wide spectra are most favourable if the WD mass () is small and the system is dynamically unstable against conservative mass transfer. For a typical WD mass, , the transfer rate spectrum is wider than 1 dex if
| (1) |
The scale factor , the ratio of photospheric scaleheight to stellar radius in units of , is about unity for CV donor stars. Nova ejecta masses of this order have been suggested both by theoretical model calculations (e.g. Prialnik & Kovetz 1995) and by observational estimates (e.g. Starrfield 1999).
Systems that are dynamically unstable in the absence of nova outbursts do not develop the instability as the transfer rate is kept in check through nova outbursts. The phase space of systems that are dynamically unstable in the absence of novae but dynamically stable in the presence of novae is quite large, and may be populated by a non–negligible fraction of the observed CVs. This is illustrated in Figure 1 (right panel) where we plot the critical lower limit on the WD mass for dynamically stable mass transfer, both for the case of conservative mass transfer (upper curve) and for mass transfer with ballistic nova ejections (lower curve). The dashed lines (from top to bottom) indicate the lower mass limit on C/O WDs, the upper mass limit on He WDs and the lower mass limit on He WDs as obtained by standard population synthesis calculations (e.g. Willems, Mundin & Kolb, this volume).
Any CVs residing in between the two stability curves contribute to a significant widening of the mass transfer spectra if condition (1) is met. The overall impact of nova outbursts on the transfer rate spectra must be assessed with population synthesis calculations. As an illustraton, Figure 2 shows results from a standard CV model population, i.e. with standard assumptions about the common envelope evolution and magnetic braking strength, following the method used by Howell, Rappaport & Nelson 2001. The solid curves refer to a population with constant ejecta mass , while the dashed curves represent a population where the transfer rate was averaged over individual nova outbursts.

The figure shows that the transfer rate spectra with novae are wider than in the averaged model for periods in the range , while the differential effect is negligible everywhere else. The mean value of the two different distributions is necessarily the same and set by the AM loss rate, while the width of the nova–affected distributions is insensitive to the adopted systemic AM loss rate. In other words, the effective widening of the spectra works also for a much less efficient magnetic braking rate.
A higher weighting of brighter (higher ) systems would skew the distributions towards larger values of . In that case the observed average transfer rate of the weighted distribution immediately above the gap is larger than the secular mean rate set by the AM loss rate. This could alleviate the problem that the transfer rate at the upper edge of the gap required to explain the width of the period gap is smaller than the critical rate for disc instability, in apparent conflict with the observed underabundance of dwarf novae in the hr period interval (e.g. Shafter 1992).
At longer orbital periods the effect of novae is negligible. Podsiadlowski, Han & Rappaport (2001) point out that the relatively large fraction of CVs with a somewhat evolved donor star could give rise to a greater width of the mass transfer spectra above 5 hrs than the ones shown in Figure 2.
4. CVs on the edge
The shape of the CV period distribution below 2 hrs continues to challenge the standard model of CV evolution. The well known short–period cut–off at min is thought to represent the period minimum that systems with hydrogen–rich donor stars reach when their evolution is driven by gravitational radiation (e.g. Paczynski 1981, Kolb & Baraffe 1999, and references therein). The problems with this interpretation are summarised in Figure 3. The upper panel shows the lower end of the CV period distribution ( hrs; data from an updated version of Ritter & Kolb 1998; see also Downes et al. 2001). Even with the most up–to–date input physics which is so successful in describing very low–mass stars and brown dwarfs (e.g. Chabrier & Baraffe 2000) the calculated value for the minimum period is more than min smaller than the observed cut–off (middle panel), consistent with earlier findings (e.g. Kolb & Ritter 1992). Perhaps even more seriously, the very fact that systems evolve through a state with implies that there will be an accumulation of systems at the period minimum (a “period spike”). The lower panel of Figure 3 shows the discovery probability for an ensemble of CVs that form continuously with secondary mass and WD mass.

Various mechanisms have been proposed that would move the calculated period minimum to longer periods. Most assume an additional form of AM losses, e.g. magnetic braking. Numerical experiments show that a rate of roughly three times the rate given by gravitational radiation (GR) alone is required to raise the calculated to the observed value (Kolb & Baraffe 1999). The magnetic braking strength claimed by Andronov et al. 2001 is about two times the GR rate. Barker & Kolb (2002; see also this volume) show that consequential AM losses such as accretion disc winds or a magnetic propeller would raise the period minimum by min. Increased AM loss is preferred by Patterson (2001), as it both avoids an overpopulation of the “CV graveyard” — systems with a brown dwarf donor star that have evolved past the period minimum and continue to transfer mass at a very low rate — and removes a claimed systematic discrepancy in the mass–radius relation of low–mass single stars and donors in short–period CVs.
Other attempts to reconcile the calculated and observed minimum period focussed on the Roche model and the approximation of the lobe–filling component in a semi–deatched binary by a one–dimensional stellar model. Nelson et al. (1985) used corrections for rotational and tidal deformations of the donor star (Chan & Chau 1979) and found a differential increase in by 10%. However, more recently Kolb & Baraffe (1999) obtained a much smaller differential effect ( min) using the same prescription but up–to–date stellar models.
Using a polytropic equation of state, Rezzolla et al. 2001 constructed sequences of self–consistent three–dimensional hydrostatic models of binaries to investigate the quality of the Roche approximation where the component stars are treated as point masses rather than extended mass distributions. The volume–equivalent radius of the critical lobe, the orbital AM, and the GR AM loss rate found from the self–consistent models agree with those from the Roche model to within 1-2%. They also confirmed the validity of the commonly used approximation for the Roche lobe radius in units of the orbital separation given by Eggleton (1983).
As an independent check, Renvoizé et al. (2001) calculated three–dimensional polytropic stars using SPH models with 20,000 particles. Significantly, the volume–equivalent radius of the star at the start of mass loss through the point (as depicted in Figure 4) is larger than the radius of the same star when it is non–rotating and in isolation. The radius increase depends on the polytropic index and is 6% for (as appropriate for fully convective stars near ) and for , the case shown in the Figure.
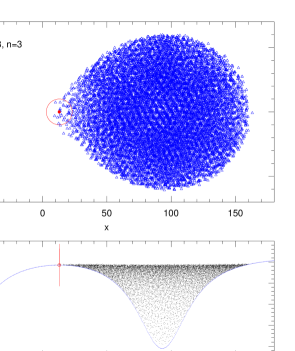
A simple rescaling of the radius of one–dimensional models by a factor 1.06 increases the calculated minimum period of CVs that are driven by GR by about 5 mins ( min if ). This is still well short of the cut–off period; a radius increase of almost is required to match up with the cut–off (e.g. Barker & Kolb 2002). However, it is not straightforard to include the findings from the SPH star into one–dimensional stellar models. The expanded star is likely to have a lower luminosity and hence a longer thermal time. This in turn could lead to period bounce at a longer period. Such a second–order effect cannot be modelled by a simple rescaling.
None of the considerations presented so far address the problem of the missing period spike at . Barker & Kolb (2002) calculated models that effectively “smear out” the period spike, e.g. by allowing a mixed population with consequential AM losses of varying efficiency, or with donor stars that are subject to different degrees of bloating, e.g. due to the effect of magnetic pressure inside the donor star (as suggested by D’Antona 2000). They find that none of the theoretically calculated period distributions fits the observed one as well as a distribution that is simply flat in . It is significant that the missing period spike affects both magnetic and non-magnetic CVs alike, so it seems unlikely that the cause should be related to effects in the accretion disc.
The radical hypothesis put forward by King & Schenker (2002) to abandon the identification of the cut–off with the minimum period altogether may appear to solve both problems, the mismatch and the missing spike, in one stroke. The suggestion that the cut–off is due to an age limit of the population implies that observed CVs close to 80 min orbital period are still evolving to smaller periods. The age limit hypothesis appears to reconcile current stellar models for short–period CVs that are driven by GR with the observed period distribution. The same models then tell us that systems that are currently at 78 min orbital period will continue to decrease for another 0.8 Gyr or so, before they reach the minimum period at about 70 min. This is a measure of how finely tuned the age limit has to be. More importantly, the mass of all hydrogen–rich donor stars in CVs that adhere to the age limit must be larger than . Although there is no CV known where we have unambiguous proof that the donor mass is smaller than this limit, there are several excellent candidates where this is likely, most notably WZ Sge (e.g. Patterson 1998, but see Steeghs et al. 2001). The quest to identify brown–dwarf donor CVs should continue; the first few found would make the age limit hypothesis history.
5. Conclusions
This is an exciting era, challenging our understanding of the evolutionary state of CVs and X–ray binaries. Old paradigms will have to be re–assessed. The magnetic braking of rapidly rotating young, single stars seems to be different from the braking that old, rapidly rotating CV secondaries experience. The best stellar models to date continue to ignore the observed period minimum, and despite an ever increasing number of CVs with determined orbital period they still refuse to pile up at 80 minutes. Do we really understand the long–term evolution of CVs? The answer must be a clear no.
References
Andronov N., Pinsonneault M., Sills A. 2001, ApJ, submitted (astro-ph/0104265)
Baraffe I., Kolb U. 2000, MNRAS, 318, 354
Barker J., Kolb U. 2002, in preparation
Chabrier G., Baraffe I. 2000, ARA&A, 38, 337
Chan K.L., Chau W.Y. 1979, ApJ, 233, 950
D’Antona F. 2000, in Evolution of Binary and Multiple Star Systems, eds. Ph. Podsiadlowski et al. ASP Conf Series 299, 21
Downes R.A., Webbink R.F., Shara M.M., Ritter H., Kolb U., Duerbeck H. 2001, PASP, 113, 764
Eggleton P.P. 1983, ApJ, 268, 368
Howell S.B., Nelson L.A., Rappaport S. 2001, ApJ, 550, 897
King A.R., Schenker K. 2002, this volume
King A.R., Kolb U. 1995, ApJ, 439, 330
Kolb U. 2001, in The influence of binaries on stellar population studies, ed. D. Vanbeveren, Kluwer, Dordrecht, ASSL, 264, 321
Kolb U. 1996, in Cataclysmic Variables and Related Objects, eds. A. Evans, J.H. Wood, Kluwer, Dordrecht, IAU Coll. 158, 433
Kolb U., Baraffe I. 1999, MNRAS, 309, 1034
Kolb U., Ritter H. 1992, A&A, 254, 213
Kolb U., Rappaport S., Schenker K., Howell S. 2001, ApJ, in press (astro-ph/0108322)
Krishnamurthi, Pinsonneault M.H., Barnes S., Sofia S. 1997, ApJ, 480, 303
Livio M. Pringle J. 1994, ApJ, 427, 956
Nelson L.A., Chau W.Y., Rosenblum A. 1985, ApJ, 299, 658
Paczyński B. 1981, Acta Astr., 31, 1
Patterson J. 1998, PASP, 110, 1132
Patterson J. 2001, PASP, 113, 736
Podsiadlowski Ph., Han Z., Rappaport S.A. 2001, MNRAS, submitted (astro-ph/0109171)
Podsiadlowski Ph., Saul Rappaport S.A., Pfahl E. 2001, MNRAS (astro-ph/0107261)
Prialnik D., Kovetz A. 1995, ApJ, 445, 789
Rappaport S.A., Verbunt F., Joss P.C. 1993, ApJ, 275, 713
Renvoizé V., Baraffe I., Kolb U., Ritter H. 2001, in preparation
Rezzolla L., Uryu K., Yoshida S. 2001, MNRAS, in press (gr-qc/0107019 )
Ritter H., Kolb U. 1998, A&AS 129, 83
Shafter A.W. 1992, ApJ, 394, 268
Shara M., Livio M., Moffat A.F.J., Orio M. 1986, ApJ, 311, 163
Sills A., Pinsonneault M.H., Terndrup D.M. 2001, ApJ, 540, 489
Skumanich A. 1972, ApJ, 171, 565
Spruit H.C., Ritter H. 1983, A&A, 124, 267
Spruit H.C., Taam R.E. 2001, ApJ, 548, 900
Starrfield S. 1999, Physics Reports, 311, 371
Stehle R., Ritter H., Kolb U. 1996, MNRAS, 279, 581
Steeghs D., Marsh T., Knigge C., Maxted P., Kuulkers E., Skidmore W. 2001, ApJL, submitted (astro-ph/0109311)
Townsley D.M., Bildsten L. 2002, this volume
Warner B. 1995, Cataclysmic Variables, CUP
Acknowledgments.
I thank Isabelle Baraffe, John Barker, Steve Howell, Andy Norton and Saul Rappaport for help in compiling this review.