A multi-Frequency Study of The Radio Galaxy NGC326.
We present the results of a multi-frequency study of the inversion symmetric radio galaxy NGC326 based on Very Large Array observations at 1.4, 1.6, 4.8, 8.5 and 14.9 GHz. The morphological, spectral and polarization properties of this peculiar object are studied at different levels of spatial resolutions. The interpretation of the data will be discussed in forthcoming papers.
Key Words.:
radio continuum: galaxies – galaxies: active – galaxies: individual: NGC3261 Introduction
The radio source B2 0055+26 was identified with the elliptical galaxy NGC326
during a program directed at the identifications of the optical
counterparts of radio sources selected from the B2 catalogue (Colla et al. (1975)).
Basic properties of NGC326 are reported in Table 1.
The radio source was first mapped by Fanti et al. (1977) at 1.4 GHz with
the Westerbork Synthesis Radio Telescope (WRST) in the snapshot mode.
Because of the interesting structure seen, this observation was followed up by
a more sensitive WRST observation at 5 GHz with an angular resolution of
(Ekers et al. (1978)). At this resolution the radio
source was found to be composed of two curving tails with a striking
180° symmetry. NGC326 was recognized as one of the most spectacular
examples of inversion symmetric radio galaxy. The authors explained the unusual
structure as being due to the slow precession of the radio jets during the lifetime
of the radio source.
Rees (1978) suggested that the beam direction precesses
due to a realignment caused by the accretion of gas with a different
angular momentum direction with respect to the central black hole axis.
Distorted radio galaxies can by classified according to two broad schemes:
the mirror symmetric (‘C’-shape) and the inversion symmetric (‘Z’-shape).
A sub-class, called ‘X’-shape, is characterized by two separate low
brightness wings, almost perpendicular to the currently active lobes.
There is a broad consensus concerning the dynamical interpretation of
the ‘C’-shape.
This kind of distortion is either caused by the translational motion of the
galaxy through the intergalactic medium (wide and narrow angle tails) or
by the orbital motion of the galaxy around a nearby companion
(Blandford & Icke (1978)). The explanation of the ‘Z’-shape and ‘X’-shape
is still uncertain. Along with the secular
jet precession (Rees (1978)), other two alternative scenarios
have been proposed: the sudden realignment of the jet (Wirth et al. 1982)
and the buoyancy of the material from the lobes (Worrall et al. (1995)).
Battistini et al. (1980) found that NGC326 is
a double system composed of two nearly equally bright elliptical galaxies in
a common envelope (“dumbbell” galaxy).
Wirth et al. (1982) investigated the connection between the optical and
the radio morphology for a sample of 100 radio emitting dumbbell
galaxies. They found about a dozen
of sources with ‘Z’ or ‘X’-shape and suggested that the presence of another
equally massive galaxy within 10-30 kpc of a radio galaxy would strongly
influence the jet properties.
Particularly, they argue that in the case of bound circular orbits the
continuous tidal interaction can produce mirror-symmetric
wiggling jets as previously suggested by Blandford & Icke (1978).
In the case of unbound orbits an impulsive interaction between the two
galaxies can lead to an inversion-symmetric radio source like NGC326.
The ’Z’-shape occurs when the duration of the impulsive torque is longer
than the jet outflow time to the lobes, while the ’X’-shape results when
the crossing time is so fast, as compared to the jet outflow time, as to
cause an instantaneous change in the jet direction.
Wirth et al. (1982) studied in detail the case of NGC326,
using a new optical image.
By examining the isophotes they found a brightness difference 1 mag
between the two galaxies and very little deviation from pure ellipticity.
Indeed they proposed NGC326 as a prototype for the class of
undisturbed dumbbell galaxies. They also pointed the
attention to the quite high velocity difference between the two galaxies:
km s-1 (Sargent 1973).
In the meantime the first 20-cm Very Large Array (VLA)
image of the radio source became available (Fomalont (1981),
Ekers (1982)). In the light of the new optical and radio data,
Wirth et al. (1982) reviewed the morphological classification and the
interpretation of the source made by Ekers et al. (1978). They suggested
that NGC326 describe an ‘X’-shape in which the old jet direction
was from NE to SW and the actual jet direction is from SE to NW. Moreover,
both the old and the new lobes show a ‘C’-symmetry but with a difference in
the position angle of about 120° , suggesting that the radio galaxy
has abruptly changed its velocity direction during its transient interaction
with the other galaxy. In the Wirth et al. (1982) picture the velocity of
the jet flow cannot be much grater than the of the galaxies. More
recent redshift measures give
(Davoust & Considère (1995)) and
(Werner et al. (1999)).
NGC326 is the brightest member of a small group of galaxies, Zwicky 0056.9+2636. Werner et al. (1999) measured the redshift for eight galaxies of the group (including NGC326) confirming the presence of a cluster with a mean redshift of and line-of-sight velocity dispersion km s-1. Werner et al. (1999) showed that the brightest of the two optical galaxies (the radio source) is a slowly-moving member of the cluster while its companion has a velocity of about 500 km s-1 relative to the cluster velocity.
The first detailed studies of the intergalactic medium
surrounding NGC326 were done by Worrall et al. (1995) and
Worrall & Birkinshaw (2000). The region containing the source
was imaged in soft X-ray with the ROSAT PSPC. Surprisingly, they
discovered that the galaxy is embedded in a bright asymmetric
X-ray-emitting gaseous medium with properties more typical of a cluster,
rather than of a group. They report a gas temperature of kT
keV and a 0.1-2.4 keV luminosity of W. From
the PSPC image the emitting gas has a full extent of kpc,
stretching north-east of the peak, which coincides with the position
of NGC326. The best description of the radial profile they obtained is a
combination of a cluster -model and an unresolved component
(possibly a hot galactic corona). They obtained a cluster core radius of
171 kpc. Because of the presence of the compact hot corona
centered on NGC326, Worrall et al. (1995) proposed that buoyancy effects
of the radio plasma in the X-ray atmosphere could be responsible for the
bending of the radio lobes. They suggested that, in projection, each radio
lobe bends sideways into a tail as the backflow approaches the galactic
corona. In order to explain the observed source shape, the buoyancy condition
requires a backflow velocity for the lobes material of
km s-1.
| Optical position | 00h58m226 |
|---|---|
| Optical position | +26°51′583 |
| Redshift | 0.0477 |
| Distance | 141 Mpc |
| Magnitude (B) | 13.9 |
| 1.4 GHz total flux density | 1.77 Jy |
| 1.4 GHz total radio luminosity | W/Hz |
| Integrated rotation measure | rad m-2 |
| Overall spectral index | 0.8 |
| Radio source largest linear size | 180 kpc |
| Arcsec to kpc conversion factor | 1″= 0.63 kpc |
| , | |
| We use the convention | |
This is paper I of a series of papers dedicated to the radio galaxy NGC326.
Here we give a description of the morphological, spectral
and polarization characteristics of this radio galaxy.
In Sec. 2 we summarize the observations used in this paper.
A description of the source morphology and its connections with the
polarization and spectral properties is presented in Sec. 3.
In Sec. 4 and 5 we analyzed the jet collimation properties and the source
physical parameters, respectively. A summary of the paper is given
in Sec. 6.
We will discuss the interpretation of the spectral and polarization properties respectively in the forthcoming papers II and III.
2 The VLA observations and data reduction
A summary of the observations, including the VLA configuration, frequency, bandwidth, date and length of observations, is reported in Table 2.
| Array | Frequency | Bandwidth | Date | Duration |
|---|---|---|---|---|
| GHz | MHz | hours | ||
| A | 1.41/1.66 | 12.5 | 02-Dec-1984 | 8.0 |
| A | 4.86 | 12.5 | 03-Dec-1984 | 1.0 |
| B | 4.86 | 25.0 | 22-May-1985 | 3.0 |
| B | 14.96 | 25.0 | 22-May-1985 | 0.9 |
| C | 1.41/1.66 | 50.0 | 28-Sep-1985 | 0.5 |
| C | 4.86 | 50.0 | 28-Sep-1985 | 0.5 |
| C | 14.96 | 50.0 | 28-Sep-1985 | 7.1 |
| D | 4.83 | 50.0 | 28-Sep-2000 | 0.5 |
| D | 8.46 | 50.0 | 28-Sep-2000 | 1.4 |
| D | 14.96 | 50.0 | 23-Nov-1985 | 0.4 |
The flux densities were brought to the scale of Baars et al. (1997) using 3C48 as primary flux density calibrator. The instrumental polarization and the polarization position angle were calibrated using the sources 0116+319 (0042+233 for 6 and 3.5 cm D array) and 3C138 respectively. The 3C138 polarization angle was assumed to have a value of -18° at L band and -24° at higher frequencies. Post calibration reduction was done using the National Radio Observatory (NRAO) AIPS package. The data for each observation were reduced using the standard self-calibration and cleaning procedures. The C array observation at 20 cm, already presented by Parma et al. (1991), has been reanalyzed for the purposes of this project.
| Array | Frequency | Beam | |
| GHz | arcsec | mJy/beam | |
| A | 1.41 | 0.05 | |
| A | 1.66 | 0.05 | |
| B | 4.86 | 0.029 | |
| C | 1.41 | 0.024 | |
| C | 1.66 | 0.021 | |
| C | 4.86 | 0.025 | |
| C | 14.96 | 0.034 | |
| D | 4.83 | 0.06 | |
| D | 8.46 | 0.05 | |
| D | 14.96 | 0.08 | |
| Col. 4: total intensity image noise. | |||
The angular size of NGC326 exceeds 4.4 arcmin. This represents a problem for high frequency imaging since the radio structure size is comparable to the field of view of a single VLA antenna. The old 2 cm observations suffered from this effect. Learning from experience, we followed a specific observation strategy with the more recent 3.5 cm observations. In order to reduce the problems due to the strong primary beam attenuation we splitted the observations into two different pointings centered at appropriate positions on the wings of the source. The two data sets were reduced independently and the resulting couple of images was then combined using the task LTESS in AIPS. Table 3 summarize the relevant parameters of the single-array images.
Data from different arrays were combined to improve uv-coverage and sensitivity. We combined the A and C arrays at 20 cm, the B, C and D at 6 cm, and the C and D at 2 cm. Each combined data set was self-calibrated. The images at different frequencies were cleaned and restored with the same beam using the AIPS task IMAGR. The “original” beams were very similar to the finally adopted ones. For the purposes of the spectral and polarization analysis we made data sets composed of matched resolution images, using natural and uniform weighting. Finally we obtained four distinct resolution data sets with exactly the same cut in the maximum uv baseline at each frequency. Their resolutions are 10″, 4″, 2″, and 12.
| Array | Frequency | ||
| GHz | mJy/beam | mJy/beam | |
| beam | |||
| A+C | 1.41 UW | 0.22 | 0.13 |
| A+C | 1.66 UW | 0.24 | 0.14 |
| C+D | 4.86 NW | 0.07 | 0.06 |
| D | 8.46 NW | 0.07 | 0.01 |
| C+D | 14.96 NW | 0.20 | 0.07 |
| beam | |||
| A+C | 1.41 NW | 0.07 | 0.04 |
| A+C | 1.66 NW | 0.08 | 0.05 |
| B+C | 4.86 NW | 0.05 | 0.03 |
| C+D | 14.96 NW | 0.04 | 0.04 |
| beam | |||
| A+C | 1.41 NW | 0.04 | 0.03 |
| A+C | 1.66 NW | 0.05 | 0.04 |
| B+C | 4.86 NW | 0.04 | 0.03 |
| C+D | 14.96 NW | 0.03 | 0.03 |
| beam | |||
| A | 1.41 UW | 0.06 | 0.06 |
| A | 1.66 UW | 0.07 | 0.07 |
| B+C | 4.86 UW | 0.04 | 0.05 |
| C+D | 14.96 UW | 0.04 | 0.06 |
| Col. 3: total intensity image noise; | |||
| Col. 4: polarization image noise. | |||
The equal resolution data sets are given in Table 4. All the images were corrected for primary beam attenuation. NGC326 is significantly polarized at all frequencies and resolutions. We produced images of the scalar fractional polarization (), depolarization (, defined as the ratio between the fractional polarization at and ) and rotation measure (RM). The polarization images were corrected for the non-Gaussian noise distribution of the polarized intensity. The RM was obtained using the AIPS task RM by a weighted fit of the position angle to the square wavelength at four frequencies.
The spectral analysis has been performed with the program Synage++ (Murgia 2001).
3 Source morphology, spectrum and polarization
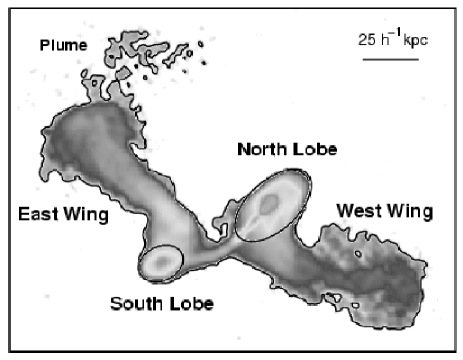
The observations described in the previous section allow us to investigate the morphology of NGC326 at increasing levels of angular resolution. In this section we describe the source morphology and its connections with the polarization and spectral properties going from the extended structures (low resolution images) to the finest details (high resolution images). We refer to the different regions of the radio source as shown in Fig. 3. In particular, the two ellipses indicate the separation we marked between lobes and wings.


3.1 Wings and plume
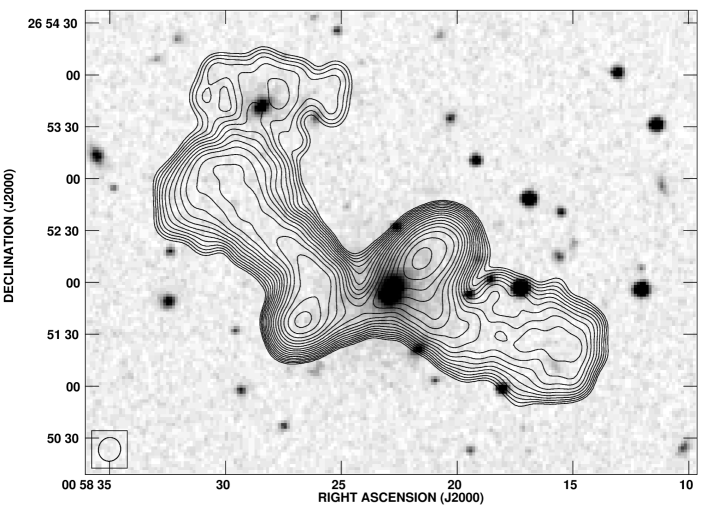
The lower resolution images give us information on the extended structure of the source. At a resolution of about 10″ the lobes are slightly resolved and the most prominent components are the two wings, see Figs. 1 and 2.
The wings bend and extend away from the lobe axis almost by the same extent (). As already noted by Worrall et al. (1995), the overall ‘Z’-shape symmetry of the source is broken by a low surface brightness plume located just above the end of east wing. This plume, evident only in the 20 cm and 6 cm images, does not follow the source symmetry. Fig. 1 shows a galaxy which is located, in projection, in the middle of the plume. This corresponds to galaxy G6 of Werner et al. (1999) with a radial velocity difference of 1026 km s-1 with respect to the center of the cluster. If G6 is a cluster member it moves very fast relatively to the intra-cluster medium (slightly more than twice the line-of-sight velocity dispersion). Since the sound speed in the cluster is km s-1, the motion of G6 would be supersonic. Anyway, the association of G6 to the plume is unclear.
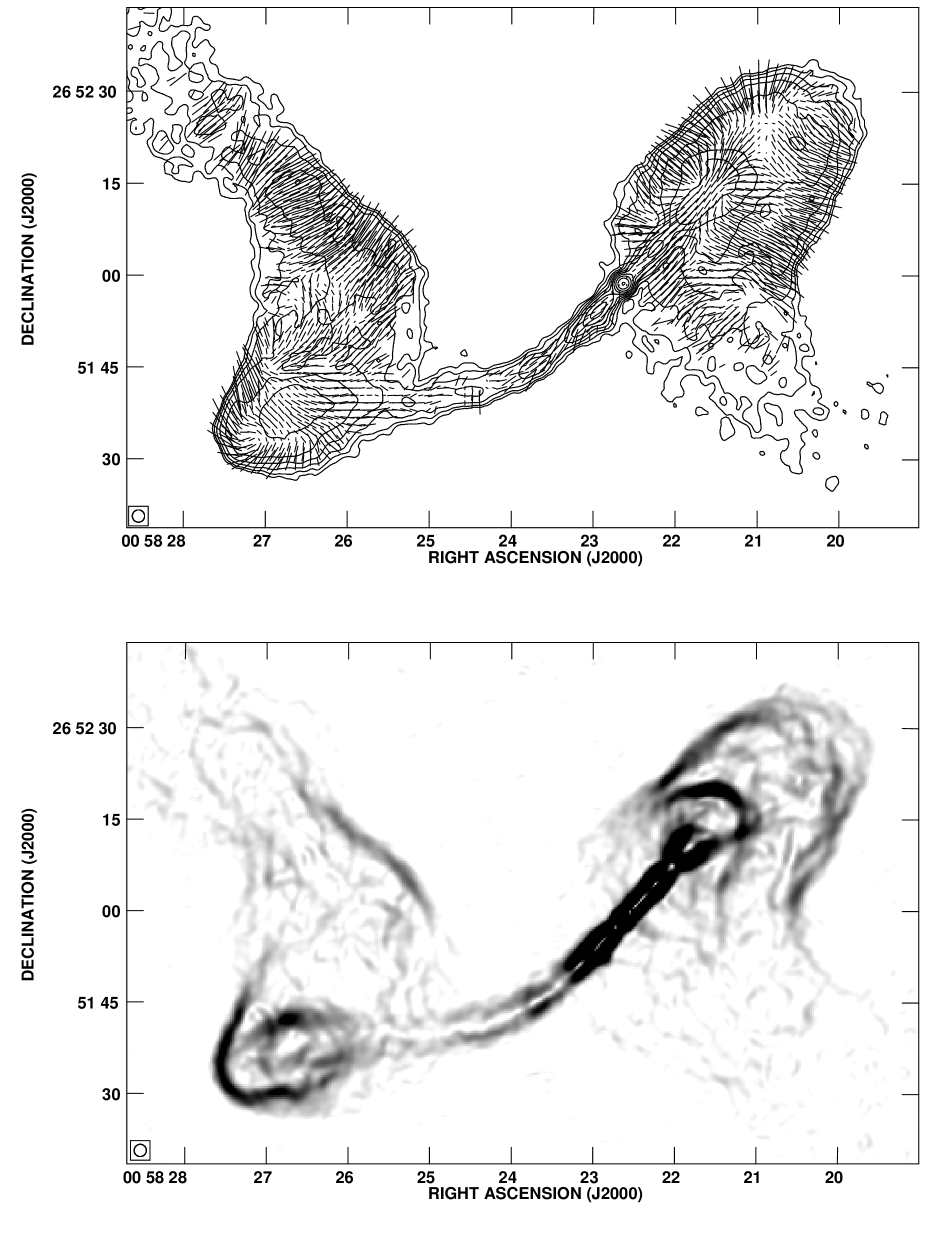
Fig. 2 presents the 8.5 GHz map, with the E-field vectors superimposed (not corrected for RM, see below). The mean polarization percentage (10 ″beam) in the wings is % at 1.4 GHz and % at 4.8 and 8.5 GHz. Both wings show depolarization between 4.8 and 1.4 GHz: the mean values of (10″beam) are 0.3 and 0.2 for the east and west wing respectively. We calculated the RM at 10″ resolution between the frequencies 1.4, 1.6, 4.8 and 8.5 GHz. We found a mean value of rad m-2, which is consistent with the galactic value (Simard-Normandin et al. (1981)), and a standard deviation rad m-2. Given this value for the rotation measure, the apparent magnetic field direction at 8.5 and 4.8 GHz is within few degrees from the real one.
The apparent magnetic field is longitudinal and highly aligned along the main ridge of emission in both the east and, at least in the first part of, the west wing. At the wing edges the magnetic field bends to a circumferential configuration.
The surface brightness of the plume is too low to give a reliable polarization measure.
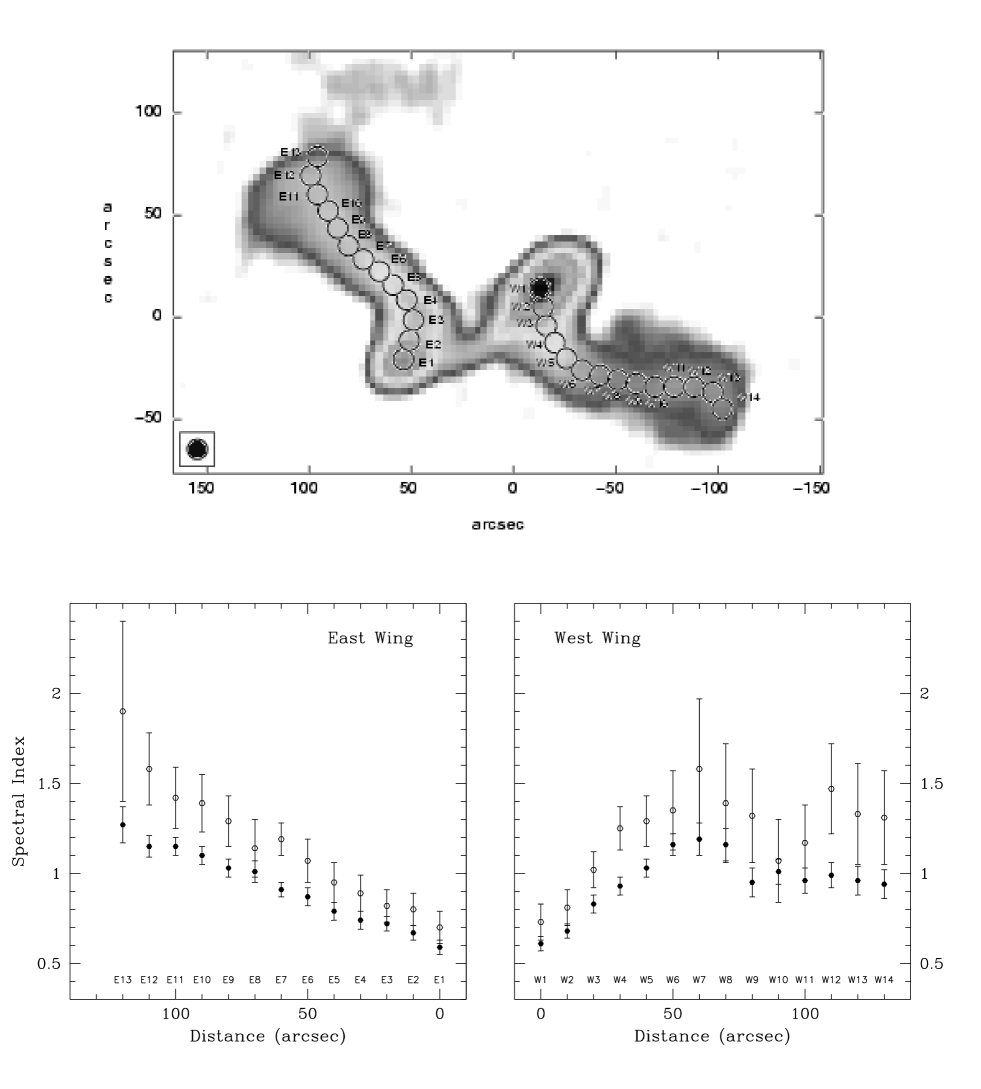
At a resolution of 10″, the radio spectrum of the wings between 1.4 and 8.5 GHz can be computed out to their full extent. Fig. 4 shows a plots of the two-frequency spectral indices, and , as a function of the position along the two wings. The spectral indices have been sampled in circular boxes, of the same size as the beam, centered on the ridge lines of maximum emission. In the east wing there is a clear monotonically steepening of the radio spectrum from the south lobe to the end of the wing: and increase from 0.6 and 0.7 up to 1.3 and 1.9, respectively. The west wing shows a different spectral behavior: and , increase respectively from 0.6 and 0.7, close to north lobe, up to 1.3 and 1.5, at a distance of (38 kpc). In the remaining part of the wing, and decrease and saturate to 1.0 and 1.3, respectively.
The resolution of our images allows us to trace spectral index trends also along directions perpendicular to the wing ridge lines. There are significant lateral spectral index gradients with marked differences between the two wings.
The detailed analysis of these spectral index profiles will be presented in paper II.
3.2 Lobes
The images at an angular resolution of 4″ can be used to study the shape of the two lobes (see Fig. 5). The lobes are quite asymmetric in total emission, extent and distance from the core (see also Fig. 6). The southern lobe has an ellipsoidal shape, while the northern one is more elongated and wider. The north lobe exhibits a shell-like feature which is particularly evident in the gradient image shown Fig. 6. This image, obtained with the AIPS task NINER, also reveals a sharp frontal border in the southern lobe and a straight edge in the east wing. By contrast the northern lobe is characterized by well defined lateral edges but has a smooth frontal border. Both lobes lack hotspots. The only structure with a significant brightness contrast with respect to the underlying lobe is the shell region in the north lobe.
The mean polarization percentage at 8.5 GHz (10″ beam) is 12% and 14% in the south and north lobe, respectively (see Fig. 2). Fig. 6 presents the 4.8 GHz image at 2″ resolution, with the E-field vectors superimposed (not corrected for RM, see Sect. 3.1). The mean scalar fractional polarization at 4.8 GHz is 23% and 29% for the south and north lobe, respectively. The variation of the fractional point to point polarization at 4.8 GHz is strongly correlated with the enhancements seen in the total intensity gradient image. In the lateral edges of the northern lobe and in the frontal head of the southern lobe, the fractional polarization is about 43%. In the sharp western edge of the east wing reaches a value of %. The mean values of (10″beam) are 0.23 and 0.17 in south and north lobe, respectively, while at 2″ resolution they go up to 0.52 and 0.48. In both lobes, the mean RM at 10″ resolution is about -20 rad m-2. As a consequence the Faraday rotation is negligible at 4.8 GHz and the apparent magnetic field in the lobes is circumferential, consistently with the configuration deduced from the lower resolution 8.5 GHz map. The magnetic field configuration is also circumferential around the shell structure, where the fractional polarization is about 30%.
The mean fractional polarization polarization of the lobes as function of frequency and beam area is shown in Fig. 7.

| South Lobe | North Lobe | East Wing | West Wing | Plume | ||
|---|---|---|---|---|---|---|
| (mJy) | 213 | 576 | 536 | 288 | 18 | |
| (arcsec) | ||||||
| (kpc) | ||||||
| , 10″beam | 3% | 2.5% | 6% | 3% | ||
| , 10″beam | 13% | 15% | 22% | 16% | ||
| , 10″beam | 12% | 14% | 17% | 14% | ||
| , 2″beam | 12% | 14% | ||||
| , 2″beam | 23% | 29% | ||||
| , 10″beam | 0.23 | 0.17 | 0.27 | 0.18 | ||
| , 2″beam | 0.52 | 0.48 | ||||
| (rad m-2) | ||||||
| (rad m-2) | 57 | 52 | 35 | 65 |
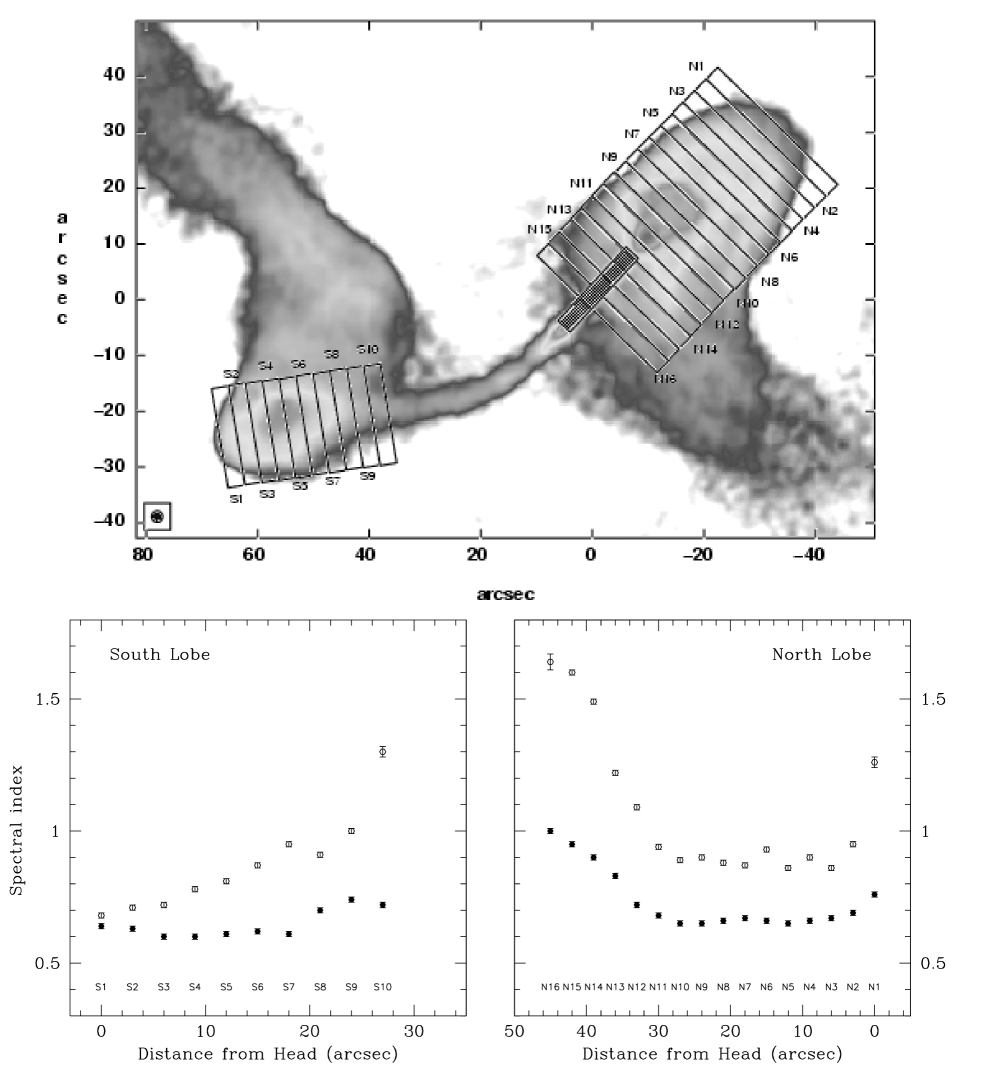
We have computed the average two-frequency spectral indices and along slices perpendicular to the lobe axis from the lobe head back to the core using the 2″ resolution images. Slices are 3″ wide, so that the spectral index measures are practically independent. The regions containing the core and the jet in the northern lobe have been excluded from the statistics. Fig. 8 shows the spectral index trends in the lobes. In the south lobe is roughly constant around a value of 0.6 with a moderate increase to 0.7 at the lobe end; increases from 0.7 to 1.3. The spectral behavior of the north lobe is somewhat complex: and decrease respectively from 0.75 and 1.35, at the lobe head, to 0.65 and 0.9, stay constant from 10″ to 30″, and then increase again up to 1.0 and 1.6 in proximity of the core. The interpretation of the spectral profiles in the north lobe should be considered with caution since it is quite possible that the lobe, the jets and part of the west wing are overlapping each other because of projection effects.
The main properties of radio lobes and wings are summarized in Tab. 5.
3.3 Jets
Images of the jets at a resolution of 2″ and 12 are shown in
Fig. 6 and Fig. 9, respectively. The east jet can be
traced out to a projected distance of 28.4 kpc until the south lobe,
whereas the west jet extends out to 7.6 kpc from the core, where
it suddenly widens and merges into the lobe. Initially both jets are
straight with a position angle . The
east jet bends gradually (with a curvature radius of about 70″) and
approaches the south lobe almost horizontally.
The fractional polarization is about 14% in the east jet.
The overlap with the lobe and the wing precludes estimation of the
fractional polarization in the west jet. The apparent magnetic field
is transverse in the east jet, whereas in the west jet it is initially
transverse and becomes longitudinal in correspondence with the shell.
We derived the spectral index between 1.4 and 4.8 GHz along the two jets as a function of the distance from the core using the 2″ resolution images. The resulting trends are shown in Fig. 10. The spectral index stays almost constant at a value of 0.6 along both jets, although a significant scatter is present in the east jet.
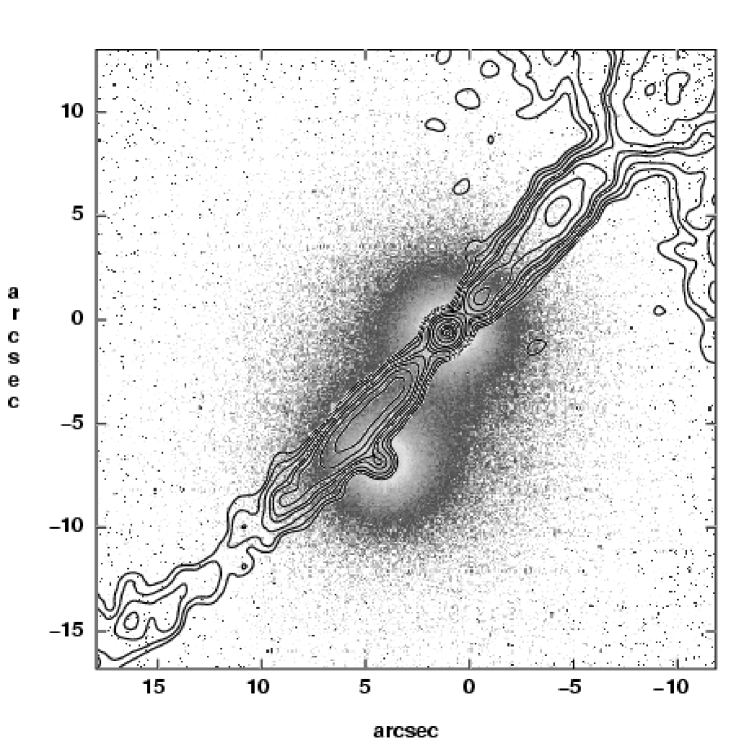
3.4 Radio cores
The VLA images at maximum resolution combined with the optical Hubble Space Telescope (HST) image of NGC326 (Capetti et al. 2000) show that also the secondary nucleus of the dumbbell hosts a radio core (see Fig. 9). According to the convention adopted by Werner et al. (1999) for the optical cores, hereafter we refer to the two radio cores as ‘core 1’ (the radio galaxy) and ‘core 2’ (the companion galaxy). We measure an angular distance between the two radio cores of 71 which corresponds to a projected separation of 4.8 kpc. The luminosity of core 1 is typical for a radio galaxy of this total power at 1.4 GHz (Feretti et al. (1984)). Core 2 is an order of magnitude fainter and, at the sensitivity limits of our observations, does not posses radio jets on kpc scale.

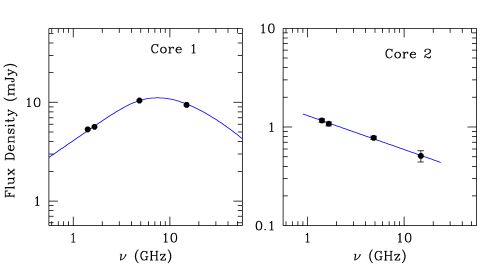
The radio spectra of the two cores between 1.4 and 14.9 GHz are shown in Fig. 11. Core 1 has a convex radio spectrum which peaks at about 10 GHz. Core 2 has a powerlaw radio spectrum with an index of 0.3.
Table 6 summarizes the parameters of the two cores derived from the images at 12 resolution.
4 Collimation and surface brightness of the jets
We analyzed the evolution of jet collimation and surface brightness as a function of the distance from core.
| core 1 | core 2 | |
| 1.4 GHz position ( | 00h58m226 | 00h58m229 |
| 1.4 GHz position ( | +26°51′587 | +26°51′527 |
| (mJy) | ||
| (mJy) | ||
| -0.5 | 0.3 | |
| (WHz-1) | ||
| (WHz-1) |
In order to quantify the variations of surface brightness and width along the jets, we produced intensity profiles perpendicular to the jet axis for distances up to 40″ and 20″ from the core, for the east and west jet, respectively. After having removed the baseline, the transverse brightness profiles are well fitted by a simple Gaussian over most of the jet length.
We used both the 2″ and 12 resolution images at 20 cm. We measured the peak surface brightness and FWHM and derived the deconvolved values and by the first-order corrections:
(Killeen, Bicknell & Ekers 1986) where is the FWHM of the restoring beam. Fig. 12 displays the variation of and as function of distance along the jets. The steps of the transverse cuts are 1″ and 0.6″ in the 2″ and 12 resolution images, respectively. The error bars represent the formal 1- confidence interval given by the fitting procedure and do not include the uncertainty introduced by the baseline subtraction.

Apart for the initial region (12″), where the jets are quite symmetric (see below), the dependence of and on are very different for the east and the west jet. The east jet spreads gradually up to 40″ from the core, but has local regions that deviate significantly from the mean. Its deconvolved surface brightness drops by an order of magnitude in going from the core to a distance of 15″. Then, after a local knot of emission at 20″, decreases slowly for the remaining 20″. On the contrary, the west jet expands abruptly at 12″ from the core. Its deconvolved brightness initially decreases to a local minimum at 12″ and then raises again peaking at 14″. Beyond this peak the jet decollimates originating the shell-like structure.
The east/west width ratio within 12″ from the core has
a mean value of 0.98 and a range from 0.7 to 1.4. The surface brightness
ratio has a mean value of 1.2 and a range from 0.49, at 24 from the
core, to 2, at 42 from the core. The overall jet symmetry
for 12″ suggests that the jet axes, at least at their base,
lie in the plane of the sky. The asymmetry observed at larger distances
may be due to strong projection effects and/or differences in the
density of the gas surrounding the source.
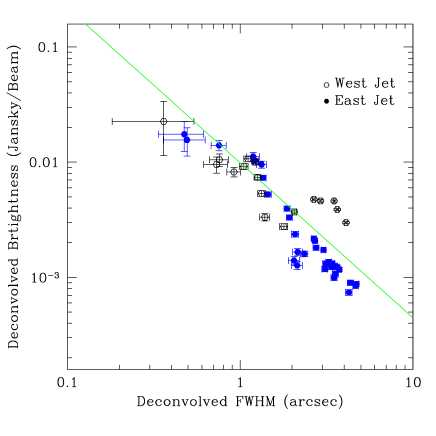
Both jets exhibit an average flat relation (, see Fig. 13). This behaviour indicates either that they depart significantly from the assumption of adiabatic flow, or they must be subject to a rapid longitudinal deceleration (Fanti et al. 1982). For example, for a jet with no longitudinal component of magnetic field and a spectral index of 0.6 the adiabatic condition implies , where is the jet velocity; in this case the required deceleration would be .
5 Physical parameters of the source
Using the “minimum energy assumption”, we calculated with standard formulae (Pacholczyk (1970)) the equipartition internal energy (), the energy density () and the magnetic field () for the jets and the extended components. We also calculated the equipartition pressure . We assumed a volume filling factor of unity, equal energy in relativistic electrons and protons and a radio spectrum ranging from 10 MHz to 100 GHz with a spectral index of 0.6.
5.1 Lobes and wings
We assumed an ellipsoidal geometry for the lobes and a cylindrical geometry for the wings. Sizes for lobes and wings are those reported in Table 5. The global minimum energy parameters are listed in Table 7. We further calculated the variation of the equipartion parameters in ten regions in the wings (see Table 8 and Fig. 14). Worrall & Birkinshaw (2000) reported, for the cluster surrounding NGC326, a core radius of kpc and a pressure ranging from dyne cm-3 to dyne cm-3 at 100 kpc from the source.
| umin | Peq | Beq | ||
|---|---|---|---|---|
| erg | erg/cm3 | dyne/cm2 | G | |
| N-Lobe | 10.0 | |||
| S-Lobe | 7.4 | |||
| W-Wing | 3.9 | |||
| E-Wing | 4.7 |
| distance | umin | Peq | Beq |
| arcsec | erg/cm3 | dyne/cm2 | G |
| West Wing | |||
| 26 | 5.0 | ||
| 36 | 4.3 | ||
| 43 | 3.0 | ||
| 53 | 2.8 | ||
| 62 | 2.8 | ||
| 72 | 2.8 | ||
| 83 | 3.0 | ||
| 93 | 2.9 | ||
| 103 | 2.9 | ||
| 113 | 4.4 | ||
| East Wing | |||
| 16 | 5.9 | ||
| 28 | 6.2 | ||
| 38 | 6.2 | ||
| 45 | 4.9 | ||
| 53 | 4.7 | ||
| 63 | 4.6 | ||
| 73 | 4.2 | ||
| 82 | 3.6 | ||
| 93 | 3.6 | ||
| 103 | 4.1 |
Therefore the inner radio lobes appear to be close to the pressure of the external gas while the wings appear to be under-pressured by a factor of 10.
5.2 Jets
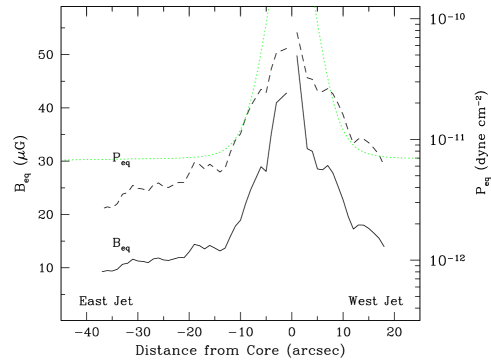
We computed the minimum energy magnetic field and pressure in the jets using the deconvolved FWHM, , and surface brightness, , as derived in Sec. 4. We assumed for each segment of the jet a cylindrical shape with a cross section and length of arcsec2 and 1 arcsec, respectively. The minimum energy magnetic field varies from 40 to 9 going from the core outwards. The equipartition pressure varies from to dyne/cm2 (see Fig. 15).
From the X-ray luminosity reported by Worrall et al. (1995) for the hot galactic corona (i.e. erg/sec), we computed the expected external pressure on the jets. We assumed for the corona a temperature of 1 keV and a gas density profile , where is the central density while and are the distance from the galaxy and the corona core radius, respectively. We found that the jets are roughly in pressure equilibrium with the surrounding gas (see Fig. 15) for a corona core radius kpc and ; in this case the central density results cm-3. A model with kpc, and cm-3 gives an equivalent result.

6 Summary
We have presented multi-frequency data of the radio galaxy NGC326, together with previously published data that were re-analyzed for the purpose of this work. These data allowed us to investigate the source morphology at different levels of spatial resolutions.
The source structure is complex at all resolutions and may be dominated by projection effects.
At the lowest resolution the twin wings appear fairly symmetric but the ‘Z’-shape is disturbed by a plume of low surface brightness and very steep spectral index (). The plume overlap, in projection, a possible fast-moving member of the galaxy cluster.
At the intermediate resolution of about 4″ the source lobes appear asymmetric in shape, size, brightness and projected distance from the core. No compact components (hostspots) are present in the lobes.
At higher resolution, the jets are very symmetric in both flux density and width within the inner 12″ from the core. This indicates that the axis of the jets, at least at their base, lies on the plane of the sky. Beyond this distance, the east jet bends gradually with a curvature radius of about 70″ reaching the south lobe. The west jet is straight but, after recollimation expands abruptly, giving rise to a shell-like structure embedded in the north lobe.
Overlapping our highest resolution VLA images of the core region with the HST image of the dumbbell, we found that also the companion of the radio galaxy hosts a radio core.
NGC326 is significantly polarized at all frequencies and
resolutions. The magnetic field configuration is circumferential in the
lobes and highly aligned with the ridge of emission in the wings.
We traced the profile of the spectral index between 1.4 and 8.5 GHz for the entire wing length. The spectral index increases gradually going from the regions in proximity of the lobes to the wing ends. The spectral index distribution in the lobes is complicated, presumably due to the mixing with the wings. Both jets show a constant spectral index profile with a mean value of 0.6.
Finally, we computed the minimum energy, magnetic field and pressure in wings, lobes and jets. We found that the lobes are close to equilibrium with the external gas pressure while the wings are under-pressured by a factor of 10.
These observations allow us to investigate in detail the spectral and polarizarion properties of this peculiar object at different levels of spatial resolution and constitute an excellent data set which permits testing the “standard” theory of the synchrotron aging analysis.
The interpretation of the data will be discussed in papers II and III.
Acknowledgements.
The National Radio Astronomy Observatory is operated by Associated Universities, Inc., under contract with National Science Foundation.References
- Baars et al. (1997) Baars, J. W. M., Gendel, R., Pauliny-Toth, I. I. K., Witzel, A., 1977 A&A 61, 99
- Battistini et al. (1980) Battistini, P., Bonoli, F., Silvestro, S., Fanti R., Gioia, I. M., and Giovannini, G., 1980, A&A 85, 101
- Blandford & Icke (1978) Blandford, R. D., & Icke, V., 1978, MNRAS, 185, 527
- Capetti et al. (2000) Capetti, A., de Ruiter, H. R. , Fanti, R., Morganti, R., Parma, P., Ulrich, M.-H., 2000, A&A 362, 871
- Colla et al. (1975) Colla, G., Fanti, C., Fanti, R., Gioia, I., Lari, C., Lequeux, J., Lucas, R., Ulrich, M. H., 1975, A&AS 20, 1
- Davoust & Considère (1995) Davoust, E., & Considère, S., 1995, A&AS, 110, 19
- Ekers et al. (1978) Ekers, R. D., Fanti, R., Lari, C., Parma, P., 1978 Nature, 276, 588
- Ekers (1982) Ekers, R. D., 1982 in Extragalactic Radio Sources, Proceeding of IAU Symposium No. 97, 465
- Fanti et al. (1977) Fanti, C. Fanti, R., Gioia , I. M., Lari, C., Parma, P., Ulrich, M. H., 1977, A&AS 29, 279
- Fanti et al. (1982) Fanti, R., Lari, C., Parma P., Bridle, A. H., Ekers, R. D., Fomalont, E. B., 1982, A&A 100, 169
- Feretti et al. (1984) Feretti L., Giovannini G., Gregorini L., Parma P., Zamorani G., 1984, A&A, 139, 55
- Fomalont (1981) Fomalont, E. B., 1981 in Origin of Cosmic Rays ed. Setti, G., Spada, G., and Wolfendale, A. W., (Reidel, Boston), p. 111
- Killeen et. al (1986) Killeen, N. E. B., Bicknell, G. V., Ekers, R. D., 1986, ApJ, 302, 306
- Murgia (2001) Murgia M., 2001, Ph.D. Thesis, University of Bologna
- Pacholczyk (1970) Pacholczyk A.G., 1970, ‘Radio Astrophysics’, Freeman & Co., San Francisco
- Parma et al. (1991) Parma, P., Cameron, R. A., and de Ruiter, H. R., 1991, AJ 102, 1960
- Rees (1978) Rees, M. J., 1978, Nature 275, 516
- Sargent (1973) Sargent, W. L. W., 1973, Astrophys.J. Lett. 182, L13
- Simard-Normandin et al. (1981) Simard-Normandin M., Kronberg P. P., Button S., 1981, ApJS, 45, 97S
- Wirth et al. (1982) Wirth, A., Smarr, L., Gallagher, J. S., 1982, AJ 87, 602
- Werner et al. (1999) Werner, D. M., Worrall, D. M., and Birkinshaw, M., 1999, MNRAS 307, 722
- Worrall et al. (1995) Worrall, D. M., Birkinshaw, M., Cameron , R. A., 1995, ApJ 449, 93
- Worrall & Birkinshaw (2000) Worrall, D. M., & Birkinshaw, M., 2000, ApJ 530, 719