Cluster cores as observed with Chandra
Abstract
We review recent results from Chandra observations of the X-ray bright cores of clusters of galaxies. We discuss the detection of “cold fronts” and their implication for thermal conduction, the interaction of cooling flow and radio source in the Perseus cluster and the dynamical state of the central region of A1795. The radial distribution of metals in A1795 and the azimuthal variation in metallicity in 4C+55.16 are presented.
Institute of Astronomy, Madingley Road, CB3 0HA Cambridge
1. Introduction
At radii of few hundred kpc, the intracluster medium (ICM) has a characteristic density cm-3, temperature K and a heavy element abundance of about 40 per cent of the solar value. The density drops at larger radii approximately as . Hence, under these conditions, the gas appears as an optically thin plasma in ionization equilibrium emitting X-rays, where the ionization and emission processes result mainly from collisions of ions with electrons. This emission is mostly due to thermal bremsstrahlung (free-free emission) when K, with an emissivity . In the core, where the density is higher, a larger amount of energy is radiated away and cooling takes place on timescale
| (1) |
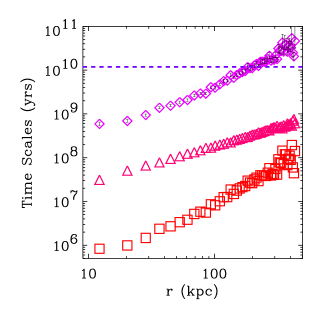
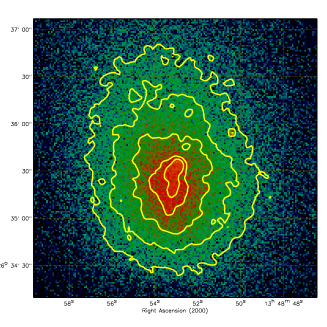
This inequality is satisfied in the core of about 70 per cent of nearby clusters (Peres et al. 1998), like A1795 (Fig. 1). The drops in temperature and the small cooling time suggest that a subsonic flow of gas moves inward in the hydrostatic core atmosphere under the influence of gravity and the weight of overlying plasma (see Fabian 1994 for a review on this cooling flow scenario). The inferred deposition rates range from 10 yr-1 in poor clusters to 1000 yr-1 in massive systems. However, only 10 per cent of these cooling rates can be accounted for from normal star formation (see Crawford et al. 1999 and references therein).

Here we review some recent results from Chandra observations of the cluster central regions on (i) the physical condition of the plasma and (ii) how the metals are distributed and the gas enrichment is produced.
2. Cold fronts and thermal conduction in cluster cores
The Chandra observations of “cold fronts” in some clusters (e.g. A2142, Markevitch et al 2000; A3667, Vikhlinin, Markevitch, & Murray 2001; RXJ1720+2638, Mazzotta et al. 2001), where regions of plasma with differences in temperature by a factor of 2 lie ones close to each other, allow a direct constraint on the efficiency of the thermal conduction (Ettori & Fabian 2000).
The heat stored in the intracluster plasma is conducted down any temperature gradient present in the gas in a way that can be described through the following equations (Spitzer 1962, Sarazin 1988):
| (2) |
where is the heat flux, is the electron temperature, and is the thermal conductivity that can be expressed in term of the density, , the electron mass, , and the electron mean free path, kpc, as (Cowie and McKee 1977) erg s-1 cm-1 keV-1.
The maximum heat flux in a plasma is given by , where is a characteristic velocity that we are now able to constrain equalizing the latter equation to eqn. 2.
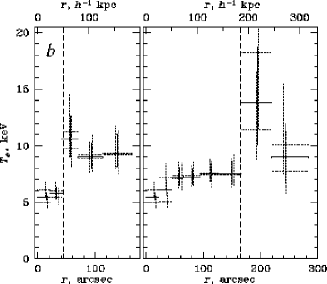
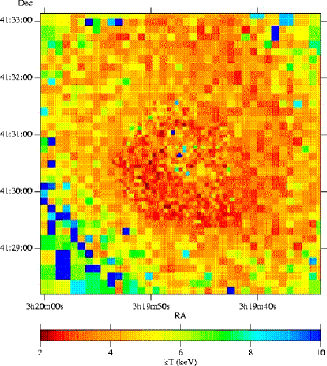
From the observed plasma properties in A2142 (Fig. 2), we note that the temperature varies by a factor of 2 on a scale length of about 10–15 kpc. These value imply that the characteristic time, , required to erase the electron temperature gradient and due to the action of the thermal conduction alone would be few times years. When this time interval is compared with either the core crossing time of the interacting clumps of about 109 yrs or a dynamical timescale of about yrs from the model suggested by Markevitch et al., we conclude that thermal conduction needs to be suppressed by a factor larger than 10 and with a minimum characteristic value enclosed between 250 and 2500. The frequency of the occurance of similar structures in other cluster cores will be important in establishing the timescale for their formation and duration and, hence, improve the constraint on the thermal conduction in the intracluster plasma.
This result is a direct measurement of a physical process in the ICM and implies that thermal conduction is particularly inefficient within 280 kpc of the central core. The observed sharp temperature boundaries also mean that mixing and diffusion are minimal. The gas in the central regions of many clusters has a cooling time lower than the overall age of the system, so that a slow flow of hotter plasma moves here from the outer parts to maintain hydrostatic equilibrium. In such a cooling flow (e.g. Fabian 1994), several phases of the gas (i.e. with different temperatures and densities) are in equilibrium and would thermalize if the conduction time were short. The large suppression of plasma conductivity in the cluster core allows an inhomogeneous, multi–phase cooling flow to form and be maintained, as is found from spatial and spectral X-ray analyses of many clusters (e.g. Allen et al. 2001).
3. Interaction of radio source and cooling flow in the Perseus cluster
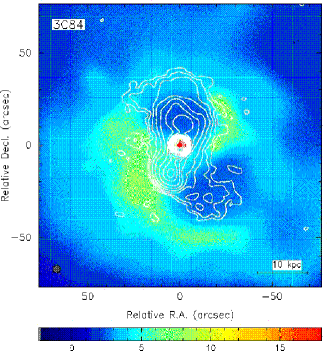
The Perseus cluster (Abell 426) at a redshift of 0.0183 is the brightest cluster in the X-ray sky. A radio source, 3C84, is powered at the centre of the central galaxy, NGC1275 (Fig. 3). The Chandra X-ray observatory observed its core for about 24 ksec (Fabian et al. 2000). X-ray colours can be obtained to reconstruct the temperature and absorption maps. The temperature map (Fig. 3) shows that the gas is cooler towards the centre and, in particular, the coolest one lies along the rims of the inner radio lobes. From the surface brightness we can obtain the gas density and, thus, radiative cooling time that appears shortest in the very central regions. There is no evidence for heating due to the radio source beyond the lobes, that are probably cleared of cooler gas. No sign of strong shocks is present.
4. Dynamical state of the core of A1795
Abell 1795 is a nearby () rich cD galaxy cluster well studied at optical, radio and X-ray wavelenghts. It has been observed for 18.4+19.4 ksec from Chandra (Fabian et al. 2001b, Ettori et al. 2001; Fig. 4).

To constrain the physical quantities of the ICM, we apply the deprojection analysis, assuming that the X-ray is spherically symmetric and the plasma is in hydrostatic equilibrium with the underlying gravitational potential (cf. Fig. 1). In our spectral analysis, we are able to resolve in 5 radial bins the gas temperature profile in the inner 100 kpc radius with a relative uncertainty less than 5 (10) per cent for the projected (deprojected) temperature. The electron density is estimated from the spectral best-fit results. Then, we apply directly the equation of hydrostatic equilibrium between the gravitational potential and the intracluster plasma to estimate the mass profile, (Fig. 5).
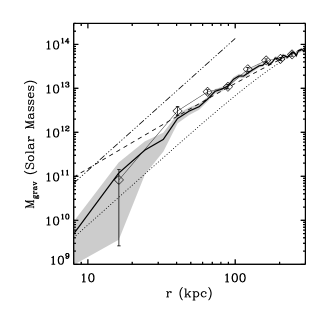

In particular, we can investigate the slope of a power law expression of the dark matter profile, , that is a proper approximation for the inner part of the cluster potential, integrating it over the volume () and fitting the obtained mass profile to the one observed (Fig. 5) between 10 and 100 kpc, where the discrepancy among the different models is more significant. We measure (1 ; in the range 0.27–0.81 at the 90 per cent confidence level), that indicates a remarkable flat profile suggesting the presence of a core.
The surface brightness distribution (Fig. 4) suggests that the intracluster medium has an unrelaxed nature that might introduce a kinetic pressure component in the hydrostatic equilibrium equation so raising the total effective mass in the central core. This could possibly explain the flattening of the gravitating mass profile. Assuming that underlying potential is described from the potential in Navarro et al. (1997) and is the difference with respect to the observed mass estimates, a bulk motion with velocity (assumed independent from radial position) of 300 km s-1 is required from the equation . This value is lower than the gas sound speed of about 800 km s-1 and definitely subsonic. The shape of the gravitational potential is also consistent with the detected motion of the cD galaxy. Oegerle & Hill (1994) measure a cD velocity redshifted relative to the cluster of 150 km s-1. The emission-line velocity map in Hu, Cowie, & Wang (1985) shows that the H/X-ray filament has the same velocity of the cluster and is blueshifted from the cD velocity by still 150 km s-1. In Fig. 5, the cD velocity is estimated as , where is the gravitational constant and is the total gravitating mass within the radius . Fixing the gravitational mass at = 100 kpc, we can change the power law index and investigate the behaviour of the cD velocity. A cD velocity larger than 400 km s-1 is required for potential well described by a dark matter density profile steeper than . Given the observed velocity offset along the line of sight, the presence of a density profile flatter than a NFW profile is then required.
4.1. Cooling gas in A1795
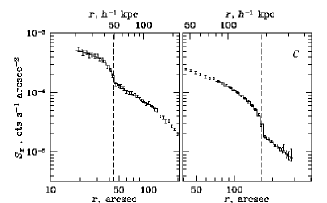
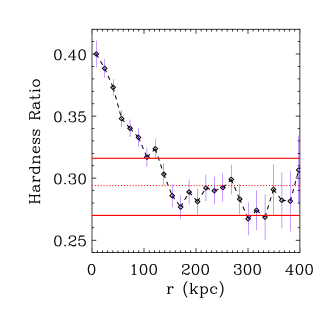
The gas in the core of A1795 would cool radiatively in about years (3.8 yrs in the central 10 kpc radius, with 10th and 90th percentile of 3.2 and 4.4 yrs, respectively), approaching the estimated age of the Universe at the cluster redshift of years at about 200 kpc (Fig. 6). This can be considered as an upper limit on the region where strong cooling is taking place. In particular, the physical extension of the central region where a X-ray soft component dominates the emission can be obtained from the flattening at about 100 kpc of the X-ray colour profile shown in Fig. 6.
The deviation between the spatial and spectral results on the profile, apart from the central 2 bins where the assumed spherical geometry is probably inappropriate given the observed cooling wake, is due to limitations on the validity of the steady–state cooling flow model. The dynamical scenario, in which cooling flows establish and evolve, considers merging with infalling substructures that interrupt the subsonic flow of material.
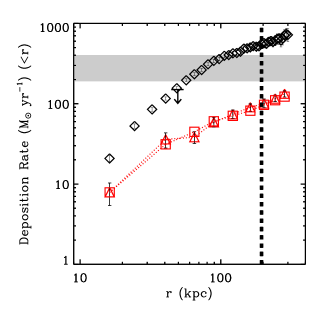
Recent analysis of Newton-XMM data of A1795 (Tamura et al. 2001) does not show detectable emission from gas cooling below 1–2 keV. Our lower limit from the deprojection of the best-fit gas temperature in the central 20 kpc radius is 1.8 keV at 90 per cent confidence level. When an isobaric cooling flow component is considered to model the Newton-XMM Reflection Grating Spectrometers (RGS) spectra of the central 30′′radius region, an upper limit (90% level of confidence) of 150 yr-1 is obtained (Tamura et al. 2001). This value is larger than our value of 43 yr-1 (90% limit of 56 yr-1) measured within the same region of 30 arcsec from the X-ray centre. The Chandra -determined cooling flow therefore appears to be consistent with the present Newton-XMM RGS constraint. Within the central 200 kpc, we estimate of about 100 yr-1 ( 121 yr-1 at 90% c.l.). In the model that we adopt, the cool emission is suppressed with an intrinsic absorption of about 3 particle cm-2. If we use the same model that describes the RGS spectra, fixing the outer thermal component to 6.4 keV and the Galactic column density to 3 cm-2, and not including any intrinsic absorption, we measure a normalization for the cooling flow component of 85 yr-1 (90% confidence limit range of 76–92 yr-1) but we obtain a considerably worst . The intrinsic absorption can be interpreted as one method to suppress the line emission from gas below 1.5 keV. Other methods and related issues are discussed by Peterson et al. (2001) and Fabian et al. (2001a). More discussion on the deposition rate in A1795 is presented in Ettori et al. (2001).
5. The metals distribution in the cluster cores
The X-ray emitting plasma is about 5 times more luminous than the stars in galaxies and, thus, is the major reserve of both baryons and heavy metals contained in galaxy clusters, since the Iron abundance is typically between 0.3 and 0.5 times the solar value. Studies on the correlation between Fe mass and light coming from E and S0 galaxies (Arnaud et al. 1992, Renzini 1997) conclude that larger amount of iron resides in the intracluster medium than inside galaxies and its enrichment originated through releases from early-type galaxies. The processes that preferably enrich the plasma are (i) (proto)galactic winds (De Young 1978), that occur at early times and are characterized from supernova (SN) type II ejecta with large abundance of elements, and (ii) ram pressure stripping (Gunn & Gott 1972), that takes place on longer time scales due to the continuous accretion of fields galaxies in the cluster potential well and produces mostly SN Ia ejecta. What discriminates between these two main processes is the different elemental mass yields: SN Ia ejecta tend to be rich in Ni, whereas SN II ejecta present larger ratio between elements (e.g., O, Mg, Ar, Ca, S, Si) and Fe. Recent evidence of iron gradients in cluster cores with decreasing ratio between elements and Fe moving inward suggest that, while the global intracluster metal abundances are consistent with SN II ejecta (Mushotzky & Loewenstein 1997), SN Ia productions are dominant in the central cluster regions (e.g Finoguenov, David & Ponman 2000, Dupke & Arnaud 2001).
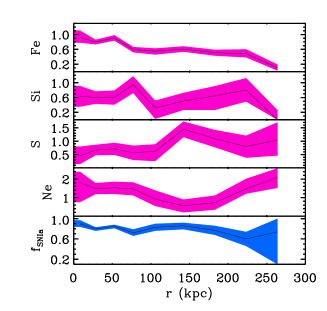
We have investigated the metals distribution in A1795. The radial profiles of the resolved element abundances and the fraction of SNIa, , responsible for those profiles are plotted in Fig. 7. The fraction in number of the SNe Ia is above 60 per cent in the inner 200 kpc. The amount of the total iron produced in SNIa is then in the central 200 kpc (here we assume a contribution of 0.74 of iron from SN Type Ia, 0.12 from SN Type II and a conversion factor of 3.5 between numbers of Type II and Type Ia). This star formation activity releases energy during supernova explosions providing an amount of thermal energy per gas particle, , where erg is the kinetic energy released by one SN, is the efficiency of this kinetic energy in heating the ICM through galactic winds. When typical values for the inner part of A1795 are adopted, keV, i.e. only about 8 per cent of the thermal energy per particle measured (cf. Fig. 1).
6. Conclusions
The Chandra observatory is providing measurements on arcsec scale (tens of kpc for nearby objects) of the plasma temperature and metals abundance with relative uncertainties of about 10 per cent.
The gas temperature profile raises with radius up to the cooling radius and then remains constant and equal to the virial value, , within few hundred kpc. Therefore, two temperatures, at least, are individuated in the cluster plasma, and in the very central region. Sharp jumps in the temperature/density distributions are seen in many cluster cores, suggesting that the thermal conduction is suppressed and the ICM is inhomogeneous.
There is not evidence for gas cooling below 1–2 keV. If strong shocks in cores are responsible for heating the gas and stopping and/or reducing the cooling flow, then almost 10 per cent of the observed cooling flow clusters should show evidence of this activity (cf. David et al. 2001). No detection of strong shocks has been obtained up to now (cf. also the Perseus case). Peterson et al. (2001) and Fabian et al. (2001) discuss more in depth the problems concerning to the cooling flow scenario after Newton-XMM and Chandra observations.
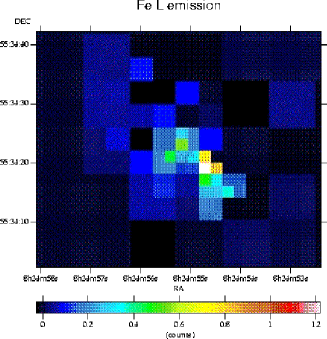
Finally, the cores of cooling flow clusters show hints of a positive gradient within 20–40 kpc (see Glenn Morris’s contribution in this volume) and negative outward in the azimuthally averaged radial distribution of the metals. However, strong azimuthal variations are observed (e.g. in the core of the cluster around 4C+55.16, Iwasawa et al. 2001; Fig. 7). SuperNovae type Ia appear to be dominant in the enrichment process of these regions.
References
Allen S.W. et al. 2001, MNRAS, 322, 589
Arnaud M. et al. 1992, A&A, 254, 49
Binney, J., & Cowie, L.L., 1981, ApJ, 247, 464
Cavaliere A. & Fusco-Femiano R., 1978, A&A, 70, 677
Crawford C.S. et al. 1999, MNRAS, 306, 875
Cowie L.L., & McKee C.F., 1977, ApJ, 211, 135
David L.P. et al. 2001, ApJ, in press (astro-ph/0010224)
De Young D., 1978, ApJ, 223, 47
Dupke R.A. & Arnaud K.A., 2001, ApJ, 548, 141
Ettori S., & Fabian A.C., 1999, MNRAS, 305, 834
Ettori S., & Fabian A.C., 2000, MNRAS, 317, L57
Ettori S. et al., 2001, MNRAS, submitted
Fabian A.C., 1994, ARAA, 32, 277
Fabian A.C. et al. 2000, MNRAS, 318, L65
Fabian A.C. et al. 2001a, MNRAS, 321, L20
Fabian A.C. et al. 2001b, MNRAS, 321, L33
Finoguenov A., David L.P., Ponman T.J., 2000, ApJ, 544, 188
Grevesse N. & Sauval A.J. 1998, Space Sci.Rev., 85, 161
Gunn J.E., & Gott III J.R., 1972, ApJ, 176, 1
Hu E.M., Cowie L.L., & Wang Z., 1985, ApJS, 59, 447
Iwasawa K. et al. 2001, MNRAS, in press (astro-ph/0110216)
Markevitch M., 1996, ApJ, 465, L1
Markevitch M. et al., 2000, ApJ, 541, 542
Mazzotta P. et al., 2001, ApJ, in press (astro-ph/0102291)
Mushotzky R.F., & Loewenstein M., 1997, ApJ, 481, L63
Navarro J.F., Frenk C.S., & White S.D.M., 1997, ApJ, 490, 493
Oegerle, W.R., & Hill, J.M., 1994, AJ, 107, 857
Peres C.B. et al., 1998, MNRAS, 298, 416
Peterson J.R. et al., 2001, A&A, 365, L104
Renzini A. 1997, ApJ, 488, 35
Sarazin, C.L., 1988, X-ray emission from clusters of galaxies, CUP
Spitzer, L., 1962, Physics of Fully Ionized Gases J. Wiley & sons
Tamura T. et al., 2001, A&A, 365, L87
Vikhlinin A., Markevitch M., & Murray S.S. 2001, ApJ, 551, 160