Optical Identification of Multiple Faint X-ray Sources in the Globular Cluster NGC 6752: Evidence for Numerous Cataclysmic Variables1
Abstract
We report on the Chandra X-ray Observatory ACIS-S3 imaging observation of the globular cluster NGC 6752. We detect 6 X-ray sources within the 105 core radius and 13 more within the 115″ half-mass radius down to a limiting luminosity of erg s-1 for cluster sources. We reanalyze archival data from the Hubble Space Telescope and the Australia Telescope Compact Array and make 12 optical identifications and one radio identification. Based on X-ray and optical properties of the identifications, we find 10 likely cataclysmic variables (CVs), 1–3 likely RS CVn or BY Dra systems, and 1 or 2 possible background objects. Of the 7 sources for which no optical identifications were made, we expect that 2–4 are background objects and that the rest are either CVs or some or all of the five millisecond pulsars whose radio positions are not yet accurately known. These and other Chandra results on globular clusters indicate that the dozens of CVs per cluster expected by theoretical arguments are being found. The findings to date also suggest that the ratio of CVs to other types of X-ray sources is remarkably similar in clusters of very different structural parameters.
Accepted by the Astrophysical Journal
1 Introduction
Globular clusters are very efficient catalysts in forming unusual objects, such as low-mass X-ray binaries (LMXBs), cataclysmic variables (CVs), millisecond pulsars (MSPs), and blue stragglers, with formation rates per unit mass exceeding those in the galactic disk by orders of magnitude. The high stellar densities in globular clusters trigger various dynamical interactions: exchanges in encounters with binaries, direct collisions, destruction of binaries, and perhaps tidal capture. Many details of these processes are not well understood, primarily because of the complex feedback between stellar evolution and stellar dynamics. The rate of these competing processes depends strongly on the cluster’s physical properties. For example, binary formation by tidal capture generally requires higher densities than do exchange reactions involving primordial binaries (Hut et al., 1992). In the outermost regions of even the densest clusters, the currently observed binaries will be mainly primordial ones. In contrast, the LMXBs and the MSPs that consequently evolve from the LMXBs are formed (almost) exclusively via stellar encounters. Davies & Hansen (1998) have shown how the large number of binary radio pulsars that are present in 47 Tuc (Camilo et al., 2000; Freire et al., 2001) may have been formed from an initial population of some primordial binaries and 104 neutron stars.
To date, there are thirteen known bright ( erg s-1) X-ray sources in 12 globular clusters. The X-ray spectra and luminosities indicate that these are LMXBs; orbital periods from 11 minutes to 17.1 hours have been determined for five sources. In 11 sources, type I X-ray bursts have been detected (in ’t Zand et al. 1999 and references therein), which are well explained as thermonuclear runaways on a neutron star surface (for a review see Lewin, van Paradijs, & Taam 1993). Optical counterparts have been found for six bright sources (Deutsch et al., 1998; Heinke, Edmonds, & Grindlay, 2001; Homer et al., 2001a, and references therein).
With the Einstein satellite, seven faint ( erg s-1) sources were detected in the cores of as many clusters (Hertz & Grindlay, 1983a, b). With ROSAT, the number of faint core sources (within two core radii of the centers) expanded to 40, including multiple sources in 47 Tuc, Cen, NGC 6397, NGC 6752 and others; an additional 17 faint sources were found farther out in the clusters (more than two core radii from the centers). Whereas virtually all of the core sources are related to the globular clusters, some of the sources outside the cores may be in the background or foreground (Verbunt, 2001, and references therein). Due to crowding and the limited accuracy of even the ROSAT positions (varying from 2–5″, depending on whether a secure optical identification allows accurate determination of the bore sight correction), optical identifications of faint X-ray sources in globular cluster cores remained tentative before the Chandra era, and some suggestions have been disproved with more accurate X-ray positions, as in 47 Tuc (Verbunt & Hasinger, 1998) and M 92 (Geffert, 1998; Verbunt, 2001). The only secure optical identification was that of a dwarf nova with a faint X-ray source 12 core radii from the center of NGC 5904 (Hakala et al., 1997; Margon, Downes, & Gunn, 1981). The radio pulsar in M 28 is another securely identified faint X-ray source (Lyne et al., 1987; Saito et al., 1997). Some identifications, like those in M 13, remain in doubt (Verbunt, 2001).
Progress in identifying the nature of the various faint X-ray sources has been very slow during the past two decades. However, this is now rapidly changing. With Chandra’s high sensitivity and unprecedented spatial resolution of 1″, a revolution is underway in our understanding of the low-luminosity globular cluster X-ray sources and their association with the binary populations of globular clusters. To date, some results have already been reported for a 74 ks observation of 47 Tuc (Grindlay et al., 2001a), a 70 ksec observation of Cen (Rutledge et al., 2001a), a 49 ks observation of NGC 6397 (Grindlay et al., 2001b), and preliminary results have been reported for our own observations of NGC 6752, NGC 6440 and NGC 6121 (Pooley et al., 2000). The Chandra observations have confirmed previously suggested optical counterparts for faint X-ray sources in the cores of these clusters and made numerous additional identifications. We report here in more detail on the results of a 30 ks observation of NGC 6752. In the discussion section we will compare our results with those reported earlier.
NGC 6752 is at a distance of kpc (Renzini et al., 1996). The optically derived center is at (J2000) (Harris, 1996). Its moderate optical reddening may be converted to a nominal X-ray absorption column characterized by cm-2 using the relation found by Predehl & Schmitt (1995). Its core radius is 105, and its half-mass radius is 115″ (Trager, Djorgovski, & King, 1993). We use these values throughout the paper.
Faint X-ray sources in NGC 6752 were first found by Grindlay (1993) on the basis of a 31.3 ks ROSAT HRI exposure, which revealed a double source in the core and two sources outside the core but within the half-mass radius. These sources were also detected with the ROSAT PSPC (Johnston, Verbunt, & Hasinger, 1994). Verbunt & Johnston (2000) co-added three ROSAT HRI observations for a total exposure of 72 ks and identified an X-ray source with the non-cluster member star TYC 9071 228 1, allowing an accurate solution of the bore sight correction and therewith an accurate () absolute positioning of the X-ray frame. They also resolved the central source into four sources and argued on the basis of the source density in the whole ROSAT image that the other sources within the half-mass radius were possibly related to the cluster. The best position for the northernmost ROSAT source in the core is marginally compatible with the previously published position of the southern of two H emission objects and photometric variables with periods of 5.1 hr and 3.7 hr discovered with Hubble Space Telescope (HST) observations by Bailyn et al. (1996).
2 X-ray Observations
NGC 6752 was observed with the Chandra X-ray Observatory (Weisskopf, O’Dell, & van Speybroeck, 1996) for 30 ks on 2000 May 15. The observation was made with the Advanced CCD Imaging Spectrometer (ACIS) with the telescope aimpoint on the back-side illuminated S3 chip, which offers increased sensitivity to low-energy X-rays compared to the front-side illuminated chips. The entire region inside the cluster’s half-mass radius fit on the 83 square S3 chip. The data were taken in timed-exposure mode with the standard integration time of 3.24 sec per frame and telemetered to the ground in faint mode, in which a pixel island is recorded for each event.
2.1 X-ray Data Reduction
Data reduction was performed using the CIAO 2.1 software provided by the Chandra X-ray Center (http://asc.harvard.edu). We used the CALDB v2.6 calibration files (gain maps, quantum efficiency, quantum efficiency uniformity, effective area). Bad pixels were excluded, as were intervals of background flaring (1 ks). The effective exposure time for the observation after filtering for flares and correcting for dead time was 28.7 ks.
Starting with the raw (level 1) event list, we processed the data (using acis_process_events) without including the pixel randomization that is added during standard processing.222This randomization has the effect of removing the artificial substructure (Moiré pattern) that results as a byproduct of spacecraft dither. Since all of our observations contained a substantial number of dither cycles (one dither cycle has a period of 1000 sec), this substructure is effectively washed out, and there is no need to blur the image with pixel randomization. This method slightly improves the point spread function (PSF). We then applied good-time intervals (both the ones supplied with the standard data products and our custom ones which excluded the period of background flaring) and filtered the data to include only events with ASCA grades of 0, 2, 3, 4, or 6 (this is the “standard” choice that generally optimizes the signal-to-background ratio; see the Chandra Proposer’s Observatory Guide available from the website for more information). We also excluded software-flagged cosmic ray events. We used this filtered event list (level 2) for the subsequent analysis.
2.2 X-ray Source Detection
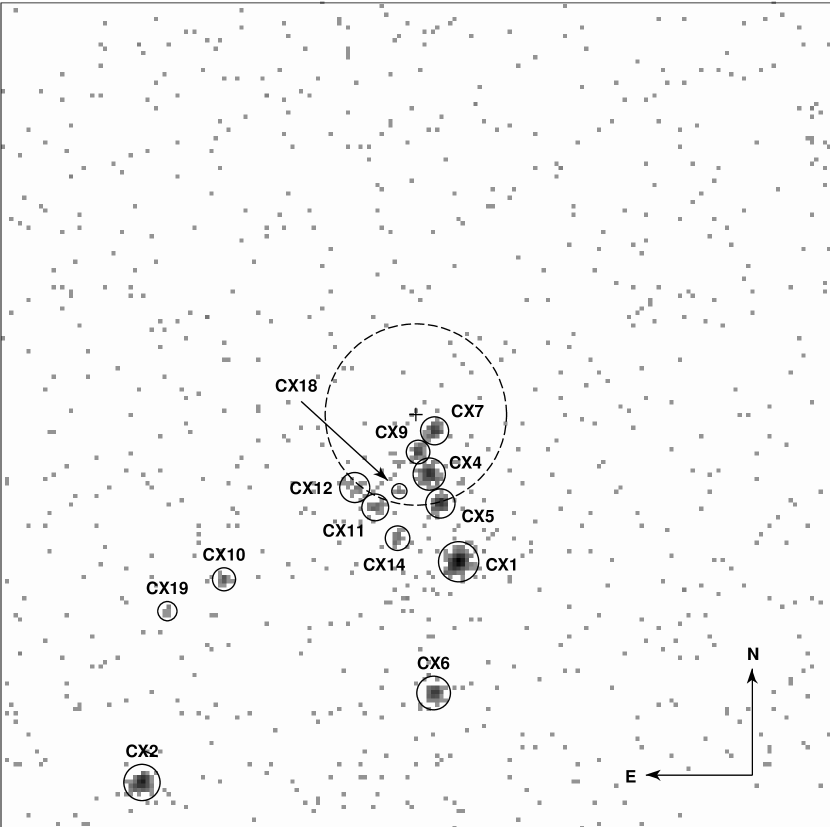
The wavelet-based wavdetect tool was employed for source detection. We found that the detection of sources was insensitive to whether we used a medium-band (0.5–4.5 keV) or full-band (0.3–8.0 keV) image. We detected 19 point sources within the cluster half-mass radius (Table 1) and another 21 on the rest of the S3 chip. We have numbered the sources in order of most counts to least in the 0.5–6.0 keV band. Our detection threshold was 5 counts in the 0.3–8.0 keV image. The absorbed flux of the faintest detected source was erg cm-2 s-1. Using the density of sources outside the half-mass radius, we estimate that about four sources within the half-mass radius are not associated with the cluster, which is in approximate agreement with the relationships of Giacconi et al. (2001). All 19 possible cluster sources are consistent with being point sources, with the possible exception of CX12. Comparing the observed radial surface brightness profile of this source to one predicted for a source of its intensity and at its location on the chip, we find that it is inconsistent with being a single point source at 94% confidence ( for 6 degrees of freedom). It is most likely a blend of multiple sources.
The central 16 portion of NGC 6752 is shown in Fig. 1. Overlaid on this image are the source extraction regions determined by wavdetect, a dashed circle indicating the core radius, and a cross indicating the optical center of the cluster.
2.3 X-ray Count Rates
Source counts were extracted in a variety of energy bands. We found that the most useful data were between 0.5 and 6.0 keV, as this range preserved almost all of the source counts while limiting the background contribution. We focus on the following bands for hardness ratios and the X-ray color-magnitude diagram (CMD): 0.5–1.5 keV (Xsoft), 0.5–4.5 keV (Xmed), and 1.5–6.0 keV (Xhard). While somewhat arbitrary, this choice allows a direct comparison with the results of Grindlay et al. (2001a) on 47 Tuc, which has a similar distance and column density.
The detected count rate was corrected for background, exposure variations, and foreground photoelectric absorption. The background count rate in each band was estimated from an annulus around the innermost sources. The inner radius was 29″, and the outer radius was 70″. No sources were present within the annulus. Because of the spacecraft’s dither, some sources passed in and out of bad columns on the CCD. To account for the 4% variations in exposure that resulted, we applied multiplicative corrections based on the ratio of a source’s average effective area in each of the three bands to the average effective area in the same band of CX15, which had the highest average exposure. The individual effective area curves for the sources were made using the CIAO tool mkarf. The average effective area of CX15 in each of the bands was 591 cm2 (Xsoft), 465 cm2 (Xmed), and 377 cm2 (Xhard).
To correct for the column density to NGC 6752, we used XSPEC (Arnaud, 1996) to examine the effects of absorption on three spectra characteristic of what one might expect to find in a globular cluster: a 3 keV thermal bremsstrahlung (for CVs; Richman 1996; van Teeseling, Beuermann, & Verbunt 1996), a 0.3 keV blackbody (for quiescent LMXBs; Verbunt et al. 1994; Asai et al. 1996, 1998; as substitute for the more correct neutron-star atmosphere models, see Rutledge et al. 2001b and references therein), and a power law with a photon index of (for MSPs; Becker & Trümper 1999). In each of our three bands, we took the ratio of the unabsorbed count rate to one absorbed by a column density of cm-2. Because this is a fairly low column density, the effects were small on each of the three model spectra. We used a simple average of the ratios to derive the following correction factors for the observed count rate in each band: 1.084 (Xsoft), 1.067 (Xmed), and 1.010 (Xhard). Table 1 lists both the observed and fully corrected counts in each band for all 19 sources. The X-ray color-magnitude diagram based on the corrected counts is shown in Fig. 2. Note that the effect on the X-ray color-magnitude diagram of the correction for absorption is a uniform shift of all points 0.03 units up and 0.02 units to the right.

2.4 X-ray Spectral Fitting
We used the CIAO tool dmextract to extract spectra of the brighter sources (CX1–CX9) and dmgroup to group the spectra to a selected number of counts per bin. CX1 was grouped to contain 35 counts per bin, CX2–CX4 were grouped at 15 counts per bin, and CX5–CX9 at 10 counts per bin. Background-subtracted spectral modeling was performed with XSPEC using data in the 0.3–8.0 keV range.
We fit three different models to each of the nine brightest sources (CX1–CX9): thermal bremsstrahlung (TB), blackbody (BB), and power law (PL). For CX1, the column density was allowed to vary and compared to a fixed value of cm-2 for the cluster. For the other sources, however, we found that the data could not constrain well and that all best-fit values were consistent with the column density from optical reddening. We therefore fixed at the optical reddening value for the rest of the sources. The results are listed in Tables 2 and 3.
From the best-fit models, we calculated the unabsorbed source luminosities for CX1–CX9. Averaging the results from the best fits of each of the three models, we arrived at our estimate for the source luminosities listed in Table 1. The major sources of uncertainty in these luminosities arise from the scatter in the luminosities from the three different models and the uncertainties in each individual fit. The combined effect is typically around 20%. The uncertainties in distance (2.4%) and column density (1.7%) are negligible in comparison.
Fitting a linear relation to the CX1–CX9 luminosities vs. the corrected counts in Xmed, we have estimated the unabsorbed luminosities for sources CX10–CX19 based on their Xmed counts. These are also listed in Table 1.
3 Radio Observations
We have analyzed archival radio observations of NGC 6752, carried out on 1995 February 02 using the Australia Telescope Compact Array (ATCA; Frater, Brooks, & Whiteoak 1992). Observations were made simultaneously at 1.4 and 2.4 GHz, and cover the entire Chandra field-of-view. At 1.4 and 2.4 GHz, the resulting spatial resolutions are and with sensitivities of 70 Jy beam-1 and 90 Jy beam-1, respectively (where 1 Jy W m-2 Hz-1).
We find three source coincidences between the X-ray and 1.4-GHz radio images: one point source within NGC 6752’s half-mass radius (CX17), one point source from the cluster center (the corresponding X-ray source falls on chip S4), and some diffuse X-ray emission centered on a bright extended radio source (possibly a head-tail radio galaxy) outside the cluster. At 1.4 GHz the radio counterpart to CX17 has a flux density of mJy; no circular or linear polarization is detected from this source, with a upper limit on the fractional polarization of 35%. At 2.4 GHz this source is marginally detected at the level, with a flux density mJy.
The absolute astrometry of the ATCA data in the International Celestial Reference System (ICRS) is accurate to . Based on the two point-source coincidences, we corrected the Chandra astrometry to align these sources. The correction was () in RA and in Dec.
4 Optical Observations
The HST archive contains a substantial amount (400 exposures) of WFPC2 imaging data covering the central regions of NGC 6752. Of particular utility are the data obtained by Bailyn and collaborators to suggest optical identification for two ROSAT sources in the core, the very ones we have now resolved into multiple Chandra sources. These consist of deep (F656N filter; i.e., 6560Å), (F675W) and (F439W) image sets, plus long time-series in (F555W) and (F814W) covering the core alone (for details see Bailyn et al. 1996), ideal for the identification of H emission and/or variable stars. Furthermore, additional (F336W), (F255W) are now available allowing for additional UV-excess selection. Unfortunately, not all of our Chandra sources have such complete optical coverage, owing to the nature of this archival data obtained for other unrelated projects. However, only one X-ray source (CX8) lacks any HST color information at all.
In this section, we will first outline the optical astrometry undertaken to tie the HST images to the ICRS and thereby facilitate the alignment of our Chandra detections. We will then proceed to describe our optical data preparation and reductions, and end with our results.
4.1 Optical Astrometry
We aim to tie each HST pointing to the ICRS by finding matches between stars appearing on HST images and stars with accurate positions in either the Tycho-2 (Høg et al., 2000) or USNO A-2 (Monet, 1998) catalogs. Unfortunately, owing to the brightness and stellar density of the cluster core neither catalog extends to within 5′ of the center. However, the HST archive also contains numerous (largely V-band) images extending from the cluster center out to a 10′ radius, and these outermost images do overlap with the USNO A-2 coverage. On the basis of the HST pointing information (contained in each image header), we used the IRAF/STSDAS routine metric (which includes corrections for geometrical distortions towards the edge of each chip) to over-plot the nominal USNO star positions. To aid in the matching we also then degraded the HST images by convolving with a Gaussian to approximate the typical ground-based seeing of the plates used in deriving the catalog. It was then possible to make 58 reliable matches, on two separate HST datasets (i.e., from different satellite pointings), deriving offsets of 11 and 01 in RA and Dec., respectively. We found no evidence for a significant discrepancy in the nominal roll-angle, and hence we made no correction to this parameter. Taking the scatter to the astrometric fit and, in particular, the uncertainty in the roll-angle, we estimate residual uncertainties of a few tenths of an arcsecond.
Having aligned these outermost HST images, we then had to step in via intermediate overlapping HST images to find corrections for all the useful images of the cluster center. The procedure was essentially the same for each step. We measured the centroids of all bright (but not saturated) stars appearing in the overlap regions of two HST datasets and then applied invmetric to derive their nominal RA and Dec according to the headers. Pairs were then matched and average offsets in sky coordinates calculated. Again, in no case did there appear to be any significant roll-angle discrepancies present. For these steps, we more typically found a few hundred matches, and hence the uncertainty in the measured offsets was negligible relative to that of the initial tie to the USNO A-2 (ICRS) frame.
The final stage made use of the prior identifications of two H bright stars by Bailyn et al. (1996). Over-plotting our Chandra sources for the core revealed that the two optical stars flagged in the Bailyn et al. finding chart (their Fig. 2) are indeed excellent matches to two of our X-ray sources. Specifically, our analyses of the relative positions and position angles in both the X-ray and the optical for these two flagged stars were fully in agreement. (Note that our astrometric solution for the position of these two objects differs in RA and Dec by 033 () and 84, respectively, from the positions given by Bailyn et al. 1996. We can suggest no explanation for this large discrepancy.) In our analysis, only a small 05 X-ray vs. optical offset remained. However, this is consistent with the expected uncertainty in our astrometric solution for these HST images relative to the ICRS frame. Hence, we decided to apply this small offset (assuming that these two stars are exactly at their Chandra positions) to the astrometry for all of our HST datasets. In order to be thorough, we opted to examine all optical/UV stars within 05 of each Chandra source position. Indeed, as we describe in detail below, we then uncovered at least 3 more strong candidate optical counterparts, none of which was more than 01 from the expected position based upon this offset. Such results are indeed consistent with uncertainties expected in the relative astrometry of the X-ray positions, combined with their transfer to a variety of HST datasets.
4.2 Optical Data Reductions and Analysis
The data from the HST archive are already well-calibrated (aside from astrometry), and only two steps remained. For each pointing and filter, at least two images were available, which were then used to remove the numerous cosmic ray events detected in each exposure. We used the combine task to calculate an average image and applied one-sided sigma clipping (based on the median value of each pixel and a noise model for the detector) to exclude cosmic ray events. The images from each of the four chips were then trimmed to remove the partially masked edge regions.
We employed daofind in the IRAF implementation of DAOPHOT II (Stetson, 1992) to find all stars detected at approximately 3 above background, and we then determined their centroids. Unfortunately, this method is not fool-proof, and we also had to add a number of faint stars by hand to our list and delete others affected by the 20 saturated stars appearing on each frame. We excluded all stars with centers within 10–15 pixels of any saturated pixels and also any stars lying on the cross-shaped diffraction patterns of the very brightest stars. Having thus created a master star list for each image, aperture photometry yielded magnitudes for a range of annuli close to the measured FWHM of the PSF. We note that, for the undersampled stellar PSFs of the PC and especially the WF chips, aperture photometry produced better results than our attempts at PSF fitting. The apertures we used are, however, far smaller than the standard 05 aperture of the STMAG system (Holtzmann et al., 1995), and we therefore estimated the corresponding magnitude offsets needed relative to this large aperture for a number of bright (but non-saturated) and isolated stars on both the PC and WF chips. Applying both these offsets and the appropriate zeropoints based upon the sensitivity information in each header, we finally arrived at the STMAGs in a given filter for each star. We note that accurate estimation of the background contribution (especially critical for the faintest stars), is very difficult in such a crowded field. We adopted the mode value for an annulus surrounding each star. Tests, using either a fixed value as determined by averaging the results for the least crowded stars (farther from the core) or using the centroid of a Gaussian fit to the “sky” histogram instead of the mode, showed that we can expect systematic errors of 0.1–0.2 mags in our final STMAG values. We have also applied approximate corrections to the magnitudes derived from aperture photometry to compensate for the time-dependent charge-transfer-efficiency effect and the so-called “long versus short anomaly,” according to the formulae presented on the WFPC2 instrument web-pages (http://www.stsci.edu/instruments/wfpc2/).
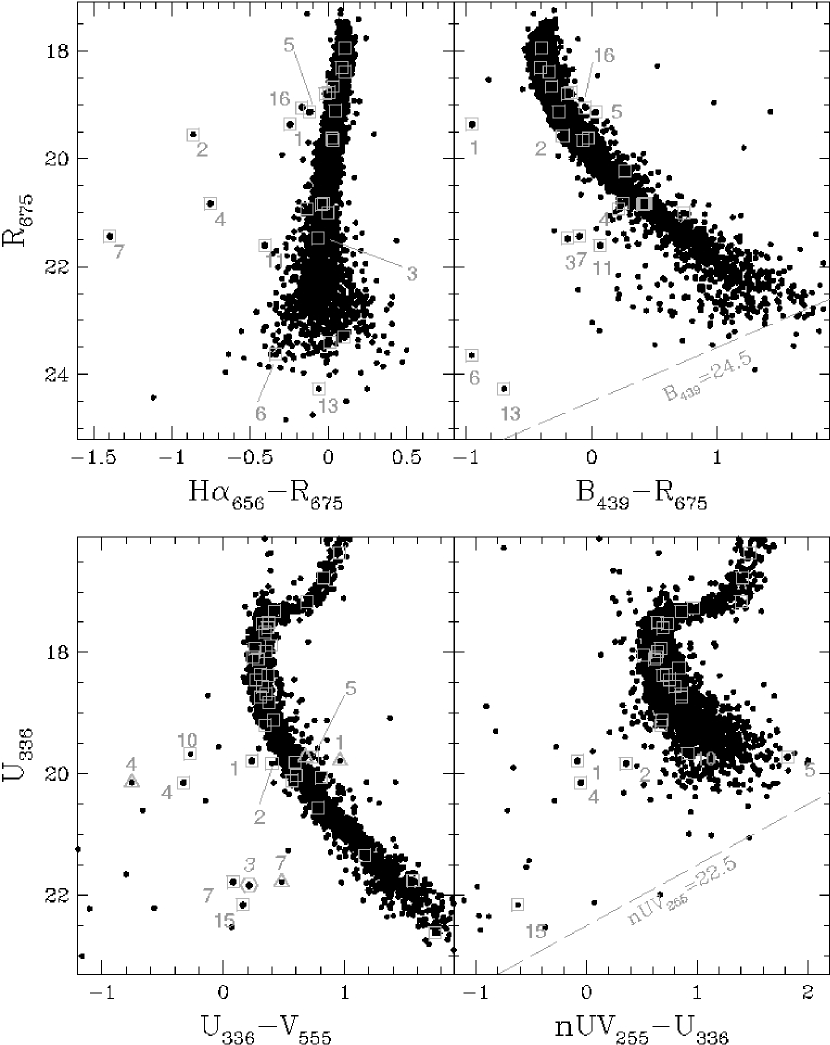
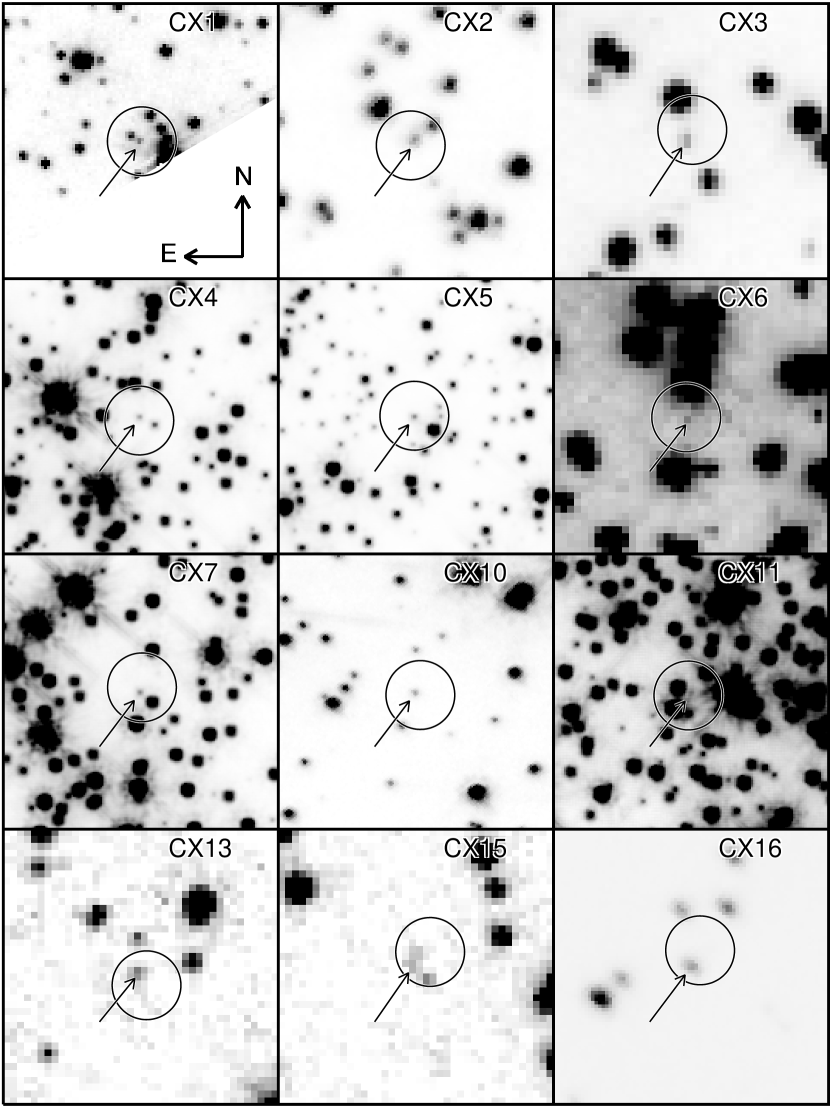
We constructed a variety of color-magnitude diagrams (CMDs) with all the available data. The most informative of these diagrams are shown in Fig. 3, on which all stars located within the 05 Chandra error circles are indicated by grey boxes. Numbers have been assigned to all candidate counterparts corresponding to the “CX” designation (i.e., our Star 1 is the counterpart to CX1). In this scheme, Stars 1 and 2 of Bailyn et al. (1996) are CX4 and CX7, respectively. In some cases, candidates are only abnormal in certain colors, but they are all labelled in each diagram. The results on each star are summarized in Table 4 and §5, and finding charts are shown in Fig. 4.
5 Results
The X-ray luminosities for the Chandra sources as listed in Tables 1 and 2 are in a range covered in the galactic disk by CVs, RS CVn binaries, and MSPs (e.g., see Fig. 8 in Verbunt et al. 1997). The soft X-ray transients with neutron stars in the galactic disk tend to have higher luminosities (the lowest luminosity known to us is that of Cen X-4 measured in August 1995 with the ROSAT HRI at erg s-1 between 0.5 and 2.5 keV; Rutledge et al. 2001). Transients with a black hole have quiescent luminosities down to 1030 erg s-1; these luminosities may be due to chromospheric emission from the companion to the black hole, however (Rutledge et al., 2000). None of the X-ray spectra in our sample is as soft as would be expected for a low-mass X-ray transient in quiescence; all systems with enough signal (CX1–9), except CX8, can be fit with relatively hard thermal bremsstrahlung spectra, as expected for CVs.
A further clue to the nature of the Chandra sources may be obtained from the X-ray to optical flux ratio. For the Chandra sources whose optical counterparts have not been measured in , we estimate . To allow comparison with the large database of ROSAT, we estimate that one Xsoft Chandra count for our 29 ks NGC 6752 observation corresponds to a rate of counts s-1 in channels 52–201 of the ROSAT PSPC. As shown in Fig. 5, the ratio of optical to X-ray flux of most Chandra sources in NGC 6752 suggests that they are cataclysmic variables. We discuss these first and the possible exceptions of CX12, CX16, and CX18 later.

Fig. 3 shows that the optical counterparts to CX1, CX2, CX3, CX4, CX7, CX10 and CX15 all have ultraviolet excesses (at and/or ) with respect to the main sequence, as expected for cataclysmic variables. In , the optical counterparts to CX1, CX3 and CX7 are still blue with respect to the main sequence, CX2 and CX4 are not distinguishable from the main sequence, and no information is available on CX10 and CX15. CX6, CX11 and CX13, for which no ultraviolet fluxes are available, are bluer than the main sequence in . CX1, CX2, CX4, and CX7 also show clear H emission, and CX3, CX6 and CX13 do not. CX11 shows marginal H excess, and no information is available for CX10 and CX15. On the whole, the optical properties for all these objects are compatible with those expected for cataclysmic variables, although CX11 and CX15 show evidence for having spatially extended emission and could be background galaxies. These and other early Chandra observations are finding the long-sought but, until recently, rarely observed population of CVs in globular clusters (Grindlay et al., 2001a, b).
CX12, CX18, and CX16 have (limits to) X-ray to optical flux ratios in the range of RS CVn systems. The limited information that may be obtained from the X-ray hardness of these three sources indicates that they may be as soft as expected for RS CVns. Interestingly, the color of CX16 places it on or slightly above the main sequence (see Fig. 3); its weak H emission is not unprecedented in RS CVn type systems either. The optical counterparts for CX12 and CX18 would have visual fluxes more than about 3 mag fainter than our limits if they were dwarf novae in quiescence. They can be as bright as our limits if they are dwarf novae in outburst or nova-like variables of the UX UMa type (i.e., non-magnetic, permanently bright cataclysmic variables).
The location of CX5 in the optical color-magnitude diagrams is similar to that of CX16, as is its moderate H emission. This suggests that it is an RS CVn system (more precisely, a BY Dra system). Its high X-ray to optical flux ratio and spectral hardness are more suggestive of a cataclysmic variable, however.
As remarked above, our Chandra sources have X-ray luminosities in the range also observed for MSPs in the galactic disk. In this respect, the X-ray sources for which we have no optical counterparts could be MSPs. Also, as stated in §2.2, we expect 4 serendipitous background sources within the half-mass radius. The optically unidentified faint X-ray sources may well be such background sources. Alas, no period derivatives or positions are as yet available for the five MSPs, with periods ranging from 3.3 to 9.0 msec, now known in NGC 6752 (Possenti et al., 2001a). The X-ray luminosity of an MSP is only a small fraction of the spin-down luminosity (Verbunt et al., 1996; Possenti et al., 2001b), and the latter is proportional to (with the pulse period). To illustrate this we write the X-ray luminosity as a fraction of the spindown luminosity
| (1) |
where g cm2 is the moment of inertia of the neutron star, its characteristic age, and the intrinsic period derivative. Entering characteristic values we obtain
| (2) |
We think that the most likely candidates are PSRs J191059A, C and E, which have the shortest periods and should therefore be the brightest in X-rays. The least luminous X-ray sources appear the more likely candidates, in particular CX17, which has a radio counterpart. However, CX8 has a very soft spectrum, and in our view cannot be excluded.
All of our likely source identifications are indicated in the X-ray color-magnitude diagram (Fig. 2).
6 Discussion
Our Chandra observation provides a dramatic improvement over the ROSAT HRI observations. The central X-ray emission of NGC 6752, resolved into 4 sources by the ROSAT HRI, is now found to be due to ten sources. The very accurate positions of these and other newly discovered sources allow secure identifications with HST sources and with one radio source.
Outside the core, the two sources CX2 and CX3 correspond to the ROSAT sources X14 and X6, respectively. From these two we determine an offset of (19, 21) that has to be applied to the ROSAT positions (as given by Verbunt & Johnston 2000) to align them with the Chandra frame.
In Fig. 6 we show the positions of the central sources that we have detected with Chandra superposed on a contour of the ROSAT HRI observation to which this offset has been applied. We then find that CX6 and CX1 correspond to X22 and X7b, respectively, whereas ROSAT source X7a has been resolved into CX11, CX12, and CX14, and X21 into CX4, CX5, CX7, and CX9.

From our spectral fits to the Chandra sources, we can estimate the ROSAT HRI and PSPC countrates for the luminosities at which Chandra detected them: 1 Xsoft Chandra count in our observation corresponds to about 0.0045 cts/ks in the ROSAT HRI observations and to 0.009 cts/ks (channels 52–201) in the ROSAT PSPC observation. With this conversion we find that the luminosities of X14/CX2, X6/CX3, X22/CX6, X7a/(CX4, 5, 7, 9) and X21/(CX11, 12, 14) are constant within the errors between the ROSAT HRI and Chandra observation. Source X7b/CX1, however, was about 30% brighter in the ROSAT HRI than in the Chandra observation. The central conglomerate of sources was about 40% brighter during the ROSAT PSPC observation than during the Chandra observation; due to the lack of spatial resolution in the PSPC we cannot assign this to a specific Chandra source. We thus have evidence that the X-ray luminosity of at least one central source, CX1, is variable. Both X-ray and optical variability will be discussed in detail in Homer et al. (2001b).
Chandra observations have been published for three other globular clusters that do not contain a bright ( erg s-1) central X-ray source. The numbers of identified sources of various types are summarized in Table 5. Of these clusters, 47 Tuc has a larger core and slightly smaller central density than NGC 6752, causing the frequency of close encounters in 47 Tuc to be a factor 10 larger than that in NGC 6752. NGC 6397 has a higher core density and much smaller core radius than NGC 6752, leading to a frequency of close encounters a factor 10 smaller than in NGC 6752. Finally, Cen has a smaller central density and larger core than any of these clusters, and an encounter frequency similar to that in NGC 6752.
The X-ray luminosity of currently known quiescent soft X-ray transients with neutron stars in the Galactic disk does not drop below erg s-1. If a similar lower limit holds for such transients in globular clusters, the Chandra observations provide a complete census of the quiescent transients in the observed four clusters, since none of the unclassified sources has an X-ray luminosity in excess of this threshold. If the number of quiescent soft X-ray transients scales with the collision frequency, we estimate that one such system is formed per 30 of our normalized encounter frequencies, in which case the numbers of two, one, and zero in 47 Tuc, Cen, and NGC 6752 are well within expectation with Poisson statistics. The possible presence of such a source in NGC 6397, however, is somewhat surprising. A similar statement may be made for the X-ray detected MSPs: for an expected number of one per ten normalized encounter frequencies, only NGC 6397 is surprising in containing one. The presence of both a soft X-ray transient and an X-ray detected MSP in NGC 6397 suggests that clusters with the highest densities contain more such systems than indicated by the (average) collision number. This may be the consequence of more pronounced mass segregation in these clusters, which enhances the encounter rate of neutron stars with respect to the average encounter rate by concentrating them to the core.
The relative numbers of cataclysmic variables and binaries with a neutron star (i.e., permanently bright low-mass X-ray binaries or soft X-ray transients) according to theory depends on a number of factors including the retention fraction of neutron stars (many neutron stars may be born with velocities that throw them out of the cluster, whereas all white dwarfs remain), the mass segregation in the cluster (which will concentrate the remaining neutron stars to the core where the close encounters occur, more so than the less massive white dwarfs), and the importance of primordial binaries evolving into cataclysmic binaries (important in clusters with small encounter frequencies). It is therefore interesting to see that the number ratio of (hitherto classified) cataclysmic variables to soft X-ray transients is not significantly different in 47 Tuc and NGC 6397, even though their encounter frequencies differ by two orders of magnitude. If many of the unclassified sources in 47 Tuc turn out to be cataclysmic variables, as is expected, the number ratio of cataclysmic variables to soft X-ray transients in it will even be higher. This again suggests that the average collision number of NGC 6397 underestimates the neutron star encounter rate. It should be noted that the census of cataclysmic variables through X-rays is certainly not complete, as many cataclysmic variables observed in the Galactic disk have X-ray luminosities below our threshold of erg s-1 (see e.g. Fig. 8 in Verbunt et al. 1997). If we accept that X9/V1 and X19/V2 in 47 Tuc and CX6 in NGC 6752 are indeed cataclysmic variables, we see from Fig. 5 that their X-ray to optical flux ratio is higher than that of any cataclysmic variable in the galactic disk studied by Verbunt et al. (1996). The high X-ray luminosity of X9 has been confirmed with Chandra observations; the relative hardness of its X-ray spectrum suggests a cataclysmic variable, rather than a quiescent soft X-ray transient (Grindlay et al., 2001a)
Equally remarkable is the fact that the number ratios of cataclysmic variables to X-ray active binaries is in all four clusters under discussion, notwithstanding the large range of encounter frequencies. In dense clusters like 47 Tuc, most cataclysmic variables should be formed via close encounters, whereas a less concentrated cluster like Cen may have a significant contribution of primordial binaries evolved into cataclysmic variables (Verbunt & Meylan, 1988; di Stefano & Rappaport, 1994; Davies, 1997). As more sources are identified in 47 Tuc and Cen, and other clusters are studied as well, the numbers may become big enough to allow more definite conclusions.
Finally, we are struck by the fact that all X-ray sources in Fig. 1 lie in a quadrant south of the cluster center. The formal probability of this happening with thirteen sources is small, but, if the optical cluster center position is accurate, we are inclined to ascribe this to chance. At the small interstellar absorption towards NGC 6752, and with the relatively hard spectra of the X-ray sources, differential absorption over the cluster cannot explain the asymmetry. The optical cluster center would have to be in error by about 10″ for it to be close to the X-ray center. We note that, if this is the case, then NGC 6752 becomes the second globular cluster for which the optical determination of its center has been corrected by an X-ray observation (the first one being NGC 6541, see Fig. 1 of Verbunt 2001).
References
- Arnaud (1996) Arnaud, K. A. 1996, in ASP Conf. Ser. 101, Astronomical Data Analysis Software and Systems V, ed. G. Jacoby & J. Barnes, 17
- Asai et al. (1996) Asai, K., Dotani, T., Mitsuda, K., Hoshi, R., Vaughn, B., Tanaka, Y., & Inoue, H. 1996, PASJ, 48, 257
- Asai et al. (1998) Asai, K., Dotani, T., Hoshi, R., Tanaka, Y., Robinson, C. R., & Terada, K. 1998, PASJ, 50, 611
- Bailyn et al. (1996) Bailyn, C. D., Rubenstein, E. P., Slavin, S. D., Cohn, H., Lugger, P., Cool, A. M., & Grindlay, J. E. 1996, ApJ, 473, L31
- Becker & Trümper (1999) Becker, W. & Trümper, J. 1999, A&A, 341, 803
- Camilo et al. (2000) Camilo, F., Lorimer, D. R., Freire, P., Lyne, A. G., & Manchester, R. N. 2000, ApJ, 535, 975
- Davies (1997) Davies, M. B. 1997, MNRAS, 288, 117
- Davies & Hansen (1998) Davies, M. B. & Hansen, B. M. S. 1998, MNRAS, 301, 15
- Deutsch et al. (1998) Deutsch, E. W., Anderson, S. F., Margon, B., & Downes, R. A. 1998, ApJ, 493, 775
- di Stefano & Rappaport (1994) di Stefano, R. & Rappaport, S. 1994, ApJ, 423, 274
- Frater, Brooks, & Whiteoak (1992) Frater, R. H., Brooks, J. W., & Whiteoak, J. B. 1992, Journal of Electrical and Electronics Engineering Australia, 12, 103
- Freire et al. (2001) Freire, P. C., Camilo, F., Lorimer, D. R., Lyne, A. G., Manchester, R. N., & D’Amico, N. 2001, MNRAS, in press, also at astro-ph/0103372
- Geffert (1998) Geffert, M. 1998, A&A, 340, 305
- Giacconi et al. (2001) Giacconi, R., Rosati, P., Tozzi, P., Nonino, M., Hasinger, G., Norman, C., Bergeron, J., Borgani, S., Gilli, R., Gilmozzi, R., Zheng, W. 2001, ApJ, 551, 624
- Grindlay (1993) Grindlay, J. E. 1993, in ASP Conf. Ser. 50, Structure and Dynamics of Globuler Clusters, ed. S. Djorgovski & G. Meylan, 258
- Grindlay et al. (2001a) Grindlay, J. E., Heinke, C., Edmonds, P. D., & Murray, S. S. 2001a, Science, 292, 2290
- Grindlay et al. (2001b) Grindlay, J. E., Heinke, C. O., Edmonds, P. D., Murray, S. S., & Cool, A. M. 2001b, astro-ph/0108265
- Harris (1996) Harris, W. E. 1996, AJ, 112, 1487
- Hakala et al. (1997) Hakala, P. J., Charles, P. A., Johnston, H. M., & Verbunt, F. 1997, MNRAS, 285, 693
- Heinke, Edmonds, & Grindlay (2001) Heinke, C. O., Edmonds, P. D., & Grindlay, J. E. 2001, ApJ, in press, also astro-ph/0107513
- Hertz & Grindlay (1983a) Hertz, P. & Grindlay, J. E. 1983a, ApJ, 267, L83
- Hertz & Grindlay (1983b) Hertz, P. & Grindlay, J. E. 1983b, ApJ, 275, 105
- Høg et al. (2000) Høg, E., Fabricius, C., Makarov, V. V., Urban, S., Corbin, T., Wycoff, G., Bastian, U., Schwekendiek, P., & Wicenec, A. 2000, A&A, 355, L27
- Holtzmann et al. (1995) Holtzmann, J. A., Burrows, C. J., Casertano, S., Hester, J. J., Trauger, J. T., Watson, A. M., & Worthey, G. 1995, PASP, 107, 1065
- Homer et al. (2001a) Homer, L., Anderson, S. F., Margon, B., Deutsch, E. W., & Downes, R. A. 2001a, ApJ, 550, L155
- Homer et al. (2001b) Homer, L., et al. 2001b, in preparation
- Hut et al. (1992) Hut, P., McMillan, S., Goodman, J., Mateo, M., Phinney, E. S., Pryor, C., Richer, H. B., Verbunt, F., & Weinberg, M. 1992, PASP, 104, 981
- in ’t Zand et al. (1999) in ’t Zand, J. J. M., Verbunt, F., Strohmayer, T. E., Bazzano, A., Cocchi, M., Heise, J., van Kerkwijk, M. H., Muller, J. M., Natalucci, L., Smith, M. J. S., & Ubertini, P. 1999, A&A, 345, 100
- Johnston, Verbunt, & Hasinger (1994) Johnston, H. M., Verbunt, F., & Hasinger, G. 1994, A&A, 289, 763
- Lewin, van Paradijs, & Taam (1993) Lewin, W. H. G., van Paradijs, J., & Taam, R. E. 1993, Sp. Sci. Rev., 62, 223
- Lyne et al. (1987) Lyne, A. G., Brinklow, A., Middleditch, J., Kulkarni, S. R., & Backer, D. C. 1987, Nature, 328, 399
- Margon, Downes, & Gunn (1981) Margon, B., Downes, R. A., & Gunn, J. E. 1981, ApJ, 247, L89
- Monet (1998) Monet, D. G. 1998, BAAS, 193, 120.03
- Pooley et al. (2000) Pooley, D., Lewin, W. H. G., Verbunt, F., Fox, D. W., Margon, B., Kaspi, V. M., van der Klis, M., & Miller, J. M. 2000, AAS/HEAD Conference 32, 29.01
- Possenti et al. (2001a) Possenti, A., D’Amico, N., Manchester, R. N., Sarkissian, J., Lyne, A. G., & Camilo, F. 2001a, astro-ph/0108343
- Possenti et al. (2001b) Possenti, A., Cerutti, R., Colpi, M., & Mereghetti, S. 2001b, A&A, submitted, also at astro-ph/0109452
- Predehl & Schmitt (1995) Predehl, P., & Schmitt, J. H. M. M. 1995, A&A, 293, 889
- Renzini et al. (1996) Renzini, A., Bragaglia, A., Ferraro, F. R., Gilmozzi, R., Ortolani, S., Holberg, J. B., Liebert, J., Wesemael, F., & Bohlin, R. C. 1996, ApJ, 465, L23
- Richman (1996) Richman, H. R. 1996, ApJ, 462, 404
- Rutledge et al. (2001a) Rutledge, R. E., Bildsten, L., Brown, E. F., Pavlov, G. G., & Zavlin, V. E. 2001, ApJ, submitted, also at astro-ph/0105405.
- Rutledge et al. (2001b) Rutledge, R. E., Bildsten, L., Brown, E. F., Pavlov, G. G., & Zavlin, V. E. 2001, ApJ, 551, 921
- Rutledge et al. (2000) Rutledge, R. E., Bildsten, L., Brown, E. F., Pavlov, G. G., Zavlin, V. E. 2000, ApJ, 529, 985
- Saito et al. (1997) Saito, Y., Kawai, N., Kamae, T., Shibata, S., Dotani, T., & Kulkarni, S. R. 1997, ApJ, 477, L37.
- Stetson (1992) Stetson, P. B. 1992, in ASP Conf. Ser. 25, Astronomical Data Analysis Software and Systems I, ed. D. W. Worrall, C. Biemesderfer, & J. Barnes, 297
- Trager, Djorgovski, & King (1993) Trager, S. C., Djorgovski, S., & King, I. R. 1993, in ASP Conf. Ser. 50, Structure and Dynamics of Globuler Clusters, ed. S. Djorgovski & G. Meylan, 347
- Verbunt & Meylan (1988) Verbunt, F. & Meylan, G. 1988, A&A, 203, 297
- van Teeseling, Beuermann, & Verbunt (1996) van Teeseling, A., Beuermann, K., & Verbunt, F. 1996, A&A, 315, 467
- Verbunt & Johnston (2000) Verbunt, F. & Johnston, H. M. 2000, A&A, 358, 910
- Verbunt et al. (1994) Verbunt, F., Belloni, T., Johnston, H. M., van der Klis, M., & Lewin, W. H. G. 1994, A&A, 285, 903
- Verbunt et al. (1996) Verbunt, F., Kuiper, L., Belloni, T., Johnston, H. M., de Bruyn, A. G., Hermsen, W., & van der Klis, M. 1996, A&A, 311, L9
- Verbunt et al. (1997) Verbunt, F., Bunk, W. H., Ritter, H., & Pfeffermann, E. 1997, A&A, 327, 602
- Verbunt & Hasinger (1998) Verbunt, F. & Hasinger, G. 1998, A&A, 336, 895
- Verbunt (2001) Verbunt, F. 2001, A&A, 368, 137
- Weisskopf, O’Dell, & van Speybroeck (1996) Weisskopf, M. C., O’Dell, S. L., & van Speybroeck, L. F. 1996, Proc. SPIE, 2805, 142
| SrcaaTB = Thermal Bremsstrahlung, BB = Blackbody, PL = Power Law | RA (J2000)bbUnabsorbed luminosity for kpc. | Dec (J2000)bbUnabsorbed luminosity for kpc. | Detected Counts/Corrected CountsccX-ray detected MSPs. | (erg s-1)ddUnclassified. | Cntrptee1. Grindlay et al. (2001a); 2. Rutledge et al. (2001a); 3. this paper; 4. Grindlay et al. (2001b) | IDfffootnotemark: | ||
|---|---|---|---|---|---|---|---|---|
| Xsoft | Xmed | Xhard | [0.5–2.5 keV] | |||||
| CX1 | 19:10:51.098 | 59:59:11.83 | 536/588.0 | 936/1014.0 | 444/457.0 | Opt./X7b | CV | |
| CX2 | 19:10:55.972 | 59:59:37.33 | 196/215.3 | 315/343.5 | 130/135.3 | Opt./X14 | CV | |
| CX3 | 19:10:40.318 | 59:58:41.29 | 177/195.4 | 274/297.6 | 104/107.0 | Opt./X6 | CV | |
| CX4 | 19:10:51.546 | 59:59:01.71 | 132/146.0 | 219/238.7 | 94/97.1 | Opt./B1 | CV | |
| CX5 | 19:10:51.374 | 59:59:05.11 | 94/103.7 | 175/190.3 | 86/88.7 | Opt. | CV/BY Dra | |
| CX6 | 19:10:51.462 | 59:59:26.99 | 83/90.9 | 121/130.9 | 41/42.1 | Opt./X22 | CV | |
| CX7 | 19:10:51.467 | 59:58:56.72 | 58/64.3 | 95/103.6 | 44/45.4 | Opt./B2 | CV | |
| CX8 | 19:11:02.944 | 59:59:41.89 | 83/90.8 | 87/94.5 | 4/3.9 | — | ||
| CX9 | 19:10:51.720 | 59:58:59.16 | 47/52.0 | 65/70.8 | 19/19.5 | — | ||
| CX10 | 19:10:54.706 | 59:59:13.87 | 13/14.2 | 25/27.0 | 12/12.3 | Opt. | CV | |
| CX11 | 19:10:52.376 | 59:59:05.56 | 22/24.1 | 26/28.0 | 5/5.0 | Opt. | CV/Gal. | |
| CX12 | 19:10:52.694 | 59:59:03.27 | 19/20.8 | 23/24.7 | 4/3.9 | — | ||
| CX13 | 19:10:40.565 | 60:00:06.07 | 13/13.8 | 18/18.6 | 7/6.8 | Opt. | CV | |
| CX14 | 19:10:52.039 | 59:59:09.12 | 15/16.4 | 15/16.0 | 0/– | — | ||
| CX15 | 19:10:55.798 | 59:57:45.53 | 8/8.5 | 10/10.4 | 2/1.9 | Opt. | CV/Gal. | |
| CX16 | 19:10:42.474 | 59:58:42.83 | 8/8.7 | 9/9.5 | 1/0.9 | Opt. | BY Dra | |
| CX17 | 19:11:05.279 | 59:59:04.03 | 3/3.2 | 7/7.4 | 4/4.0 | Rad. | MSP/Gal. | |
| CX18 | 19:10:52.006 | 59:59:03.69 | 7/7.7 | 7/7.5 | 0/– | — | ||
| CX19 | 19:10:55.577 | 59:59:17.54 | 4/4.3 | 4/4.2 | 0/– | — | ||
aSources are numbered according to their total counts.
bThe Chandra positions have been corrected by () in RA and in Dec (see §3). We estimate the uncertainties in the final astrometric solution at about 03 in both RA and Dec. These uncertainties are much larger than the wavdetect centroiding uncertainties.
cCorrections are described in §2.3. X-ray bands are 0.5–1.5 keV (Xsoft), 0.5–4.5 keV (Xmed), and 1.5–6.0 keV (Xhard).
dFor sources CX1–CX9, comes from an average of the unabsorbed luminosities of the best-fit models for each source (see Tables 2 and 3). A linear relation between and Xmed counts for these sources was derived and used to estimate for sources CX10–CX19 based upon their Xmed counts. Typical uncertainties in are 20%.
eType of counterpart (optical or radio) found and associations (if any) with previously reported sources. “X” numbers refer to the ROSAT sources of Verbunt & Johnston (2000). “B” numbers refer to the HST sources of Bailyn et al. (1996). Note that our HST positions for these variables are very different from those given by Bailyn et al. (see §4.1).
fSee §5 for details. “Gal.” indicates the source may be a galaxy.
| Src | ModelaaTB = Thermal Bremsstrahlung, BB = Blackbody, PL = Power Law | (keV) | (erg s-1)bbUnabsorbed luminosity for kpc. | (dof) |
|---|---|---|---|---|
| or | [0.5–2.5 keV] | |||
| CX1 | TB | 99.8 | 1.04 (25) | |
| BB | 0.66 | 4.05 (25) | ||
| PL | 1.19 | 1.17 (25) | ||
| CX2 | TB | 20.8 | 1.02 (19) | |
| BB | 0.45 | 3.48 (19) | ||
| PL | 1.32 | 1.03 (19) | ||
| CX3 | TB | 5.20 | 1.20 (16) | |
| BB | 0.50 | 3.53 (16) | ||
| PL | 1.62 | 1.23 (16) | ||
| CX4 | TB | 17.1 | 1.05 (12) | |
| BB | 0.61 | 2.90 (12) | ||
| PL | 1.35 | 1.14 (12) | ||
| CX5 | TB | 29 | 0.84 (14) | |
| BB | 0.65 | 1.07 (14) | ||
| PL | 0.93 | 0.66 (14) | ||
| CX6 | TB | 11.7 | 1.02 (10) | |
| BB | 0.38 | 2.41 (10) | ||
| PL | 1.41 | 1.06 (10) | ||
| CX7 | TB | 34.2 | 0.78 (8) | |
| BB | 0.45 | 3.12 (8) | ||
| PL | 1.33 | 0.71 (8) | ||
| CX8 | TB | 6.32 | 2.07 (6) | |
| BB | 0.26 | 1.35 (6) | ||
| PL | 1.31 | 2.11 (6) | ||
| CX9 | TB | 3.34 | 0.14 (4) | |
| BB | 0.34 | 0.49 (4) | ||
| PL | 1.64 | 0.21 (4) |
| ModelaaTB = Thermal Bremsstrahlung, BB = Blackbody, PL = Power Law | ( cm-2) | (keV) | (erg s-1)bbUnabsorbed luminosity for kpc. | (dof) |
|---|---|---|---|---|
| or | [0.5–2.5 keV] | |||
| TB | 8.36 | 15.9 | 0.66 (24) | |
| BB | 0.67 | 3.70 (24) | ||
| PL | 10.4 | 1.44 | 0.73 (24) | |
| BB+PL | 1.99 | 0.54 (22) |
| Optical | Offset from CXO posn.aaCollision frequency scaled on the frequency in 47 Tuc. It is computed based on the central density and core radius given in the 1999 June 22 version of the catalogue described in Harris (1996), as . | |||||||
| star ID # | in (″) | in (″) | ||||||
| 1 | 0.05 | 0.05 | ||||||
| 2 | –0.09 | 0.07 | ||||||
| 3 | 0.06 | –0.11 | bbX-ray-active main-sequence binaries. | bbX-ray-active main-sequence binaries. | – | |||
| 4 | –0.01 | 0.06 | ||||||
| 5 | –0.02 | 0.00 | ||||||
| 6 | –0.09 | 0.00 | – | – | – | |||
| 7 | 0.01 | –0.06 | – | |||||
| 10 | 0.06 | –0.05 | – | – | – | |||
| 11 | –0.05 | 0.05 | – | – | – | |||
| 13 | 0.13 | 0.16 | – | – | – | |||
| 15 | 0.21 | –0.18 | – | – | – | |||
| 16 | 0.06 | –0.18 | – | – | – | |||
aThe optical position is then given by Chandra X-ray value + offset in each coordinate. Note, the results are in true seconds of arc for both RA and Dec.
bThese magnitudes are estimates based on the wide U (F300W) and wide V (F606W) data available (, ) and transformations given in Holtzmann et al. (1995).
| Cluster | Coll. Freq.aaCollision frequency scaled on the frequency in 47 Tuc. It is computed based on the central density and core radius given in the 1999 June 22 version of the catalogue described in Harris (1996), as . | qLMXB | CV | Bin.bbX-ray-active main-sequence binaries. | MSPccX-ray detected MSPs. | Unc.ddUnclassified. | Ref.ee1. Grindlay et al. (2001a); 2. Rutledge et al. (2001a); 3. this paper; 4. Grindlay et al. (2001b) |
|---|---|---|---|---|---|---|---|
| 47 Tuc | 100 | 2 | 13 | 5 | 9 | 1 | |
| Cen | 16 | 1 | 2 | 0 | 0 | 2 | |
| NGC 6752 | 9 | 0 | 11-14 | 1-3 | 1 | 6 | 3 |
| NGC 6397 | 1 | 1 | 8 | 2 | 1 | 1 | 4 |