The Chandra Deep Field North Survey. VIII. X-ray Constraints on Spiral Galaxies from
Abstract
We present a statistical X-ray study of spiral galaxies in the Hubble Deep Field-North and its Flanking Fields using the Chandra Deep Field North 1 Ms dataset. We find that galaxies with have ratios of X-ray to -band luminosity similar to those in the local Universe, although the data indicate a likely increase in this ratio by a factor of –3. We have also determined that typical spiral galaxies at should be detected in the 0.5–2 keV band in the flux range (–6 erg cm-2 s-1.
1 Introduction
X-ray studies of fairly “normal” galaxies, with high-energy emission not obviously dominated by a luminous active galactic nucleus (AGN), have recently been extended to cosmologically interesting distances in the Chandra Deep Field (CDF) surveys, which have now reached 1 Ms of exposure (CDF-N: Hornschemeier et al. 2001, hereafter Paper II; Brandt et al. 2001b, hereafter Paper V; CDF-S: Tozzi et al. 2001; P. Rosati et al., in prep.). Galaxies with are detected in appreciable numbers at 0.5–2 keV fluxes below erg cm-2 s-1 (e.g., Paper II); the CDF-N survey goes almost two orders of magnitude fainter, detecting significant numbers of normal galaxies among the population of X-ray sources making the diffuse X-ray Background (XRB; Paper II; A.J. Barger et al., in prep.). These normal galaxies contribute as much as 5–10% of the XRB flux in the 0.5–2 keV band. The bulk of the energy density of the XRB is certainly explained by AGN, but the investigation of the “typical” galaxy, whether its X-ray emission is dominated by a population of X-ray binaries, hot interstellar gas, or even a low-luminosity AGN, is an equally important function of deep X-ray surveys. Normal galaxies are likely to be the most numerous extragalactic X-ray sources in the Universe and are expected to dominate the number counts at 0.5–2 keV fluxes of – erg cm-2 s-1 (Ptak et al. 2001).
The CDF-N has reached the depths necessary to detect individually many normal [; is from 0.5–2 keV] galaxies to , corresponding to a look-back time of Gyr ( km s-1 Mpc-1, , and are adopted throughout this paper). Reaching larger look-back times presents the exciting possibility of detecting the bulk X-ray response to the heightened star-formation rate at –3 (e.g., Madau et al. 1996). One thus expects the X-ray luminosity per unit -band luminosity to be larger at –1 in the past due to the increased energy output of X-ray binary populations at –3; this X-ray emission represents a “fossil record” of past epochs of star formation (e.g., Ghosh & White 2001; Ptak et al. 2001). Therefore, measurements of the X-ray luminosities of typical galaxies can constrain models of X-ray binary production in galaxies.
While X-ray emission from individual galaxies is not easily detected at , it is possible to estimate the emission at their extremely faint flux levels using statistical methods such as stacking, a technique implemented successfully on the CDF-N survey data in several previous studies. These include the detection of X-ray emission from the average bright () galaxy in the Hubble Deep Field-North (HDF-N) described in Brandt et al. (2001a, hereafter Paper IV) and a study of X-ray emission from –4 Lyman break galaxies identified in the HDF-N (Brandt et al. 2001c, hereafter Paper VII). Encouraged by the success of these analyses, we extend here the study of normal galaxies to the entire HDF-N plus HST Flanking Fields region, now concentrating on galaxies at to complement the study of galaxies performed in Paper VII. We focus on this redshift range due to the extensive spectroscopic redshift coverage (Cohen et al. 2000 and references therein) and superb HST imaging which has allowed a comprehensive galaxy morphology study (van den Bergh, Cohen, & Crabbe 2001). The CDF-N data provide extremely deep X-ray coverage over this area (see Figure 7 of Paper V for the exposure map of this region); the point-source detection limits in this region of the CDF-N survey in the 0.5–2 keV and 2–8 keV bands are erg cm-2 s-1 and erg cm-2 s-1, respectively.
In this study, we place observational constraints on the evolution of the ratio of X-ray luminosity to -band luminosity of “normal” spiral galaxies up to ; this ratio is an indicator of the current level of star formation in a galaxy (e.g., David, Jones, & Forman 1992; Shapley et al. 2001). We also place constraints on the fraction of the diffuse XRB explained by galaxies lingering just below the CDF-N detection threshold, and thus the contribution to the XRB by normal galaxies.
2 Galaxy Samples
2.1 Redshift and Photometric Data
Spectroscopic redshifts for the galaxies are drawn from the catalogs of Cohen et al. (2000), Cohen (2001), and Dawson et al. (2001) in the range . Spectroscopic redshift determination is difficult in the range due to the absence of strong features in the observed-frame optical band and the lack of the Lyman break feature useful to identify higher redshift objects. We have therefore used the deep photometric redshift catalog of Fernández-Soto, Lanzetta, & Yahil (1999) for the redshift interval , which allows some overlap in redshift space with the spectroscopic catalogs for cross-checking. The spectroscopic catalogs cover the entire HDF-N plus a substantial fraction of the HST Flanking Fields region, whereas the photometric catalog only covers the HDF-N. We shall refer to these two samples as the “spectroscopic sample” and the “photometric sample” throughout the rest of this Letter.
For the spectroscopic sample, the -band magnitude was used to filter the sources by optical luminosity, as this is best matched to rest-frame over most of the redshift range under consideration here. The magnitudes are those given in Barger et al. (1999) for the Hawaii Flanking Fields area. For the photometric sample, the HST F814W (hereafter ) magnitudes of Fernández-Soto et al. (1999) were used.
2.2 Sample Definition
We chose galaxies which had no X-ray detection within 40 in the 0.5–8 keV (full), 0.5–2 keV (soft) and 2–8 keV (hard) bands down to a wavdetect (Freeman et al. 2002) significance threshold of in the restricted ACIS grade set of Paper IV. This low detection threshold ensures that our study does not include sources with X-ray emission just below the formal detection limits of Paper V.
We have attempted to construct a sample of galaxies similar to spiral galaxies in the local Universe. To accomplish this, we have used the morphological classes of van den Bergh et al. (2001) for galaxies from in the HDF-N and the HST Flanking Fields. To simplify the morphological filtering, we have cast objects in the van den Bergh et al. (2001) catalog into the following four classes: (1) “E/S0” and “E”, (2) “merger”, (3) “Sa”–“Sc”, including proto-spirals and spiral/irregulars, and (4) “Irr”, “peculiar” and/or “tadpole”. We then filtered the catalog to keep only classes (2) and (3).
Filtering the photometric sample is more difficult due to the faintness of many of the sources and problems due to morphological evolution with redshift. We have used the spectral energy distribution (SED) classifications of Fernández-Soto et al. (2001) to exclude all galaxies of type “E”. Comparison of the source lists reveals that, within the area covered by both, 70% of galaxies identified through the two methods are in common.
Since the evolution of X-ray properties with redshift is of interest, we have made an effort to study objects with comparable optical luminosities at different redshifts. This is particularly important due to the non-linear relationship between X-ray luminosity and -band luminosity for some types of spiral galaxies (; e.g. Fabbiano & Shapley 2001). Using the value of in the -band as determined by Blanton et al. (2001) for a large sample of galaxies in the Sloan Digital Sky Survey, we determined the value of in the -band. The Sloan filter is best matched to ; the resulting value of in the band is .
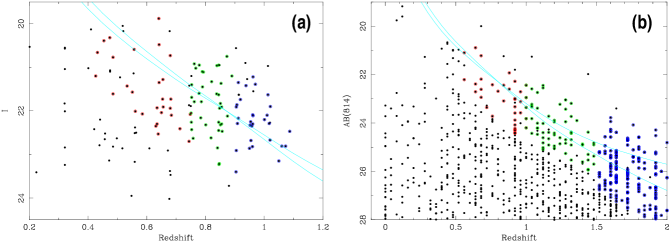
To ensure that our results are not sensitively dependent upon the galaxy SED used to determine the optical properties, we have used both the Sa and Sc galaxy SEDs of Poggianti et al. (1997) to calculate and vs. for an galaxy using the synthetic photometry package SYNPHOT in IRAF. These calculations are shown in Figure 1. Note the close similarity between the Sa and Sc tracks; this is because the band corresponds to rest-frame in the middle of our redshift range.
Also plotted in Figure 1 are the 151 galaxies in the spectroscopic sample with spiral or merger morphology having and the 651 galaxies in the photometric sample with SED class other than “E” having . These galaxies were filtered by optical flux to lie within 1.5 mags of the galaxy tracks discussed above; the galaxy samples constructed assuming Sa and Sc SEDs were identical (or nearly so) for all redshifts up to . Galaxies meeting the optical magnitude filter were then divided by redshift into several bins; these bins were constructed to ensure that there were galaxies per bin. The number of galaxies, median redshift, median look-back time and median optical magnitude for each bin are listed in Table 1. In Figure 1, we mark all the objects in the Sc SED sample with colors indicating the different redshift bins.
Table 1 also includes the number of galaxies rejected from each redshift bin due to the presence of an X-ray detection within 40; this exclusion radius ensures that our results will not be adversely affected by the wings of the PSF of very bright X-ray sources. These galaxies satisfied both the optical magnitude and morphology filtering constraints and were rejected only due to X-ray detection. This exclusion criterion is very conservative, however, considering that our astrometry is accurate to 6 in the area under consideration (see Paper V). To allow for the off-nuclear nature of some of the X-ray sources found in normal galaxies (e.g., Paper IV), we consider galaxies to be highly confident X-ray detections if the X-ray source is within 15 of the galaxy’s center. This matching radius is also well matched to the Chandra PSF.111This radius corresponds to the 90% encircled-energy radius at off-axis for 0.5–2 keV and the 83% encircled-energy radius for 0.5–8 keV. We therefore also give the number of galaxies having an X-ray detection within 15 in Table 1.
3 Stacking Procedure and Results
The X-ray imaging data at each position were stacked in the same manner as in Paper VII, keeping the 30 pixels whose centers fall within an aperture of radius 15. The detection significance in each band was assessed by performing 100,000 Monte-Carlo stacking simulations using local background regions as in Paper VII. A source is considered to be significantly detected if the number of counts over background exceeds that of 99.99% of the simulations. No single source in the stacking sample appeared to dominate the distribution, demonstrating the effectiveness of our selection criteria.
Stacking of the galaxies in the redshift bins described in Table 1 and Figure 1 resulted in significant detections in the soft band for all of the redshift bins up to (see Table 2). We also stacked galaxies in the redshift bin , but there was not a significant detection. The results for the two different spiral galaxy SED samples are nearly or exactly identical except for the detection in the highest redshift bin (). We adopt a power law for the calculation of X-ray fluxes and luminosities, assuming that these galaxies are similar to spiral galaxies in the local Universe and have their X-ray emission dominated by X-ray binaries (e.g., Kim, Fabbiano, & Trinchieri 1992). While there were several cases of significant detections in the full band, there were no highly significant detections in the hard band. Given the variation of effective area and background rate with energy, the signal-to-noise ratio for sources with the assumed spectrum is highest in the soft band and lowest in the hard band, so this behavior is expected. The flux level of the soft-band detections for the spectroscopic sample is (5–6) erg cm-2 s-1. The corresponding rest-frame 0.5–2 keV luminosities for the average galaxy are erg s-1 for the lowest redshift bin and erg s-1 for the highest redshift bin. For the photometric sample, the soft-band flux level of the detections is (3–5) erg cm-2 s-1. We also give fluxes for the less significant detections in the full band for those redshift bins having highly significant soft-band detections.
We have investigated the properties of the sources which were rejected from the stacking samples due to an X-ray detection at or near the position of the galaxy (the numbers of such sources are given in the last column of Table 1). There are only 15 distinct galaxies with X-ray detections within 15. Of these 15 sources, three are broad-line AGN, which are clearly not normal galaxies. One object has a photometric redshift which differs significantly from its spectroscopic redshift. Since the optical properties of this object at its spectroscopic redshift place it outside our sample boundaries, we have rejected it. One object is very near another X-ray source which has been positively identified with a narrow-line AGN. Thus, there are a total of 10 “normal” galaxies positively identified with X-ray sources within this sample, consituting a small minority of the galaxies under study here. The worst case is in the lowest redshift bin where 15% of the galaxies had X-ray detections.
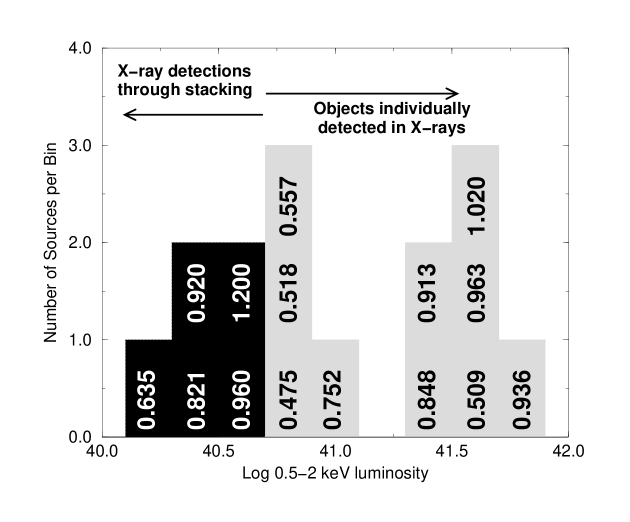
Figure 2 shows a histogram of values calculated for both the stacking samples and the individually X-ray detected galaxies. The individually X-ray detected galaxy set does possibly contain some lower-luminosity AGN, including the AGN candidate CXOHDFN J123643.9+621249 (see Papers II and IV). With the exception of the objects in the redshift bin with median , Figure 2 shows that typically the X-ray luminosities of the individually detected objects are on average much higher than those of the stacked galaxies; they are sufficiently more luminous as to appear atypical of the normal galaxy population. For the lowest redshift bin, it is plausible that our results are moderately biased by the exclusion of the X-ray detected sources. In §4, we therefore also give results which include the individually X-ray detected objects in the sample average for this lowest redshift bin.
For additional comparison, we have considered the radio properties of the individually detected galaxies and the stacked galaxies using the catalogs of Richards et al. (1998) and Richards (2000). The percentage of radio detections among the individually X-ray detected galaxies is higher than that among the stacked galaxies (% vs. –5%). This possible difference between the two populations is significant at the 93% level as determined using the Fisher exact probability test for two independent samples (see Siegel & Castellan 1988). Due to the X-ray luminosity difference and possible difference in radio properties, and to the fact that these galaxies constitute a small minority of those under study, we are confident we have not biased our determination of the properties of the typical galaxy by omitting these X-ray detected objects from further consideration.
4 Discussion
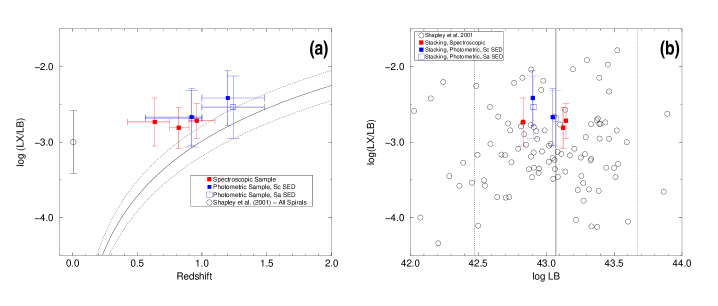
In Figure 3a, we plot the X-ray-to-optical luminosity ratio for each stacked detection, where is calculated for the rest-frame 0.5–2 keV band. We have also plotted our approximate sensitivity limit in Figure 3a, which is simply the corresponding X-ray luminosity detection limit achieved for a 30 Ms stacking analysis divided by . We do not expect to detect galaxies having less X-ray emission per unit -band luminosity than this value. For comparison with the local Universe, we also plot the mean for spiral galaxies of comparable from the sample of Shapley et al. (2001). This sample includes 234 spiral galaxies observed with Einstein and excludes AGN where the X-ray emission is clearly dominated by the nucleus. The galaxies in the Shapley et al. (2001) sample all have ; median redshift is .
In Figure 3b, we plot versus ; the values up to are consistent with what is observed in the Shapley et al. sample for objects with comparable , although they are toward the high end of what is observed. This is consistent with Figure 3a, which shows the average derived from stacking being somewhat higher than that for the Shapley et al. galaxies of comparable optical luminosity. There is a slight increase (factor of 1.6) in the average from the local Universe to . For the highest redshift bin (), the results become somewhat sensitive to the galaxy SED one assumes for determining the optical properties. We suspect that an Sc galaxy SED is more appropriate at this epoch due to the higher prevalence of star formation. Adopting this SED, we find that has increased somewhat more substantially ( times) at .
One may also constrain star-formation models using only the X-ray properties of these galaxies. The average X-ray luminosity of the spiral galaxies in the Shapley et al. (2001) sample having the same range of as used in this study is erg s-1 (converted to 0.5–2 keV). The average galaxy in our stacking sample has a luminosity times higher at . This increases to times higher at . The value is most likely affected by some bias due to the exclusion of legitimate normal galaxies in the lowest redshift bin (see §3). If we include these individually X-ray detected objects, then the average galaxy in our stacking sample has a luminosity times higher at , consistent with the predictions of Ghosh & White (2001) that the X-ray luminosity of the typical Sa-Sbc spiral galaxy should be times higher at . Including the X-ray detected galaxies does not significantly affect our results for the interval (the difference is %). However, since the X-ray luminosities of the X-ray detected objects with are substantially higher (by an order of magnitude) than the X-ray stacking averages (see Figure 2), it is not appropriate to include these objects in the calculation of the average X-ray luminosity. We thus find a smaller increase in the average X-ray luminosity of galaxies at than the increase by a factor of predicted by Ghosh & White (2001). We find that the average X-ray luminosities of galaxies have not evolved upward by more than a factor of by , regardless of exclusion or inclusion of X-ray detected objects.
The range of average 0.5–2 keV fluxes for the spiral galaxies studied here is (–6 erg cm-2 s-1. These X-ray fluxes are consistent with independent predictions made by Ptak et al. (2001) that galaxies of this type will be detected at 0.5–2 keV flux levels of erg cm-2 s-1 (converted from their 2–10 keV prediction assuming a power law).
Assuming a 0.5–2 keV XRB flux density of erg cm-2 s-1 deg-2 (Garmire et al. 2001), we have identified % of the soft XRB as arising from spiral galaxies not yet individually detected in deep Chandra surveys. Many of these objects should be sufficently bright to be detected with Chandra ACIS exposures of Ms, which should be achievable in the next several years of the mission.
References
- (1)
- (2) Barger, A.J., Cowie, L.L., Trentham, N., Fulton, E., Hu, E., Songaila, A., & Hall, D., 1999, AJ, 117, 102
- (3)
- (4) Blanton, M.R. et al. 2001, AJ, 121, 2358
- (5)
- (6) Brandt, W.N., Alexander, D.M. et al. 2001b, AJ, in press (Paper V)
- (7)
- (8) Brandt, W.N., Hornschemeier, A.E. et al. 2001a, AJ, 122, 1 (Paper IV)
- (9)
- (10) Brandt W.N., Hornschemeier, A.E. et al. 2001c, ApJL, 558, 5 (Paper VII)
- (11)
- (12) Cohen, J.G., Hogg, D.W., Blandford, R., Cowie, L.L., Hu, E., Songaila, A., Shopbell, P., & Richberg, K. 2000, ApJ, 538, 29
- (13)
- (14) Cohen, J.G. et al. 2001, AJ, 121, 2895
- (15)
- (16) David, L. P., Jones, C., & Forman, W. 1992, ApJ, 388, 82
- (17)
- (18) Dawson, S.A., Stern, D., Bunker, A.J., Spinrad, H., & Dey, A. 2001, AJ, 122, 598
- (19)
- (20) Fabbiano, G. & Shapley, A.E. 2001, ApJ, submitted
- (21)
- (22) Fernández-Soto, A., Lanzetta, K.M., & Yahil, A. 1999, ApJ, 513, 34
- (23)
- (24) Freeman, P.E., Kashyap, V., Rosner, R., & Lamb, D.Q. 2002, ApJ, in press
- (25)
- (26) Garmire, G.P., et al. 2001, ApJ, submitted
- (27)
- (28) Ghosh, P. & White, N.E. 2001, ApJL, in press
- (29)
- (30) Hornschemeier, A.E., Brandt, W.N., et al. 2001, ApJ, 554, 742 (Paper II)
- (31)
- (32) Kim, D.-W., Fabbiano, G., & Trinchieri, G. 1992, ApJ, 393, 134
- (33)
- (34) Lyons, L. 1991, Data Analysis for Physical Science Students. Cambridge University Press, Cambridge
- (35)
- (36) Madau, P., Ferguson, H. C., Dickinson, M. E., Giavalisco, M., & Steidel, C. C., & Fruchter, A. 1996, MNRAS, 283, 1388
- (37)
- (38)
- (39) Poggianti, B.M. 1997, A&AS, 122, 399
- (40)
- (41) Ptak, A., Griffiths, R., White, N., & Ghosh, P. 2001, ApJ, in press
- (42)
- (43) Richards, E.A., Kellermann, K.I., Fomalont, E.B., Windhorst, R.A., & Partridge, R.B. 1998, AJ, 116, 1039
- (44)
- (45) Richards, E.A. 2000, ApJ, 533, 611
- (46)
- (47) Shapley, A.E., Fabbiano, G., & Eskridge, P.B. 2001, ApJ, in press
- (48)
- (49) Siegel, S. & Castellan, N. 1988, Nonparametric Statistics for the Behavioral Sciences. McGraw-Hill, Boston
- (50)
- (51) Tozzi, P. et al., 2001, ApJ, in press
- (52)
- (53) van den Bergh, S., Cohen, J.G., & Crabbe, C. 2001, AJ, 122,611
- (54)
| Redshift | Median | Median | Median | |||
|---|---|---|---|---|---|---|
| Range | SEDa | b | /c | e | ||
| SPECTROSCOPIC SAMPLE | ||||||
| 0.40–0.75 | Sc | 0.635 | 6.34 | 21.73 | 29 | 12/6 |
| 0.75–0.90 | Sc | 0.821 | 7.39 | 21.83 | 38 | 2/2 |
| 0.90–1.10 | Sc | 0.960 | 8.05 | 22.29 | 30 | 6/4 |
| PHOTOMETRIC SAMPLE | ||||||
| 0.50–1.00 | Sc | 0.920 | 7.87 | 22.99 | 37 | 9/4 |
| 1.00–1.50 | Sc | 1.200 | 8.97 | 24.28 | 64 | 6/2 |
| 1.00–1.50 | Sa | 1.240 | 9.09 | 24.69 | 80 | 8/2 |
| Redshift | ||||||||||||
|---|---|---|---|---|---|---|---|---|---|---|---|---|
| Range | SED | Countsa | Significanceb | (Ms) | (10-17 erg cm-2 s-1) | (1040 erg s-1) | (1043 erg s-1) | |||||
| FB | SB | FB | SB | FB | SB | FB | SB | FB | SB | |||
| SPECTROSCOPIC SAMPLE | ||||||||||||
| 0.40–0.75 | Sc | 49.6 | 31.7 | 99.99 | 25.41 | 25.44 | 1.52 | 0.65 | 2.94 | 1.26 | 0.67 | |
| 0.75–0.90 | Sc | 58.0 | 36.4 | 33.05 | 33.09 | 1.36 | 0.57 | 4.92 | 2.07 | 1.33 | ||
| 0.90–1.10 | Sc | 54.4 | 25.9 | 26.54 | 26.56 | 1.60 | 0.51 | 8.44 | 2.68 | 1.40 | ||
| PHOTOMETRIC SAMPLE | ||||||||||||
| 0.50–1.00 | Sc | 42.0 | 33.5 | 99.77 | 34.51 | 34.54 | 0.95 | 0.51 | 4.51 | 2.40 | 1.12 | |
| 1.00–1.50 | Sc | 44.8 | 38.5 | 98.94 | 59.67 | 59.73 | 0.58 | 0.34 | 5.34 | 3.06 | 0.79 | |
| 1.00–1.50 | Sa | 45.6 | 34.2 | 98.29 | 99.95 | 74.61 | 74.68 | 0.48 | 0.24 | 4.70 | 2.36 | 0.81 |