History of mass assembly and star formation in clusters
Abstract
We present deep, panoramic multi-color imaging of the distant rich cluster A 851 () using Suprime-Cam on Subaru. These images cover a 27′ field of view ( Mpc), and by exploiting photometric redshifts, we can isolate galaxies in a narrow redshift slice at the cluster redshift. Using a sample of probable cluster members (), we trace the network of filaments and subclumps around the cluster core. The depth of our observations, combined with the identification of filamentary structure, gives us an unprecedented opportunity to test the influence of the environment on the properties of low luminosity galaxies. We find an abrupt change in the colors of faint galaxies () at a local density of 100 gal. Mpc-2. The transition in the color-local density behavior occurs at densities corresponding to subclumps within the filaments surrounding the cluster. Identifying the sites where the transition occurs brings us much closer to understanding the mechanisms which are responsible for establishing the present-day relationship between environment and galaxy characteristics.
1Dept of Astronomy, Univ of Tokyo,
Bunkyo-ku, Tokyo 113–0033, Japan
2Dept of Physics, Univ of Durham, South Road,
Durham DH1 3LE, UK
1. Introduction
Clusters of galaxies are continuously growing through the accretion of galaxies and groups from the field. The star formation activity in the accreting galaxies must be quenched during the assimilation of the galaxies into the cluster. This transformation is a key process in creating the environmental dependence of galaxy properties, and may also underpin the observed evolution of galaxy properties in distant clusters [e.g. 1.2] However, the physical mechanism which is responsible for these changes has not yet been identified [3,4,5].
The advent of Suprime-Cam, a revolutionary wide-field camera on the Subaru telescope, has opened a new window in this field. Its 27′ field of view can trace the variation of galaxy properties from the cluster cores out to the surrounding field in an attempt to identify the environment where the decline in the star formation in accreted galaxies begins.
2. Large scale structure
As a first step towards a systematic study of distant clusters with Subaru and Suprime-Cam, we obtained deep () imaging of the rich cluster A 851 at z=0.4. We constructed an I-band selected sample which contains 15,055 galaxies brighter than .
In order to assign cluster membership across our large field and to faint magnitudes, we applied photometric redshift technique [6] to isolate the galaxies in a narrow redshift slice around the cluster redshift. By applying the redshift cut of , we can reduce the field contamination by factor 10 at , while keeping most of the cluster members (80%, from the estimate using the spectroscopic members [7]).
After this photometric redshift selection, it is straightforward to map out the distribution of galaxies which are likely to be associated with the cluster. As shown in Fig. 1, several large scale structures are visible around the cluster core, comprising many clumps and filamentary extensions coming out directly from the core. Importantly, most of these extensions from the core are aligned with the surrounding subclumps.
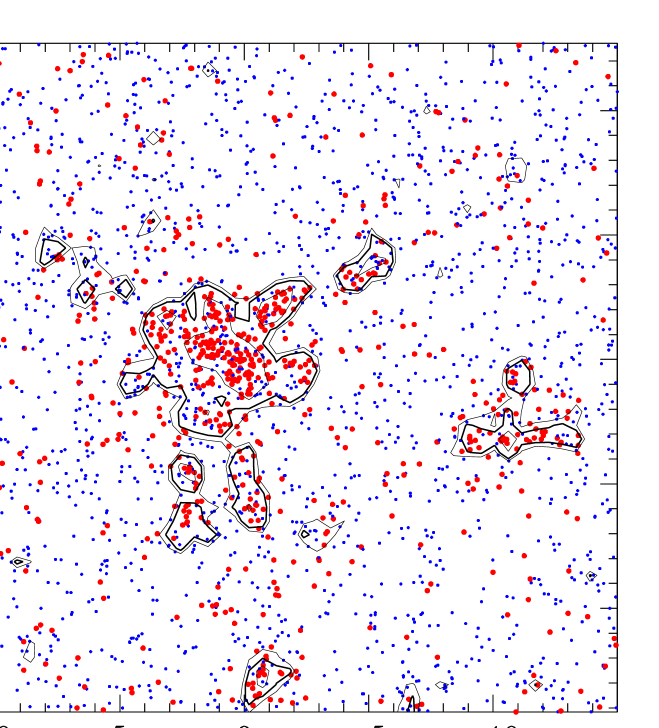
The structures identified in this region are qualitatively similar to those seen in cosmological simulations of the growth of clusters which exhibit the filamentary/clumpy substructures on similar scales [e.g. 8] It appears therefore that we are witnessing A 851 as it assembles through the accretion of galaxies and groups along the filaments onto the cluster core from the surrounding field.
2.1. Environmental dependence of galaxy properties
By exploiting the striking large scale structure around this cluster, we can investigate the influence of environment on the photometric properties of galaxies. We define the environment for each galaxy using the local surface number density, , of members, calculated from the 10 nearest neighbors. We statistically subtract residual field contamination using a Subaru blank field data [9].
We divide the density distribution into three regimes as indicated in Fig. 2a. There is a close correspondence between the local density and structure: the high density region corresponds to the cluster core within Mpc; the medium density region includes the structures defining the filaments surrounding the cluster; and the low density region comprising the rest of the volume (Fig. 1).
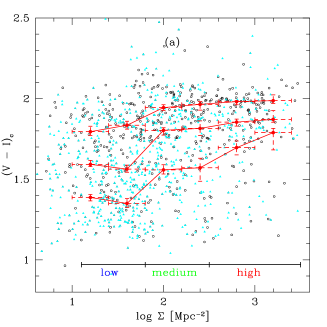
As shown in Fig. 2a, the color distribution in the high density region is strongly peaked at , the color of an early-type cluster member. However, as we move to lower densities, the distribution becomes dramatically bluer. Notably, this color transition with local density occurs quite abruptly at , indicating a threshold effect in transforming galaxy properties. The boundary corresponding to this critical density is highlighted in Fig. 1. Surprisingly, this transition occurs in subclumps well outside the core.
Our ability to pin-point this environment is a fundamental step towards identifying the dominant mechanism behind the environmental dependence of galaxy properties. Since the ram-pressure stripping is largely supressed in groups [4], the effective mechanism at this hierarchy is either galaxy–galaxy collisions (which cause cold disk gas to be driven to the galaxy center creating a star burst [3]); and ‘suffocation’ (where warm gas in the galaxy’s halo is shock heated by the intra-cluster medium so that it can no longer cool and replenish the cold gas in the disk [10]). Our data do not distinguish directly between these possibilities, but they can be distinguished by tracing the variation in the individual components of galaxies, bulges and disks, between the cluster and the field.
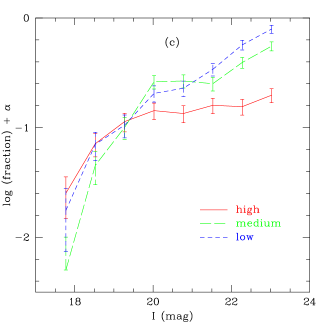
It is important to note that the changes in galaxy properties as a function of local density are most prominent in faint galaxies (). This is mirrored to the dramatic change in the shape of the luminosity function with local galaxy density: where we see a steepening of the faint end slope of the luminosity function with decreasing density (Fig. 2c). Assuming that their star formation effectively ceases, the relative absence of low-luminosity galaxies at projected densities of can be understood as they will fade by mag as their star formation declines [2]. This will put many of their descendents below our magnitude limit. This is also qualitatively consistent with the presence of large numbers of very low luminosity, , passive dwarf galaxies in local clusters [11]
Acknowledgments.
We are grateful to Dr Y. Komiyama for his assistance during our observations. We acknowledge the Suprime-Cam team for allowing us to use the blank field data. We also thank Drs. M. Balogh, N. Arimoto and K. Shimasaku for helpful discussion. TK and FN acknowledge the Japan Society for the Promotion of Science for support through its Research Fellowships for Young Scientists. IRS acknowledges support from the Royal Society and the Leverhulme Trust.
References
[1] Butcher, H., Oemler, A., 1984, ApJ, 285, 426
[2] Kodama, T., Bower, R. G., 2001, MNRAS, 321, 18
[3] Moore, B., Katz, N., Lake, G., Dressler, A., Oemler, A., 1996, Nature, 379, 613
[4] Adabi, M. G., Bower, R. G., Navarro, J. F., 2000, MNRAS, 314, 759
[5] Balogh, M. L., Navarro, J. F., Morris, S. L., 2000, ApJ, 540, 113
[6] Kodama, T., Bell, E. F., Bower, R. G., 1999, MNRAS, 302, 152
[7] Dressler, A., Smail, I., Poggianti, B. M., Butcher, H., Couch, W. J., Ellis, R. S., Oemler, A., 1999, ApJS, 122, 51
[8] Ghigna, S., Moore, B., Governato, F., Lake, G., Quinn, T., Stadel, J., 1998, MNRAS, 300, 146
[9] Ouchi, M., et al., 2001, ApJ, 558, L83
[10] Larson, R. B., Tinsley, B. M., Caldwell, C. N., 1980, ApJ, 237, 692
[11] Binggeli, B., Sandage, A., Tammann, G. A., 1988, ARA&A, 26, 509