Automated classification of variable stars for ASAS data
Abstract
With the advent of surveys generating multi-epoch photometry and their discoveries of large numbers of variable stars, the classification of the obtained times series has to be automated. We have developed a classification algorithm for the periodic variable stars using a Bayesian classifier on a Fourier decomposition of the light curve. This algorithm is applied to ASAS (All Sky Automated Survey, Pojmanski 2000). In the case of ASAS, 85% of variable objects are red giants. A remarkable relation between their period and amplitude is found for a large fraction of those stars.
Princeton University Observatory, Princeton, NJ 08544, USA
1. Introduction
In its test-implementation, the ASAS project measured 50 fields ( deg2 each) in -band with a 135 mm f/1.8 telephoto lens during the years 1997-2000. Pojmanski detected about 3900 variables stars, he listed among them 380 periodic variable stars. We propose an automated method which classifies a subsample from ASAS stars in a two step procedure by: 1) finding a satisfactory Fourier decomposition for the light curve, 2) applying Autoclass (Cheesemen 1996), a Bayesian classifier, on the parameters obtained for each light curve. Several tests were done and the best classification was obtained when Period, Amplitude, Skewness and Amplitude ratio (first overtone/fundamental amplitudes of the Fourier decomposition) were used as the input parameters. The subsample is formed by 458 stars which have a fair periodic behaviour, and some time series with aliasing periods have been removed.
2. Results
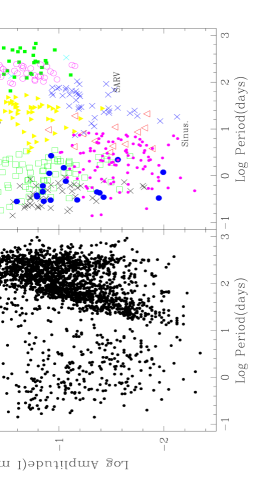
For a fraction of red giant stars, a clear relation between period and amplitude can be seen (cf. Fig. 1, left). This relation is also seen in infrared photometry (van Loon, these proceedings). The classes found are (see Fig. 1, right): small amplitude and sinusoidal curves (100), Eclipsing binaries (144), Cepheids (48), SARV (40), SR (81), Mira (45). The RR Lyrae stars are too few (too faint) to form a group, so they might be recovered as extreme objects in some classes. Some classes are divided in subgroups. For instance, the eclipsing binaries are classified in three subgroups, which correspond approximately to EA, EB, and EW, but with some mixture. The decomposition in Fourier series is not optimal for such a separation. Principal components analysis will be applied to separate the different types of eclipsing systems. The subgroups of SRs will be studied to see if they corresponds to real physical distinctions.
3. Conclusion
With the method we propose on the ASAS sample, we show that an Automated Classification can be reached with a level of incorrect classification of about 5%. This rate has to be reduced when very large datasets will be considered. There are, of course, irreducible classification ambiguities from the light curve alone (e.g. RRc and eclipsing binaries of EW type unless measured with very accurate photometry), but multi-colour photometry and/or spectroscopy can help to lift the ambiguity.
Our acknowledgements go to Prof. B.Paczynski, Dr C.Alard & Dr A.Gautschy for their fruitful discussions and comments.
4. Internet Links
ASAS Home Page: http://archive.princeton.edu/∼asas/
For this work: http://www.astro.princeton.edu/∼leyer/ASAS/
See also HAT Home Page: http://www.astro.princeton.edu/∼bakos/HAT
References
Cheeseman, P., Stutz, J. 1996, ”Bayesian classification (AutoClass): Theory and results” in Advances in Knowledge Discovery and Data Mining, U.M. Fayyad, G.Piatetsky-Shapiro, P.Smyth, & R.Uthurusamy, Eds.
Pojmanski, G. 2000, AcA 50, 177