Chandra Analysis of Abell 496
Abstract
We present preliminary results of imaging and spectral analysis of the cluster A496 with the S3 chip on-board the Chandra satellite. We confirm the presence of a cooling flow and radial gradients in elemental abundances. The cluster’s core has clear signs of substructures (sharp edges, cavities), similar to those recently found in other cooling flow clusters. The O/Fe ratio distribution indicates that the gas in the core of the cluster is significantly enriched by SN Ia ejecta.
University of Michigan, Ann Arbor
University of Alabama, Tuscaloosa
1. Introduction
The detection of emission lines in the X-ray spectra of clusters shows the presence of heavy elements in the ICM. This fact alone shows that the ICM cannot be completely primordial. A significant part of the gas has been contaminated by supernovae enriched material, most likely ejected from cluster galaxies. Competing metal enrichment mechanisms, such as protogalactic winds, ram pressure stripping, etc., are powered by different SN Types. Therefore, their relative importance can be assessed if the spatial distribution of SN Type contamination is known.
The latter can be obtained through spatially resolved X-ray spectroscopy (e.g. Mushotzky et al. 1996). Since SN Ia and II explosions produce different amounts of different elements, the SN Ia/II contamination fraction in the ICM can be determined through the X-ray measurements of individual elemental abundances (e.g. O, Si, S, Fe, Ni) and their ratios. For example, SNe Ia produce roughly five times less Si than Fe (by mass) and SNe II produce in average 30% more Si than Fe. X-ray spectroscopic determinations of Si and Fe abundances can then be used to determine the fraction of the elements in the ICM that came from SN Ia and II, and also the spatial variation of this fraction within the cluster.
Using arguments based on the energetics of the intracluster gas, White (1991) has shown that protogalactic winds significantly pollute the ICM with heavy elements. Early Einstein FPCS spectroscopy (Canizares et al. 1982) and more recent ASCA spectroscopy (Mushotzky & Loewenstein 1997; Mushotzky et al. 1996) showed that global intracluster metal abundance ratios are consistent with ejecta from Type II supernovae, which supports the protogalactic wind model for ICM metal enrichment.
However, more recently, ASCA spatially resolved spectra of some nearby cool (T 5keV) clusters and groups indicates a significant SN Ia contamination within the cluster’s central regions (e.g. Dupke & Arnaud 2001; Dupke & White 2000; Finoguenov et al. 2000; Allen et al. 2000), which suggests that a combination of ram-pressure stripping & SN Ia secondary winds may be also effective in injecting metals into the ICM.
Abell 496 is a typical, bright, nearby (z0.03), well-behaved cooling flow cluster. In a Ginga + Einstein analysis, White et al. (1994) detected a central abundance enhancement in this cluster. This central abundance enhancement was corroborated by ASCA (e.g. Dupke & White 2000), SAX (Irwin & Bregman 2001) and XMM (Tamura et al 2001). Furthermore, Dupke & White (2000) also detected radial gradients of abundance ratios, which showed that the gas in the central regions had been significantly contaminated by SN Ia ejecta. Our Chandra observations of the central regions of A496 allow us to expand the measurements of abundance and abundance ratios to smaller spatial scales (down to 1′) and also to obtain well-constrained abundances of elements that have high SN-Type discriminatory power such as Oxygen.
2. Data Reduction
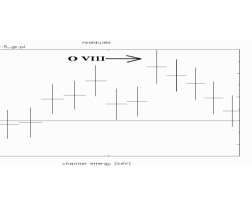
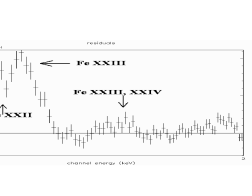
We used Ciao 2.1 with caldb 2.3. The data was screened as prescribed in the Threads page111asc.harvard.edu/ciao2.1/documents_threads.html, complemented by the extended source reduction procedures by J. McDowell222asc.harvard.edu/ciao/wrkshp_ps.html with the response tools developed by A. Vikhlinin333http://hea-www.harvard.edu/j̃cm/asc/dist/av/av103.tar. Approximately 70% of the data was seriously affected by background flares and was not used in this analysis. Both blank-sky444hea-www.harvard.edu/m̃axim/axaf/acisbg/ and local (from the S1 chip) backgrounds were tried. The latter was found to minimize flare contamination effects better. Thermal emission models mekal & Vmekal (individual abundances are free to vary) were used within XSPEC 11 to fit X-ray spectra. An isobaric cooling flow model Cflow, was used for the spectral fittings of the inner regions where the minimum temperature was either frozen at 0.1 keV or let free to vary. Some spurious spectral features were seen around 2 keV and are probably related to background correction uncertainties. Here we only show here the results of the well-constrained abundance distributions of O and Fe (Fig 2).
3. Results and Discussion
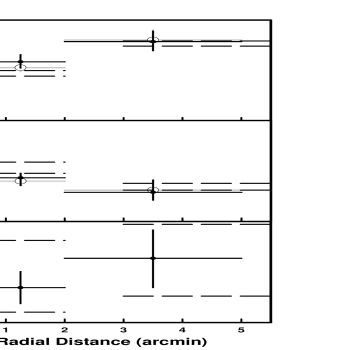
Fig 2 shows the radial distribution of temperature and abundances in the central 5′ of the cluster. A negative temperature gradient is clearly seen, consistent with the presence of a cooling flow. There are indications that the minimum gas temperature of the cool gas component is 1 keV. The spectral fits when the elemental abundances were let free to vary (Vmekal) were significantly better than those where the abundances are tied to the solar ratios (large circles with brighter errorbars). This is most likely due to abundance ratios being strongly non-solar within the central regions. The best-fit values of this model (added to a cooling flow component in the central regions) are indicated by the solid plots.
Previous results obtained with ASCA by the authors are displayed by the dashed lines (90% confidence limits) for the inner (0′-2′) and outer (3′-12′) regions obtained with the same spectral models as those used here. There was a significant improvement (99.9% confidence in the F-test) when the minimum temperature (Tmin) in the cooling flow model was let free to vary. The best-fit Tmin was found to be 10.2 keV. The Fe abundance gradient is confirmed. The gradient is apparently present even at very small scales (within 2′), where the Fe abundance in the very center is found to be as high as 0.7 solar. The Oxygen abundance shows a significant radial enhancement, rising from 0.15 solar in the central 30′′ to 0.7 solar at 2′, which is consistent with previous ASCA results, but marginally consistent with recent XMM analysis of this cluster (Tamura et a. 2001).
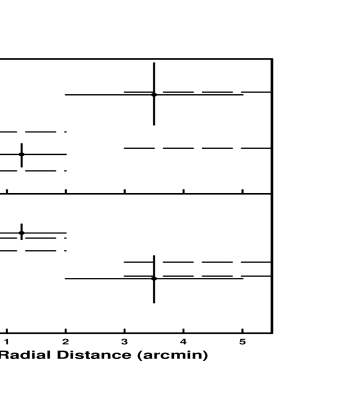
Fig. 3 shows the radial distribution of the O/Fe ratio and the correspondent SN Ia contamination (using SN yields of Nomoto et al. 1997a, b). The errors are 1-, and the confidence limits showed (dashed) for the bottom plot correspond to the SN Ia Fe mass fraction determined with ASCA from an ensemble of abundance ratios including O, Si, Ne, Fe and Ni).
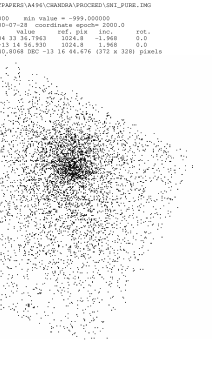
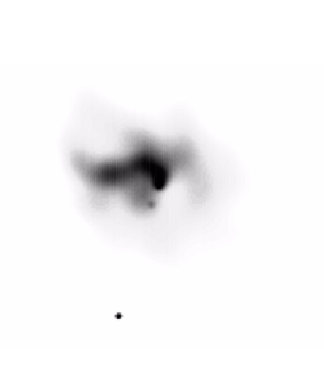
The nature of the gradients in the radial distribution O (positive) and Fe (negative) implies on a positive gradient of the O/Fe abundance ratio. This gradient can be associated to a gradient of SN Type responsible for the gas enrichment. For comparison the O/Fe ratio for ”pure” SNe Ia is 0.03 and for SNe II is 3.8. The O/Fe ratio in the ICM of A496 varies from 0.2 in the very center (implying that the 90 % of the metals come from SN Ia) to 2.2 at 2′, where an even mix of SN Ia and II contribution is implied. Fig.4 (left) shows a “SN Ia” map of the cluster. The map is obtained by dividing images taken within the FeL energy range by the O energy range image. The continuum is subtracted by selecting similar images within nearby frequencies. It can be seen that SN Ia distribution is enhanced towards the center.
The results above are consistent with the double wind scenario for ICM metal enrichment proposed by Dupke & White (2000). A vigorous protogalactic winds that injects metals produced by SN II uniformly into the ICM followed by a secondary, less energetic SN Ia dominated wind, which is partially suppressed at the cluster’s center due to the high ambient intracluster gas density at the bottom of the clusters gravitational potential.
Multiple X-ray filaments can be seen in the central region of A496 (Fig4, right). In particular a bright filament is detected extending from the nucleus to the East. The X-ray filament extension is 20′′ (19 kpc). Radio emission (VLA 1.4 GHz) of the region around the cD, MCG 02-12-039 is slightly extended towards the direction of the X-ray filament. There are optical emission filaments in the central regions of A496 (Fabian et al. 1981). However, the optical data is not spatially resolved enough for a fine comparison. The X-ray central structures are seen mostly at the medium energy range (0.8-1.5 keV). A more detailed discussion about the morphological structures in A496 will be made in a future work (Dupke & White 2001).
References
Allen, S. W. et al. 2000, MNRAS, 322, 589
Canizares, C. et al. 1982, ApJ, 262, 33
Dupke, R. & Arnaud, K. 2001, ApJ, 548, 141
Dupke, R. & White, R. III 2000, ApJ, 537, 123
Dupke, R. & White, R. III 2001, in preparation
Fabian, A. et al 1981, MNRAS, 196, 35
Finoguenov, A et al. 2000, ApJ, 544, 188
Irwin, J. & Bregman, J. 2001, ApJ, 546, 150
Mushotzky, R. F. et al. 1996, ApJ, 466, 686
Mushotzky, R. F. & Loewenstein, M. 1997, ApJ, 481, L63
Nomoto, K. et al. 1997a, Nuclear Physics A, Vol. A621, 467c
Nomoto, K. et al. 1997b, Nuclear Physics A, Vol. A616, 79
Tamura, T. et al. 2001, AA, accepted (astro-ph/0109387)
White, R. E. III 1991, ApJ, 367, 69