First results from multi-wavelength observations during the 2001 outburst of WZ Sge
Abstract
WZ Sge has shown superoutbursts in 1913, 1946 and 1978. On 2001 July 23 a new outburst was announced, about 10 years ‘too early’. Target of opportunity satellite observations with Chandra, FUSE, HST and RXTE were performed throughout the outburst. From the ground WZ Sge was monitored by numerous professional and amateur astronomers, in the optical, IR and radio. We give an account of the first exciting results from these multi-wavelength observations.
SRON, National Institute for Space Research, Sorbonnelaan 2, 3584 CA Utrecht & Astronomical Institute, Utrecht University, P.O. Box 80000, 3508 TA Utrecht, The Netherlands
Department of Physics & Astronomy, University of Southampton, Highfield, Southampton, SO17 1BJ, UK
Department of Physics & Astronomy, University of Leicester, University Road, Leicester, LE1 7RH, UK
Space Telescope Science Institute, 3700 San Martin Drive, Baltimore, MD 21218, USA
1. Introduction
The cataclysmic variable (CV) WZ Sge was classified as a recurrent nova after it had displayed the outbursts in 1913 and 1946 (Mayall 1947). However, subsequent optical observations showed the source to be a dwarf nova (e.g. Warner 1976). Its class was finally established during the outburst in 1978, when the source displayed superhumps at a period which was about 0.8% longer than the orbital period, thus showing it to be an SU UMa star (e.g. Patterson et al. 1981). WZ Sge, in fact, belongs to the ‘extreme’ SU UMa subclass named after itself, i.e. the WZ Sge stars. They exhibit very infrequent and large amplitude [super]outbursts (e.g. Bailey 1979).
Mass estimates of the white dwarf range from 0.25–1.2 M⊙ (e.g. Patterson 1998). During the 2001 outburst, Steeghs et al. (2001b) detected the secondary (see Sect. 3.2) and found that the donor has a relatively low mass of 0.1 M⊙ (see also Patterson 2001). The derived mass function implies that the white dwarf has a mass 0.77 M⊙. Binary evolution models predict that all CVs should eventually evolve through a minimum orbital period around 70 min, when the mass donor becomes degenerate. With an orbital period of 81.6 min (Krzemiński 1962; see Skidmore et al. 2000, for a latest update), WZ Sge is close to that minimum period. The inclination at which we view the source is 75∘, just high enough for the donor to obscure the accretion disk but not the white dwarf (Krzemiński 1962; Smak 1993). The white dwarf rotates rapidly (Cheng et al. 1997) at a period near 28 s (Patterson et al. 1998; Lasota, Kuulkers & Charles 1999, and references therein; but see Skidmore et al. 1999).
At the distance of 45 pc (astrometric parallax, J. Thorstensen 2001, priv. comm.) it is one of the closest CVs. When in outburst it is therefore bright (up to 7.5–8 mag), providing an excellent target to investigate the accretion of matter from the donor, through the disk, onto the white dwarf, not only for professionals but also for amateur observers.
2. The 2001 outburst
On Monday 2001 July 23, the astronomical community was alerted by the Variable Star Network (VSNET)111http://www.kusastro.kyoto-u.ac.jp/vsnet/Mail/alert6000/msg00093.html that WZ Sge had brightened considerably by 5.5 mag from its quiescent magnitude of 15.5 (Ishioka et al. 2001a; Mattei 2001). Based on the times of three previous outbursts a new outburst had not been expected until 2011. The 2001 outburst therefore seemed to be 10 years ‘too early’. However, we note that although the superoutburst recurrence times of SU UMa stars are quite stable, they do change from time to time (Vogt 1980).

In Fig. 1 we show the visual and other optical observations of the 2001 outburst as reported to VSNET222For an excellent optical coverage and many examples of light curves we refer to the VSNET webpage dedicated to WZ Sge: http://www.kusastro.kyoto-u.ac.jp/vsnet/DNe/wzsge01.html. (see also Ishioka et al. 2001b). Within half a day WZ Sge brightened from its quiescence level to about 10.5 mag. It peaked at 8 mag, giving a large outburst amplitude of about 7.5 mag. The main outburst lasted for about 25 days, after which it displayed a dip of 2 mag lasting for about 5 days. It then showed irregular rebrightening/outburst behaviour for another month. It then declined to 13.5 mag; since then no new rebrightening has been observed, and the superoutburst seems to have ended.
Also in Fig. 1 we have overplotted in gray the previous observed outbursts (visual, photometric and photographic measurements; from Kuulkers 1999). Clearly, the 2001 outburst resembles the 1978 outburst, except for the fact that the durations of the main outburst and the outburst stage after the dip were shorter (about 5 days and 10 days, respectively) for the 2001 outburst. Note that the brightness after the 2001 outburst is still about 2 mag above quiescence, at the same level as after the 1946 outburst. This is due to the hot white dwarf, see Sect. 3.4.
Both ‘orbital superhumps’ (Kato et al. 2001a), commonly observed in the beginning of the superoutbursts of WZ Sge-stars, and ‘true’ (Kato et al. 2001b) superhumps were present. The true superhumps appeared about two weeks into the outburst, whereas at the same time the orbital superhumps died away. Note that the change from orbital to true superhumps is not abrupt. They overlap and coexist in the light curves for a few days, suggesting a different nature.
The superoutburst of WZ Sge was extensively monitored from the ground and from space333See http://www.astro.soton.ac.uk/ds/wzsge.html.. In the next sections we give an account of the first results from (mainly spectroscopic) observations at optical, UV and X-ray wavelengths in which we have been involved, as well as a few radio observations.
3. Multi-wavelength observations during the 2001 outburst
3.1. Radio observations: no detection
Various radio observations (VLA: 3.6 cm, 6 cm; V. Dhawan, M. Rupen 2001, priv. comm.; Ryle: 2 cm; G. Pooley 2001, priv. comm.) were performed between July 24 and Aug 9, but yielded no detections. Upper limits on e.g. Aug 4 were 0.12 and 0.18 mJy per beam at 3.7 and 6 cm, respectively (M. Rupen 2001, priv. comm.).
3.2. Optical spectroscopy: spiral waves and secondary star
One of the first (July 23.74) optical spectra showed H and H lines in absorption on top of a blue continuum (Ishioka et al. 2001a). About a day later the spectra had changed dramatically, now showing strong double-peaked emission lines of e.g. He II (4686Å) and C III and N III. H showed both emission and absorption features similar to P Cyg profiles, whereas higher series were seen as broad absorption features. The emission profiles showed variations on the orbital period (Baba, Sadakane & Norimoto 2001).
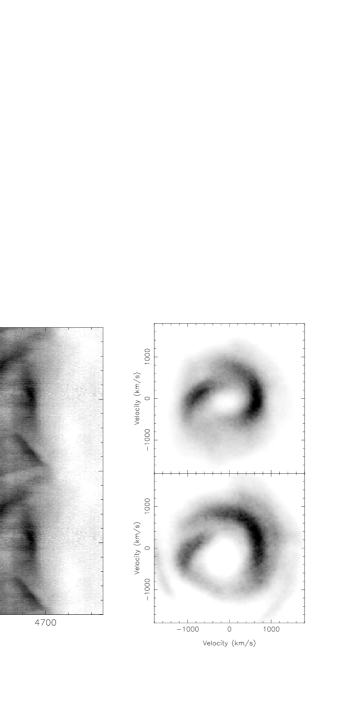
Service override observations on the 2.5 m INT at La Palma (PI: Steeghs) were performed between July 28.02–28.24 (see Fig. 1), yielding high resolution phase resolved spectra (Steeghs et al. 2001a). The same emission lines as seen by Baba et al. (2001) were present. In Fig. 2 we display the phase dependent emission profiles of He II (4686 Å) and the nearby Bowen fluorescence complex. The Bowen blend consists of several C III and N III transitions, but is dominated by C III and closely reflects the line kinematics of He II. The corresponding Doppler tomograms (Marsh & Horne 1988) are also plotted in Fig. 2 and reveal prominent spiral arms in the accretion disk of WZ Sge. These two armed structures are very similar to those observed in longer period dwarf novae during outburst (Steeghs 2001, Boffin & Steeghs, these proceedings). On the other hand, the Balmer and He I lines are dominated by deep, phase dependent absorption components. We conjecture here that the observed spiral arms are related to the orbital superhumps. A more detailed comparison between the observed disk structure with the photometric behaviour may shed light on this.
Spectroscopy obtained during later phases of the outburst revealed growing narrow emission components in the Balmer lines originating from the irradiated secondary star (Steeghs et al. 2001b). Such emission features from the secondary are commonly observed in CVs during outburst, as well as persistent X-ray binaries such as Sco X-1 (Steeghs & Casares 2001). For WZ Sge this provided the first opportunity to directly reveal its low-mass secondary star. Apart from the appearance of secondary star features, the accretion disk emission also makes a significant transition from strong spirals arms to a disk flow dominated by an extended bright spot around 20 days into the outburst. The large amount of optical spectroscopy obtained during the 2001 outburst of WZ Sge should shed important insights into the evolution of the accretion disk.
3.3. X-ray observations: RXTE and Chandra

A 10-min snapshot was performed with RXTE on the same evening of the discovery (UT July 23, 20:40), followed by a 30-min observation on July 27 06:40 (UT). No detections were made with 95% confidence upper limits of 5.310-12 erg cm-2 s-1 and 3.710-12 erg cm-2 s-1 (2–6 keV), respectively, assuming a typical 6 keV MEKAL spectrum. We note that due to the limited sensitivity of RXTE we can not say whether there is an X-ray delay with respect to the optical outburst, commonly observed in outbursts of dwarf novae.
Three Chandra/LETGS (PI: Wheatley) and four Chandra/ACIS-S (PI: Kuulkers) observations were performed throughout the outburst, see Fig. 1. Note that the second RXTE observation was simultaneous with the first Chandra/LETG observation. XMM-Newton and BeppoSAX were unable to observe WZ Sge due to viewing constraints.
The first Chandra/LETGS observation was carried out three and a half days into the outburst (Wheatley et al. 2001). The mean zeroth-order count rate was 4.5 c s-1, showing the source to be bright, and was modulated with the orbital period. In Fig. 3 we show the averaged 20 ksec grating spectrum, which had a mean count rate of 20 c s-1. The superb spectrum shows a ‘forest’ of broad emission lines longward of 65Å from e.g. O V–VII, Ne V–VIII, Fe VII–IX. The FWHM of these lines are between 800–1200 km s-1 (see e.g. left panel of Fig. 6). At shorter wavelengths (65 Å) one sees weaker lines of highly ionized ions, with O VIII (18.9 Å) standing out. The mean flux in the 2–180 Å band was 1.610-12 erg cm-2 s-1.
The long wavelength spectrum resembles the EUVE spectra taken during an outburst of U Gem between orbital phase 0.6–0.8 (Long et al. 1996), as well as during a superoutburst of OY Car (Mauche & Raymond 2000). Both U Gem and OY Car are high-inclination systems, like WZ Sge. The forest of broad lines may therefore be formed by scattering of emission from the white dwarf’s vicinity into the photo-ionized accretion disk wind. Note that some direct optically-thick boundary layer emission is still visible in the case of U Gem. During the second LETGS observation on Aug 6 this component had faded considerably. The mean zeroth-order count rate had dropped to 0.2 c s-1.
The first ACIS-S444Covering 0.2–10 keV or 1.2–60 Å. observation (2.5 c s-1) starting on July 29 16:50 (UT) showed the spectrum to be also dominated by strong emission lines, although they were not as well-resolved as in the LETGS spectrum, due to the much lower energy resolution. A strong emission line was seen near (2.4 keV, 5.2 Å), probably associated with He-like S XV, which cannot be accounted for using an optically-thin thermal plasma model.
3.4. UV observations: FUSE and HST

The only satellite observations during previous outbursts are those obtained by IUE in 1978, from the start of the outburst up to the first dip in the outburst light curve (Fabian et al. 1980; Naylor 1989; Smak 1993, and references therein).
Several FUSE (PI: Long) and HST observations were performed during the 2001 outburst (see Fig. 1). The first HST observations were mainly aimed at orbital phase resolved UV spectroscopy (PI: Knigge). The other HST observations (PI: Sion) will continue way after the outburst, and will (among other things) permit detailed study of the cooling white dwarf (see also below). Note that the third HST observation was simultaneous with the third Chandra/ACIS-S observation.
The mean spectrum of the FUSE observation on July 30 (Fig. 4) is dominated by a broad line feature due to O VI. The EW of this feature is between 50 and 60Å, depending on how you treat the narrow features which punctuate it. Its FWZI is close to 9000 km s-1. The absorption features which interrupt the emission profile of O VI are blue shifted by about 300 km s-1 from the rest wavelengths of the O VI doublet. The average flux between 1050 and 1150 Å was 610-12 erg cm-2 s-1 Å-1. The narrow absorption lines seen in the spectrum are due to interstellar hydrogen. There is no evidence of molecular H or of metal absorption lines, which is expected given WZ Sge’s proximity.

This observation preceded the first HST observation taken nine days later (see below), but in fact the continua of the FUSE and the HST spectrum match up pretty well in the overlap region. It is, therefore, reasonable to say that the line spectrum associated with the 1s–2p lines of Li-like O, N, and C indicates a very high excitation spectrum. The continuum spectrum, on the other hand, is punctuated by a lot of features mostly associated with lower ionization. The line widths of the unblended lines are all of order 500–700 km s-1. They are somewhat reminiscent of outburst spectra of U Gem obtained with FUSE (Froning et al. 2001; Froning et al., these proceedings).
Fig. 5 shows the mean HST/STIS spectrum obtained on Aug 8; the average flux between 1150 and 3100 Å was 2.310-12 erg cm-2 s-1 Å-1. Broadened emission lines from N V and C IV are seen, as well as some He II. Shortward of 1410 Å, a lot of strong broadened absorption lines are present, associated with C, S, Si and O. Above 1410 Å the strongest absorption lines are from Al III (1850–1860 Å) and Mg II (2790–2810 Å). The others are most probably associated with Fe. Note that some part of the Mg II absorption has an interstellar origin. Still, most of it is due to the source, since all the other IS lines are weak and WZ Sge is rather close. Note that the spectra obtained by IUE during the 1978 outburst (Fabian et al. 1980; Naylor 1989) look very similar to the HST spectrum.
In the right panel of Fig. 6 we show the C IV profile in more detail. The emission is line is clearly broad, as expected if formed in the wind, and somewhat asymmetric. Superimposed are absorption dips blueward of the center. We note the striking similarity between the C IV and N VI profiles (compare both panels of Fig. 6). The complex C IV line profile is somewhat reminiscent of that seen in the high inclination nova-like variable UX UMa (Mason et al. 1995). In that system, the C IV line is thought to be produced in a powerful accretion disk, with the absorption dips arising in a vertically extended accretion disk chromosphere (Knigge & Drew 1997). However, it is still far from clear whether the roughly similar line profiles actually imply physically similar line-forming regions in WZ Sge and UX UMa.
As evidenced by IUE spectroscopy of the late phases of the 1978 outburst (Slevinsky et al. 1999), the slow decline of the optical light curve at the end of each outburst is consistent with cooling of the white dwarf. It is interesting to note that the optical brightness at the bottom of the dips in the 1978 and 2001 outburst light curves fall on the backwards extrapolated white dwarf cooling tracks. At such times not much disk emission would be expected, and the white dwarf would dominate the emission. Preliminary analysis of the second HST observation during the dip indicates that the spectrum is indeed dominated by an approximately 28 000 K hot white dwarf, while the first and third observation resemble that expected from an accretion disk.

4. Conclusions
It is clear that the 2001 outburst has been looked at in great detail with various instruments with exquisitely high temporal and high wavelength (or energy) resolution. We have shown the first exciting preliminary results of a few of these observations, which already reveal a rich amount of information. The enormous amount of data accumulated over the outburst at various wavelength will leave us work for the years to come, and may well reveal the nature of superoutbursts in WZ Sge stars, as well as SU UMa stars in general!
Acknowledgments.
The observations shown here represent the work of a large collaboration, which includes T. Marsh (optical/HST), J. Casares, E. Harlaftis, W. Skidmore (optical), C. Markwardt, J. Swank (RXTE), J. Drake, J. Kaastra, C. Mauche, S. Starrfield, M. Wagner (Chandra), P. Szkody, E. Sion (FUSE), R. Hynes and R. Doyle (HST). Many thanks to the Isaac Newton Group staff for obtaining part of the data through the ING service programme, and V. Dhawan and M. Rupen for spending some of their VLA time on WZ Sge. In addition we are profoundly grateful for the support of many amateur observers who sacrifice their nights for observing stars like WZ Sge, and the collaboration of organizations such as VSNET and the AAVSO, who enabled us to plan the observations discussed here.
References
Baba, H., Sadakane, K., Norimoto, Y. 2001, IAUC 7672
Cheng, F., Sion, E.M., Szkody, P., Huang, M. 1997, ApJ, 333, 227
Fabian, A.C., et al. 1980, MNRAS, 191, 457
Froning, C.S., et al. 2001, ApJ, 746, in press
Ishioka, R., Uemura, M., Matsumoto, Kato, T., Yamaoka, H. 2001a, IAUC 7669
Ishioka, R., et al. 2001b, in preparation
Kato, T., et al. 2001a, IAUC 7672
Kato, T., et al. 2001b, IAUC 7678
Knigge, C., Drew, J.E. 1997, ApJ, 486, 445
Krzemiński, W. 1962, PASP, 74, 66
Kuulkers, E. 1999, NewA Reviews, 44, 27
Lasota, J.-P., Kuulkers, E., Charles, P. 1999, MNRAS, 305, 473
Long, K.S., et al. 1996, ApJ, 469, 841
Marsh, T., Horne, K. 1988, MNRAS, 235, 269
Mason, K.O., et al. 1995, MNRAS, 274, 271
Mattei, J. 2001, IAUC 7669
Mauche, C.W., Raymond, J.C. 2000, ApJ, 541, 924
Mayall, M.W. 1947, AJ 52, 127
Naylor, T. 1989, MNRAS, 238, 587
Patterson, J. 1998, PASP, 110, 1132
Patterson, J. 2001, PASP, 113, 736
Patterson, J., et al. 1981, ApJ, 248, 1067
Patterson, J., Richman, H., Kemp, J., Mukai, K. 1998, PASP 110, 403
Skidmore, W., et al. 2000, MNRAS, 318, 429
Skidmore, W., et al. 1999, MNRAS, 310, 750
Slevinsky, R.J., et al. 1999, PASP, 111, 1292
Smak, J. 1993, Acta Astr., 43, 101
Steeghs, D. 2001, in: Astrotomography, H. Boffin, D. Steeghs, J. Cuypers (eds.), Lecture Notes in Physics Series Volume 573, Springer Verlag
Steeghs, D., Casares, J. 2001, ApJ, in press [astro-ph/0107343]
Steeghs, D., Marsh, T., Kuulkers, E., Skidmore, W. 2001a, IAUC 7675
Steeghs, D., et al. 2001b, ApJ Letters, submitted [astro-ph/0109311]
Vogt, N. 1980, A&A, 88, 66
Wheatley, P.J., et al. 2001, IAUC 7677