The Large-Scale Environment of Dynamical Young Clusters of Galaxies
Abstract
Using the APM cluster data (Dalton et al. 1997) we investigate whether the dynamical status of clusters is related to the large-scale structure of the Universe. The methods used have been calibrated using a limited number of APM/Abell clusters for which ROSAT pointed observations were available. We find that cluster substructure is strongly correlated with the tendency of clusters to be aligned with their nearest neighbour and in general with the nearby clusters that belong to the same supercluster. Furthermore, dynamically young clusters are more clustered than the overall cluster population. These are strong indications that clusters develop in a hierarchical fashion by merging along the large-scale filamentary structures within which they are embedded.
Institute of Astronomy & Astrophysics, National Observatory of Athens, I.Metaxa & B.Pavlou, P.Penteli, 152 36 Athens, Greece
Astrophysics Group, Blackett Laboratory, Imperial College, London, UK
1. Introduction
In the popular hierarchical clustering scenario, clusters are supposed to form by merging and accretion of galaxies along filamentary protostructures. This structure formation scenario is seen to work in cosmological N-body CDM simulations, while observational studies have provided indications that our Universe follows such a scenario (cf. West 1994; West, Jones & Forman 1995)
If we can unambiguously identify the dynamical status of clusters (eg. presence of significant substructures, X-ray temperature gradients, compression of X-ray emitting gas along the merging direction, cf. Sarazin 2000; Schindler 1999) then we can search for indications of cluster formation along the lines of the hierarchical scenario.
Mohr et al. (1995), Rizza et al. (1998) and Kolokotronis et al. (2001) have investigated the frequency of cluster substructure using in a complementary fashion optical and X–ray data. The advantage of using X–ray data is that the X–ray emission is proportional to the square of the gas density (rather than just density in the optical) and therefore it is centrally concentrated, a fact which minimises projection effects. The advantage of using optical data is the shear size of the available cluster catalogues and thus the statistical significance of the emanating results. Kolokotronis et al. (2001) calibrated various substructure measures using APM and ROSAT data of 22 Abell clusters and found that in most cases using X–ray or optical data one can identify substructure unambiguously. Only in of the clusters they studied did they find projection effects in the optical that altered the X-ray definition of substructure. Their conclusion was that solely optical cluster imaging data can be used in order to identify the clusters that have significant substructure.
An interesting observable, that was thought initially to provide strong constraints on theories of galaxy formation, is the tendency of clusters to be aligned with their nearest neighbour as well as with other clusters that reside in the same supercluster (cf. Binggeli 1982; Plionis 1994). Analytical (Bond 1986) and numerical (cf. Splinter et al. 1997; Onuora & Thomas 2000) work have shown that such alignments, expected naturally to occur in ”top-down” scenarios, are also found in hierarchical clustering models of structure formation like the CDM.
2. Substructure & Alignment Measures
Evrard et al. (1993) and Mohr et al. (1995) have suggested as an indicator of cluster substructure the shift of the center-of-mass position as a function of density threshold above which it is estimated. The centroid-shift () is defined as the distance between the cluster center-of-mass, which is a function of density threshold, and the highest cluster density-peak. The significance, , of such centroid variations to the presence of background contamination and random density fluctuations, are estimated using Monte Carlo cluster simulations in which, by construction, there is no substructure (see details in Plionis 2001). According to Kolokotronis et al. (2001), a large and significant value of is a clear indication of substructure in the optical APM cluster data.
Furthermore, in order to investigate the alignment between cluster orientations, we use the relative position angle between cluster pairs, . In an isotropic distribution we will have . A significant deviation from this would be an indication of an anisotropic distribution which can be quantified by (Struble & Peebles 1995). In an isotropic distribution we have , while the standard deviation is given by . A significantly negative value of would indicate alignment and a positive misalignment.
3. Results: Alignments vs Substructure:
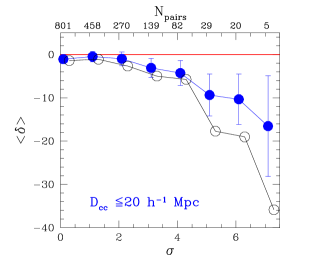
We have correlated the alignment signal with the substructure significance indication, , in order to see whether there is any relation between the large-scale environment, in which the cluster distribution is embedded, and the internal cluster dynamics. In the left panel of figure 1 we present the alignment signal, , between cluster nearest-neighbours (filled dots) and between all pairs (open dots) with pair separations Mpc. Evidently, there is a strong correlation between the strength of the alignment signal and the substructure significance level.

4. Results: Local Density vs Substructure
Where do clusters with significant substructure reside? To answer this question we measure the spatial 2-point cluster correlation function for different substructure significance levels. In the right panel of figure 1 we plot the correlation length, , as a function of cluster substructure significance level, which is clearly an increasing function of . The conclusion of this analysis is that clusters showing evidence of dynamical activity reside in high-density environments. Our results are in agreement with a similar environmental dependence found in the REFLEX and BCS X-ray cluster sample (Schüecker et al., this volume) and for cooling flow clusters with high mass accretion rates (Loken, Melott & Miller 1999).
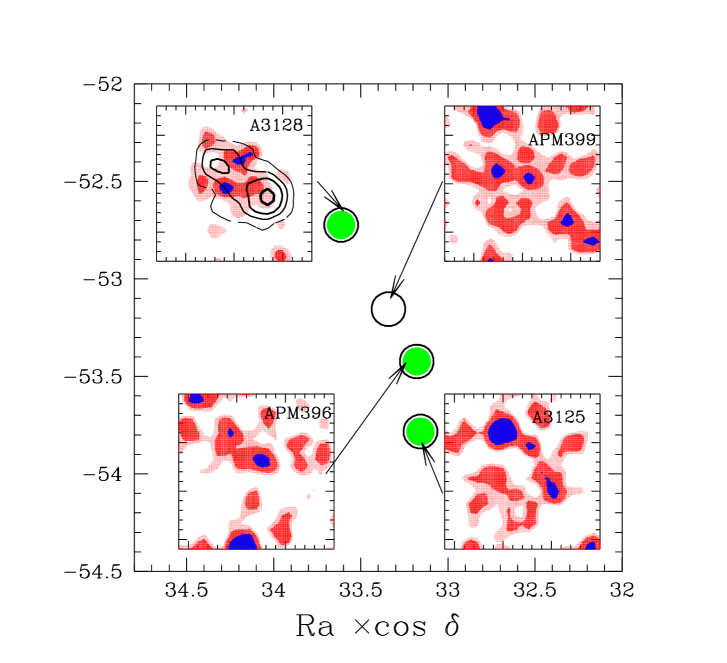
As an individual example we present in figure 3 the distribution on the sky of a dense supercluster, found with a percolation radius of 5 Mpc. Embedded in the plot are the galaxy density distributions of the clusters that constitute the supercluster. It is interesting that the position angles of the clusters (between 16∘ and 48∘) are aligned also with the orientation of the filamentary supercluster, which has a position angle of .
References
Bingelli B., 1982, A&A, 250, 432
Bond, J.R., 1986, in Galaxy Distances and Deviations from the Hubble Flow, eds. Madore, B.F., Tully, R.B., (Dordrecht: Reidel), p.255
Dalton G. B., Maddox S. J., Sutherland W. J., Efstathiou G., 1997, MNRAS, 289, 263
Evrard A.E., Mohr J.J., Fabricant D.G., Geller M.J.,1993, ApJ, 419, L9
Kolokotronis, V., Basilakos, S., Plionis, M., Georgantopoulos, I., 2001, MNRAS, 320, 49
Loken, C., Melott, A.L., Miller, C.J., 1999, ApJ, 520, L5
Mohr, J.J., Evrard, A.E., Fabricant, D.G., Geller, M.J., 1995, ApJ, 447, 8
Onuora, L.I., Thomas, P.A, 2000, MNRAS, 319, 614
Plionis M., 1994, ApJS, 95, 401
Plionis M., 2001, in Clusters and the High-Redshift Universe observed in X-rays, XXIth Moriond Astrophysics Meeting, eds. Neumann et al., in press
Richstone, D., Loeb, A., Turner, E.L., 1992, ApJ, 393, 477
Rizza E., Burns J. O., Ledlow M. J., Owen F. N., Voges, W., Blito M., 1998, MNRAS, 301, 328
Sarazin, C.L., 2001, in Merging Processes in clusters of Galaxies, eds. Feretti, L., Gioia, M., Giovannini, G., (Dordrecht: Kluwer).
Schindler S., 1999, Vulcano Workshop 1999, Multifrequency Behaviour of High Energy Cosmic Sources, eds. Giovanelli F., Sabau-Graziati L.
Splinter, R.J., Melott, A.L., Linn, A.M., Buck, C., Tinker, J., 1997, ApJ, 479, 632
Struble, M.F., Peebles, P.J.E., 1985, AJ, 90, 582
West, M. J., 1994, MNRAS, 268, 79
West, M. J., Jones C., Forman W., 1995, ApJ, 451, L5