Far Ultraviolet Spectroscopic Explorer Observations of
the Seyfert 1.5 Galaxy NGC 5548 in a Low State
Abstract
We present far-ultraviolet spectra of the Seyfert 1.5 galaxy NGC 5548 obtained in 2000 June with the Far Ultraviolet Spectroscopic Explorer (FUSE). Our data span the observed wavelength range 915–1185 Å at a resolution of . The spectrum shows a weak continuum and emission from O VI 1032,1038, C III 977, and He II 1085. The FUSE data were obtained when the AGN was in a low state, which has revealed strong, narrow O VI emission lines. We also resolve intrinsic, associated absorption lines of O VI and the Lyman series. Several distinct kinematic components are present, spanning a velocity range of relative to systemic, with kinematic structure similar to that seen in previous observations of longer wavelength ultraviolet (UV) lines. We explore the relationships between the far-UV absorbers and those seen previously in the UV and X-rays. We find that the high-velocity UV absorption component is consistent with being low-ionization, contrary to some previous claims, and is consistent with its non-detection in high-resolution X-ray spectra. The intermediate velocity absorbers, at , show H I and O VI column densities consistent with having contributions from both a high-ionization X-ray absorber and a low-ionization UV absorber. No single far-UV absorbing component can be solely identified with the X-ray absorber.
1 Introduction
NGC 5548 is among the most studied of Seyfert galaxies. As a bright, nearby (z=0.017175) variable AGN, NGC 5548 in particular has been the target of intensive monitoring campaigns in the optical (e.g., Peterson et al. 1999), the ultraviolet (Clavel et al. 1991; Korista et al. 1995), and the extreme ultraviolet (Marshall et al. 1997). The time-delayed response of emission lines to continuum changes indicates the size-scale of the emitting regions. In the case of NGC 5548, the Doppler widths of the lines and their respective size scales are consistent with Keplerian motion around a black hole of mass (Peterson & Wandel 2000).
NGC 5548 is also noteworthy as an AGN with intrinsic ultraviolet (UV) and X-ray absorption characteristic of a high-velocity outflow. About half of Seyfert galaxies display complex narrow intrinsic absorption of high-ionization species with transitions in the UV (Crenshaw et al. 1999). Moreover, there appears to be a one-to-one correspondence between the presence of this UV absorption and warm X-ray absorption. Warm absorbers appear to be highly ionized (typically U = 0.1 to 10, where U is the ratio of the number density of hydrogen-ionizing photons to the hydrogen number density) with total column densities in the range 1021-23 cm-2 (George et al. 1998).
The correspondence between the presence of UV absorption and of X-ray absorption suggests a direct link between the two despite the ionization difference. Mathur et al. (1995) proposed a single zone model for a combined UV-X-ray absorber in NGC 5548. High-resolution UV spectroscopy shows that the UV absorber is resolved into distinct kinematic components with outflow velocities ranging to greater than 1100 km s-1 (Mathur et al. 1999; Crenshaw & Kraemer 1999), and with a range of ionization states and column densities.
The new generation of X-ray telescopes (Chandra, XMM) now provide the combination of sensitivity and spectral resolution to detect and measure the kinematic properties of X-ray absorption lines in AGNs. Kaastra et al. (2000) presented the first high-resolution X-ray spectrum of a Seyfert galaxy, in fact, NGC 5548. The Chandra-LETGS spectrum revealed strong narrow absorption lines from highly ionized species, blueshifted by several hundred km s-1.
The Far Ultraviolet Spectroscopic Explorer (FUSE) (Moos et al. 2000) provides spectral coverage of shorter wavelengths than possible with the Hubble Space Telescope (HST). Of special interest in this wavelength range for investigations of the intrinsic UV-X-ray absorbers is the O VI 1032,1038 resonance doublet, as O VI is of intermediate ionization. In the warm absorber in Markarian 509, for instance, FUSE resolves seven kinematic components of intrinsic O VI absorption, one of which – and only one of which – can be identified with the X-ray absorber (Kriss et al. 2000). Kriss (2000) reviews this result along with other FUSE observations of AGNs.
In this paper we present FUSE observations of NGC 5548 (§ 2), focusing in particular on characterizing the intrinsic O VI and Lyman absorption components (§ 3). We interpret the spectral features with the assistance of photoionization models (§ 4), and discuss our findings together with the previous results from the UV and X-ray to achieve an improved understanding of the ionized outflow of NGC 5548 (§ 5).
2 Observations
FUSE (Moos et al. 2000; Sahnow et al. 2000) contains four “channels” which are in effect four independent telescope/grating spectrographs, two of which employ optics coated with LiF for high efficiency from –1187 Å and two of which employ optics coated with SiC for high efficiency at shorter wavelengths. Two two-dimensional photon-counting microchannel-plate detectors record spectra from the four channels.
NGC 5548 was observed on 2000 June 7 through the low-resolution aperture with a total exposure time of 25 ksec. Data were recorded in photon-address mode, which provides a time-tagged list of event positions in the down-linked data stream. All channels were aligned, resulting in spectra covering the whole wavelength range from 905 to 1187 Å.
To calibrate the data, we use a modified version of the standard FUSE pipeline. Our processing restricts the pulse heights for acceptable data to channels 4–16 to reduce the background. We also scale the background level to match the levels seen in blank regions of the detector. Because FUSE uses the LiF1 channel for fine guidance, this channel has the best photometric accuracy and the best absolute wavelength scale. We therefore cross-correlated the other three channels with LiF1 to obtain adjustments to the zero points of their wavelength scales, and we scaled their fluxes to match the level seen in LiF1. To obtain the best signal-to-noise ratio (S/N) in our final calibrated spectrum, we then re-binned the data from all the detector segments onto a uniform wavelength scale using 0.05 Å bins. Approximately 7 pixels from each detector segment contributes to each bin. This results in an effective spectral resolution of . We estimate that our fluxes are accurate to 10%, and that the wavelength scale has an absolute accuracy of .
Figure 1 displays the full FUSE spectrum. We note the presence of emission lines of O VI 1032,1038, C III 977, N III 990, and He II 1085. We do not see an intrinsic Lyman edge. Galactic molecular hydrogen appears present but weak along this sight line, and a number of atomic lines from the Galactic ISM are present as well (including O VI 1032,1038). A Galactic Lyman edge is also seen.
NGC 5548 was in a low state when observed by FUSE. Coincidently, this low state appears to match the flux level of NGC 5548 in 1991 when first observed with the Faint Object Spectrograph (FOS) on the Hubble Space Telescope (HST) (Crenshaw, Wu, & Bogges 1993). This level is a factor of several lower than when observed in recent years by, for instance, the Hopkins Ultraviolet Telescope (Kriss et al. 1997). Figure 2 compares these spectra. In the low state the continuum and broad lines weaken and the less time-variable narrow lines become more prominent.
3 Spectral Measurements
Given the low state of NGC 5548, the signal-to-noise ratio (S/N) of the spectrum is not as high as initially anticipated. For Å the S/N per 0.05 Å pixel is only about 3; we therefore cannot make accurate measurements of C III 977 and the higher order Lyman lines, although some degree of absorption is probably present (contaminating Galactic O I 989 certainly is present). At longer wavelengths in the Ly and O VI region, the S/N is about 10 in the continuum and higher in the emission lines. This is large enough for detailed work at the full resolution of FUSE.
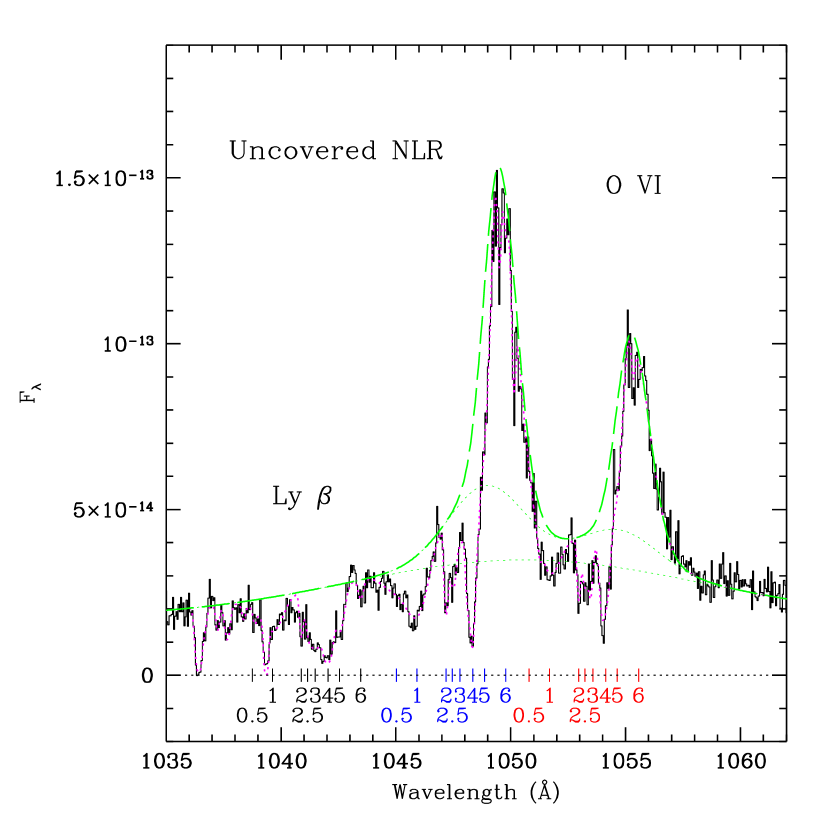
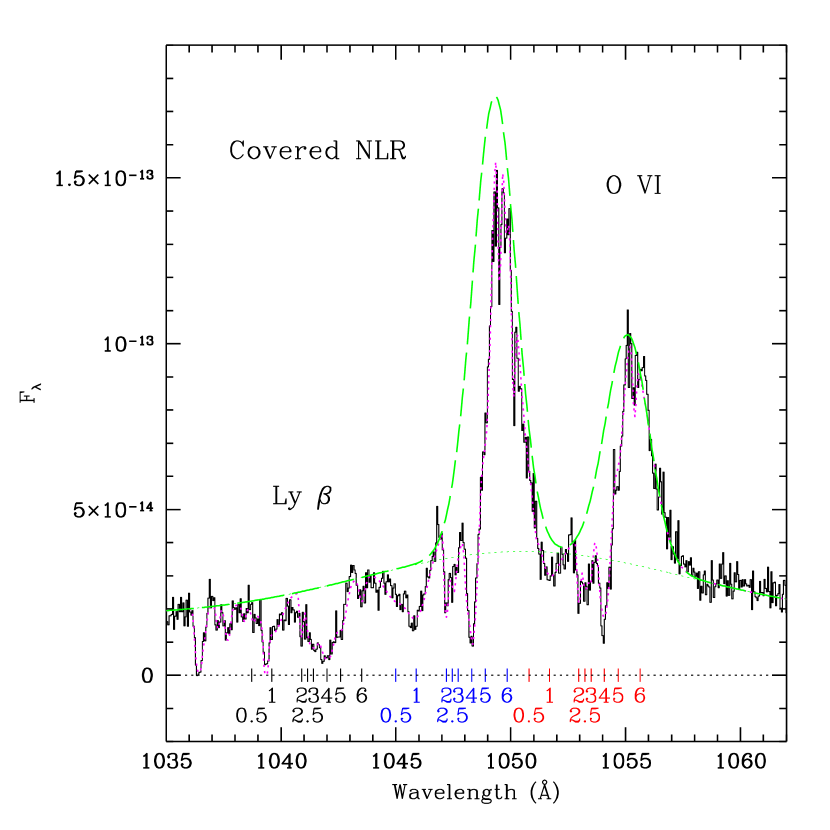
We have made measurements of the Lyman /O VI region using our 0.05 Å combined-channel spectrum. We have used SPECFIT (Kriss 1994) to fit the spectral region. The continuum is modeled as a power-law plus Galactic extinction (AB = 0.088 mag, Schlegel et al. 1998) using the reddening curve of Cardelli, Clayton, & Mathis (1989) with . The O VI emission lines are fit using Gaussian components. Since inflections are present in the emission profiles, these separate components may have physical significance. O VI 1032,1038 is a doublet with an optically thin line ratio of 2:1, but in dense gas with saturation the ratio may approach 1:1. While the physical conditions typically associated with the narrow-line region (NLR) should only show the 2:1 O VI 1032,1038 doublet emission ratio, the ratio is 1:1 in the low-state FUSE spectrum of NGC 3516 (Hutchings et al. 2001). Given this empirical result and the possibility of narrow O VI 1032,1038 emitting gas with atypical conditions, our initial models begin with 2:1 doublet ratios but are allowed to vary between 2:1 and 1:1.
We approximate the intrinsic absorption as several components with Gaussian distributions in optical depth that are permitted to partially cover the background source. The optical depth ratio of the doublets is constrained to be 2:1 at all velocities. The initial parameters for the Gaussians (e.g., FWHM, redshift) were selected to match those reported for UV lines (components 1–6) by Crenshaw & Kraemer (1999), but allowed to freely vary to account for source variability, ionization differences, and data quality. We also added two new components, a high-velocity component “0.5” and a component “2.5”, which significantly improved the fits. The absorption lines of the O VI doublets and Ly have been fit simultaneously and constrained to have the same covering fraction111The partial covering of absorption components in principle can vary between red and blue doublets since the ratios of different emission components, with potentially different individual coverings, can differ. In instances like this one, permitting this extra freedom in the fitting, however, compromises the consistency of the results..
Column densities for a particular ionized species are obtained from measurements of optical depth according to the equation:
| (1) |
where is the transition wavelength and is the pertinent oscillator strength. The units on columns discussed below will always be cm-2, which will be implicitly understood for the case of logarithmic columns. For O VI 1032, log and for Lyman log (Morton 1991), where is in Å. For the case of absorption lines that have Gaussians in optical depth:
| (2) |
where is the optical depth at zero velocity, and the FWHM is in km s-1.
Contaminating Galactic lines are included in the models. We note in particular O I 1039 and Ar I 1048 fall at the same wavelengths as redshifted intrinsic absorption troughs (Ar I 1048 is constrained by simultaneously fitting Ar I 1066). The atomic transitions are constrained to have the same line widths. Several strong Galactic molecular hydrogen lines absorb some of the blue peak of O VI emission.
3.1 Specific Models
There are two primary classes of models that yield plausible fits to the spectrum. The first class, and the one we favor, features narrow emission lines with FWHM that are uncovered by absorption components. These emission lines may be associated with a traditional, extended, low-density NLR. A small degree of skewness in the form of a blue tail is allowed by the model and consistent with NLR profiles (e.g., Brotherton 1996). The weak broad emission is fit using the sum of two Gaussians. These emission lines are described in Table 1 and shown in green in Figure 3. The redshift of the narrow emission lines in this case is 0.01702, only 50 km s-1 blueshifted from the 21 cm redshift = 0.017175, and clearly larger than the “emission-line redshift” of = 0.01676 given in the NASA/IPAC Extragalactic Database (NED). Table 2 gives the parameters for the absorption components in our best fitting model.
The second class of models involves a significant extrapolation of the narrow emission components, in which we assume that the NLR is at least partially covered by the absorbers. The motivations for this type of model are that the high-ionization NLR is expected to be compact (Kraemer et al. 1998) and hence more easily covered, that the narrow-line component of the UV lines seen in the low-state FOS spectrum have FWHM 1000 km s-1 (Goad & Koratkar 1998), and that low-state narrow O VI emission appears to arise at small radii at the base of an accelerating wind in NGC 3516 (Hutchings et al. 2001). Our best covered NLR model has a narrow emission component with FWHM , larger than that of the uncovered case and more similar to the Goad & Koratkar (1998) results. Figure 4 shows this model, and Tables 1 and 2 give the model parameters. Table 1 reveals that the narrow O VI doublet ratio is an optically thin 2:1, unlike the case of NGC 3516 where it is nearly 1:1 (Hutchings et al. 2001), weakening the similarity between the two AGNs in the low state.
While we favor the uncovered NLR model as it is less of an extrapolation and yields a better , an examination of Table 2 reveals that both models give very similar results for the absorption lines. Despite the possible uncertainty about the FWHM and covering of the narrow emission lines, the inferred absorption line column densities and ratios appear rather robust.
3.2 Continuum
We also have made independent fits to measure the continuum slope, expanding the fitting range beyond the immediate vicinity of O VI and Lyman , and excluding portions of spectra with clear emission or absorption present. Assuming only a power law continuum shape and Galactic reddening, the power-law index obtained is = 1.230.11, where .
4 Intrinsic Absorption in NGC 5548
We interpret the absorbing column densities in Table 2 with the assistance of photoionization models. We have employed the latest version of Cloudy (C94; Ferland 2001). We assume solar abundances and the continuum shape of Dumont et al. (1998). We characterize the state of the gas in terms of the dimensionless ionization parameter U, which is the ratio of the number density of hydrogen-ionizing photons to the number density of hydrogen. Within our FUSE spectrum we can measure simultaneous column densities only for neutral hydrogen and for O VI. The physical conditions of an absorber are not uniquely determined with only H I and O VI column densities. In general there will be two solutions, one with a low ionization parameter and low total column density, and another with a high ionization parameter and higher column density. For gas in both very low and very high ionization states, there is no O VI as all the oxygen is in lower or higher ionization states, respectively. As a function of increasing ionization parameter, the ratio of H I to O VI column densities starts at zero, rises and peaks (10 near U0, for our models), then falls again. The Cloudy command OPTIMIZE has been used to find solutions without creating large grids in parameter space. Table 3 gives both solutions for the column densities measured for each component in our preferred uncovered NLR fit.
Although the formal errors on many component parameters are small, there is a certain degree of arbitrariness in the models resulting from the blending of the fitted components (especially in conjunction with partial covering). With the addition of two components and freely varying velocity widths, and possible variability, a component-to-component comparison with UV absorbers seen by HST (e.g., Crenshaw & Kraemer 1999; Mathur et al. 1999) remains imperfect. Figure 5 shows the velocities of the six HST components on a blow up of the blue O VI doublet; it appears that the FUSE spectrum is redshifted some 100 km s-1 relative to the STIS spectrum. An examination of Galactic lines in the STIS spectrum using on-the-fly calibration suggests that 50 km s-1 of the shift may arise there. Potential variability and low spectral resolution in the X-rays also limit comparison with Chandra spectra (Kaastra et al. 2000). Still, there is much to be learned from such comparisons assisted by our photoionization models. We do so below.
4.1 Components 0.5 and 1
We first consider high-velocity components ( to km s-1). The blue O VI absorption at these velocities is beyond any uncertainties in the O VI narrow emission lines. Component 1 is also of special interest because Crenshaw & Kraemer (1999) claim, based on the column density ratio of N (N V)/N (C IV) seen in GHRS HST spectra, that this component has a high ionization parameter and large column density and could be a manifestation of the X-ray absorber.
Crenshaw & Kraemer (1999) started with N (N V)/N (C IV) = , based on non-simultaneous GHRS spectra taken six months apart of the N V and C IV spectral regions. Their preferred physical conditions for a model to account for this single column density ratio are log U = 0.38, and effective hydrogen column density of log NH = 21.8. They investigated varying U or NH in order to explain their later epoch STIS spectrum, for which N (N V) was lower, N (H I) was known, and N (C IV) had an upper limit. These resulted in similarly high U, high NH conditions for the component 1 absorber.
Table 3 shows our pair of solutions for component 1 (ignoring the weaker and more uncertain component 0.5): 1) log U = 0.26, total hydrogen column log NH = 21.1; 2) log U = 1.71, total hydrogen column log NH = 18.4. From Crenshaw & Kraemer (1999), we might be led to assume our high-ionization solution represents the conditions in component 1. The HST spectra were taken when NGC 5548 was in a high state (within a few percent of the level of the HUT spectrum in Figure 2), so we might expect a somewhat lower ionization parameter in the low-state FUSE spectrum, just as we see.
We find using the N (N V)/N (C IV) GHRS spectra ratio alone suspect: first, the two spectral regions were observed six months apart (Crenshaw et al. 1999) and absorbers have been seen to vary on this timescale, second, N V and C IV have similar ionization states and the column density ratio is rather insensitive to the ioinzation parameter (small uncertainties in the ratio correspond to large differences in U), and third, nitrogen abundances have been found to be preferentially enhanced in AGN (primarily in high luminosity AGNs, e.g., Hamann & Ferland 1993), and to have significant scatter – assuming solar abundances is a large source of uncertainty. The GHRS N (N V)/N (C IV) constraint would seem to be a poor one. We elected to make our own comparison for the STIS spectrum alone, which has simultaneous measurements (or interesting upper limits) for three species.
In order to make a consistent comparison, we used Cloudy with the Dumont et al. (1998) spectral energy distribution to model the physical conditions of the absorber using the column densities reported by Crenshaw & Kraemer (1999) for the STIS spectrum (in the case of C IV 1549 only an upper limit is available). We found a good low ionization solution, with log U =0.94 and a total column density of log NH = 18.7. Using instead the Crenshaw & Kraemer (1999) continuum changes the solution to log U = 0.38 and log NH = 19.3, higher ionization and larger column density but still far from their high ionization values.
These low-ionization solutions are not dissimilar from our low-ionization solution for the FUSE spectrum. In fact, the ionization parameter (log U = 1.7) appears lower for the low-state spectrum as we might expect. Is there a way to decide whether the “low” or “high” solution is correct?
The Chandra spectrum of Kaastra et al. (2000) shows no O VII and O VIII absorption at the velocity of component 1, while the “high” solution would predict easily detectable columns on order of log N . The Chandra spectrum does show O VI absorption at component 1 velocities, entirely consistent with the FUSE “low” solution and our solution for the STIS column densities. We conclude that component 1 is a low column density, low-ionization absorber with the properties described above.
4.2 Components 2 through 5
Components 2 through 5 correspond to absorption between velocities of 700 to km s-1. This complex is of special interest because strong absorption is seen in both longer wavelength UV lines and in higher ionization X-ray transitions.
The absorption structure is very similar to that seen in the UV lines like C IV 1549 (Crenshaw & Kraemer 1999; Mathur et al. 1999). Different fitted components, blending, and variability issues conspire to make a one-to-one component comparison between the FUSE and HST spectra difficult, but the general findings are of interest. Crenshaw & Kraemer (1999) find ionization parameters of a few tenths and total hydrogen columns of 1019 to 1020 cm-2. These conditions produce O VI columns on order of 1015 cm-2 and are consistent with our “Low” models of Table 3.
But what of the X-ray absorption? Kaastra et al. (2000) find significant column densities for a number of high-ionization species (e.g., log N (O VII) = 17.2 and log N (O VIII) = 18.1). The X-ray absorption appears centered at a velocity of 400 km s-1 (using z=0.017175), and has a FWHM 600 km s-1; Kaastra et al. suggest that that large span in velocity is suggestive of contributions of several individual components of smaller velocity dispersion. We input the column densities reported by Kaastra et al. into Cloudy with the Dumont et al. (1998) continuum and found a good solution similar to that of Kaastra et al.: log U = 0.43 and log NH = 21.8. This model predicts log N (O VI) = 14.8 and log N (H I) = 15.3, less than what we observe from the sum of the components in the FUSE spectrum, but enough to account for an individual component or two. Such conditions predict very low column densities for C IV and N V. This may in part explain why we needed to add a component “2.5”, although variability could also be involved.
Based on Cloudy models, an O VI column density on the order of log N (O VI) = 15 would appear to be consistent with both the X-ray and UV absorbers. We cannot unambiguously say if any individual O VI absorbing component arises solely from high-ionization or low-ionization gas. Simultaneous high-resolution UV-Far-UV-X-ray spectra would help unravel the physical conditions of the outflowing material along the line of sight.
4.3 Component 6
Component 6 poses a special problem. The velocity of this component falls at the apparent peak of the O VI emission, where the covering is most uncertain and contaminating molecular H2 lines are present. The formal fitting uncertainties in Table 2 indicate we do not reliably measure O VI or Lyman absorption in component 6. Crenshaw & Kraemer (1999) summarily dismissed this component as uninteresting given that it was at low velocity and appeared only in Lyman and not in C IV 1549 or N V 1240.
5 Discussion
Intrinsic absorption is seen in the FUSE spectrum of NGC 5548 in the low-state in hydrogen Lyman and in O VI 1032,1038. The velocity range and kinematic structure closely resembles that seen previously by high-resolution HST spectra in the UV (Mathur et al. 1999; Crenshaw & Kraemer 1999). At least some portion of the O VI-absorbing gas would seem to be identifiable with the previously studied UV absorber, variability nonwithstanding.
Reanalysis of the STIS data, in conjunction with our FUSE spectrum, indicates that the high-velocity component 1 is not high ionization and is not the X-ray warm absorber. This reconciles the results of Kaastra et al. (2000) who report that high-ionization species have a blueshift of 28070 km s-1 (for ; using the blueshift increases by 120 km s-1 to 400 km s-1, consistent with component 3 or 4). Mathur et al. (1999) suggested that the broad component 3 ( 300 km s-1FWHM) could be identified with the X-ray absorber. The blueshift of the X-ray absorber and component 3 would tend to support this conclusion, although there may simply exist material along the line of sight with a range of physical conditions at these velocities. High-resolution, high S/N, simultaneous spectra of the UV, far UV, and X-ray regions is required to finally determine the nature of the absorbing components along the line of sight.
Despite the one-to-one correspondence between the incidence of X-ray absorption and UV absorption in the 50-60% of Seyfert galaxies that show such absorption, there is not one-to-one correspondence at the level of individual kinematic components. These outflows are clearly stratified in some fashion. The UV absorbers often appear as distinct components at a range of velocities, appearing and vanishing over the time scales of months to years (some of course are more stable). In Markarian 509 there are seven components, only one of which appears to be high ionization and it is near zero velocity (Kriss et al. 2000). In NGC 3783 the X-ray absorber is blueshifted by 440 km s-1 (Kaspi et al. 2000); the resolution at X-ray wavelengths is not yet sufficient to separate any kinematic components. Still, we may conclude that there is no simple relationship between ionization and velocity, and as yet no clear hint about their dynamical or physical structure (although radiative acceleration appears likely in a number of cases including NGC 5548, Srianand 1999).
Thermally driven wind models such as those proposed by Krolik & Kriss (1995; 2001) also are consistent with the observations. These winds are evaporated from the surface of the obscuring torus, and they have low velocities compatible with those typically seen in Seyfert 1s. At the critical ionization parameter for evaporation in these models, there is a broad range of temperatures that can coexist in equilibrium at nearly constant pressure. Thus the flow is expected to be strongly inhomogeneous. High temperature, highly ionized gas causing X-ray absorption can co-exist with more densely clumped, lower temperature gas that forms UV absorption lines.
The nature of the narrow emission lines has been only a minor complication for studying the intrinsic absorption in far-UV, by coincidence as much as anything else. For a high-state spectrum, such as those obtained by HST, deducing if uncovered narrow emission-lines fill in deep trough bottoms can have a profound effect on measured columns (e.g., Arav, Korista, & de Kool 2001). The narrow O VI emission lines are of special interest in their own right. How narrow are they? Are they covered?
The narrow-line region of NGC 5548 is extended, with deep narrow-band images showing [O III] 5007 spanning a region some 4 2.7 kpc aligned with the weak radio structure (Wilson et al. 1989). Moore, Cohen, & Marcy (1996) using optical spectra found that the line widths and line shifts of narrow emission lines correlated with the critical density of the transition, rather than ionization potential, and that the low critical density lines are in fact consistent with the 21 cm redshift of 0.017175. The FWHM of these optical narrow lines ranges from 300 to 500 km s-1. This is entirely consistent with what we find for our preferred uncovered NLR model, and so perhaps we should not be concerned that Goad & Koratkar (1998) found for the low-state FOS spectrum (Crenshaw et al. 1993) FWHMs on order of 1000 km s-1 for UV narrow lines like C IV 1549. That was a single epoch, low-resolution spectrum. Likewise, the NLR models of Kraemer et al. (1998) suggest that the high-ionization narrow-line region is rather compact (parsec scale) and may easily be covered. However, their model underpredicts the observed narrow O VI emission lines by nearly an order of magnitude.
6 Summary
We have presented the far-ultraviolet spectrum of NGC 5548 observed by FUSE in a low state. Prominent narrow O VI 1032,1038 emission lines are present, as are intrinsic absorption lines of O VI and hydrogen Lyman . Two rather different assumptions regarding the narrow O VI emission lines both lead to rather similar measurements of the absorbing column densities. Reanalysis of the UV column densities of the highest velocity component (1) reported by Crenshaw & Kraemer (1999) indicates a low total column density and low ionization parameter and are consistent with our FUSE results and consistent with the lack of an X-ray absorber at this velocity (Kaastra et al. 2000). The absorbers with intermediate velocities of to km s-1are primarily identified with the same low ionization parameter, low column density material that absorbers at longer UV wavelengths, but almost certainly have some non-negligible contribution from the high ionization parameter, high column density material that results in absorption lines seen in the X-ray. Still, no single component of O VI absorption can be unambiguously identified as “the X-ray absorber.” High-quality, simultaneous multiwavelength spectra at several epochs may be required to fully understand the emitting and absorbing regions.
References
- Arav, et al. (2001) Arav, N., Korista, K. T., & de Kool, M. 2001, submitted to ApJ
- Brotherton (1996) Brotherton, M. S. 1996, ApJS, 102, 1
- Cardelli, Clayton, & Mathis (1989) Cardelli, J. A., Clayton, G. C., & Mathis, J. S. 1989, ApJ, 345, 245
- Clavel et al. (1991) Clavel, J. et al. 1991, ApJ, 366, 64
- Crenshaw, Boggess & Wu (1993) Crenshaw, D. M., Boggess, A. & Wu, C. 1993, ApJ, 416, L67
- Crenshaw et al. (1999) Crenshaw, D. M., Kraemer, S. B., Boggess, A., Maran, S. P., Mushotzky, R. F. & Wu, C. 1999, ApJ, 516, 750
- Crenshaw & Kraemer (1999) Crenshaw, D. M. & Kraemer, S. B. 1999, ApJ, 521, 572
- Dumont, Collin-Souffrin, & Nazarova (1998) Dumont, A., Collin-Souffrin, S., & Nazarova, L. 1998, A&A, 331, 11
- Ferland (2001) Ferland, G. J., 2001, Hazy, a brief introduction to Cloudy 94.00
- George et al. (1998) George, I. M., Turner, T. J., Netzer, H., Nandra, K., Mushotzky, R. F., & Yaqoob, T. 1998, ApJS, 114, 73
- Goad & Koratkar (1998) Goad, M. & Koratkar, A. 1998, ApJ, 495, 718
- Hamann & Ferland (1993) Hamann, F. & Ferland, G. 1993, ApJ, 418, 11
- Hutchings et al. (2001) Hutchings, J. B., et al. 2001, ApJ, in press
- Kaastra et al. (2000) Kaastra, J. S., Mewe, R., Liedahl, D. A., Komossa, S. & Brinkman, A. C. 2000, A&A, 354, L83
- Kaspi et al. (2000) Kaspi, S., Brandt, W. N., Netzer, H., Sambruna, R., Chartas, G., Garmire, G. P., & Nousek, J. A. 2000, ApJ, 535, L17
- Korista et al. (1995) Korista, K. T. et al. 1995, ApJS, 97, 285
- Kraemer, Crenshaw, Filippenko & Peterson (1998) Kraemer, S. B., Crenshaw, D. M., Filippenko, A. V. & Peterson, B. M. 1998, ApJ, 499, 719
- Kriss et al. (2000) Kriss, G. A. et al. 2000, ApJ, 538, L17
- Kriss et al. (1997) Kriss, G., Krolik, J., Grimes, J., Tsvetanov, Z., Espey, B., Zheng, W., & Davidsen, A. 1997, ASP Conf. Ser. 113: IAU Colloq. 159: Emission Lines in Active Galaxies: New Methods and Techniques, 453
- Kriss (1994) Kriss, G. 1994, ASP Conf. Ser. 61: Astronomical Data Analysis Software and Systems III, 3, 437
- Kriss (2000) Kriss, G. A. 2000, First Results from the FUSE Mission, 24th meeting of the IAU, Joint Discussion 11, August 2000, Manchester, England., 11, E7
- Krolik & Kriss (1995) Krolik, J. H. & Kriss, G. A. 1995, ApJ, 447, 512
- Krolik & Kriss (2001) Krolik, J. H. & Kriss, G. A. 2001, submitted to ApJ
- Marshall et al. (1997) Marshall, H. L. et al. 1997, ApJ, 479, 222
- Mathur, Elvis & Wilkes (1999) Mathur, S., Elvis, M. & Wilkes, B. 1999, ApJ, 519, 605
- Mathur, Elvis & Wilkes (1995) Mathur, S., Elvis, M. & Wilkes, B. 1995, ApJ, 452, 230
- Moore, Cohen, & Marcy (1996) Moore, D., Cohen, R. D., & Marcy, G. W. 1996, ApJ, 470, 280
- Moos et al. (2000) Moos, H. W. et al. 2000, ApJ, 538, L1
- Morton (1991) Morton, D. C. 1991, ApJS, 77, 119
- (30) Peterson, B. M., & Wandel, A. 1999, ApJ, 521, 95
- Peterson et al. (1999) Peterson, B. M. et al. 1999, ApJ, 510, 659
- Sahnow et al. (2000) Sahnow, D. J. et al. 2000, ApJ, 538, L7
- Schlegel, Finkbeiner, & Davis (1998) Schlegel, D. J., Finkbeiner, D. P., & Davis, M. 1998, ApJ, 500, 525
- Srianand (2000) Srianand, R. 2000, ApJ, 528, 617
- Wilson et al. (1989) Wilson, A. S., Wu, X., Heckman, T. M., Baldwin, J. A., & Balick, B. 1989, ApJ, 339, 729
| Feature | Observed | FluxbbThese are observed fluxes. If the Galactic reddening is assumed to be mag for the extinction of Cardelli, Clayton, & Mathis (1989), then these fluxes should be increased by 30%. | FHWM | VelocityccVelocities are relative to systemic (H I 21 cm, NED). |
|---|---|---|---|---|
| (Å) | ( ergs s -1 cm-2) | (km s-1) | (km s-1) | |
| Uncovered NLR Model | ||||
| Broad O VI 1032 | 1048.94 | 2.290.04 | 484189 | 200 |
| Broad O VI 1038 | 1054.72 | 1.14 | 4841 | 200 |
| Intermediate O VI 1032 | 1048.94 | 0.950.04 | 111147 | 200 |
| Intermediate O VI 1038 | 1054.72 | 0.47 | 1111 | 200 |
| Narrow O VI 1032 | 1049.490.04 | 1.690.10 | 43212 | 50 |
| Narrow O VI 1038 | 1055.26 | 1.060.03 | 432 | 50 |
| Covered NLR Model | ||||
| Broad O VI 1032 | 1048.940.05 | 2.340.05 | 4366107 | |
| Broad O VI 1038 | 1054.7 | 1.17 | 4366 | |
| Narrow O VI 1032 | 1049.320.05 | 3.270.03 | 6589 | |
| Narrow O VI 1038 | 1054.11 | 1.650.03 | 658 |
| Feature | Observed | Column Density | FWHM | CoveringbbThe covering fraction of the absorbing components is with respect to all emission components except the narrow emission lines for the case of the “uncovered” model. | VelocityccVelocities given are the component Gaussian central wavelengths relative to systemic (H I 21 cm, NED). |
|---|---|---|---|---|---|
| (Å) | ( cm-2) | (km s-1) | Fraction | (km s-1) | |
| Uncovered NLR Model | |||||
| O VI 1032 | |||||
| 0.5 | 1045.030.11 | 22933 | 347154 | 1.00 | 1320 |
| 1 | 1045.920.03 | 54429 | 27817 | 0.990.10 | 1070 |
| 2 | 1047.190.01 | 29657 | 4317 | 0.660.05 | 700 |
| 2.5 | 1047.460.02 | 680154 | 6211 | 0.410.10 | 630 |
| 3 | 1047.790.02 | 20828 | 14212 | 0.750.06 | 530 |
| 4 | 1048.350.01 | 2121242 | 1014 | 0.890.02 | 370 |
| 5 | 1048.860.04 | 79368 | 12510 | 0.940.08 | 230 |
| 6 | 1049.780.05 | 2518 | 695 | 1.00 | 40 |
| Ly | |||||
| 0.5 | 1038.75 | 8775 | 347 | 1.00 | 1320 |
| 1 | 1039.63 | 777123 | 278 | 0.99 | 1070 |
| 2 | 1040.89 | 340302 | 43 | 0.66 | 700 |
| 2.5 | 1041.16 | 25650 | 62 | 0.41 | 630 |
| 3 | 1041.49 | 18301406 | 142 | 0.75 | 530 |
| 4 | 1042.04 | 1589600 | 101 | 0.89 | 370 |
| 5 | 1042.55 | 498225 | 125 | 0.94 | 230 |
| 6 | 1043.47 | 7732 | 69 | 1.00 | 40 |
| Covered NLR Model | |||||
| O VI 1032 | |||||
| 0.5 | 1045.000.08 | 28231 | 28935 | 0.990.12 | 1330 |
| 1 | 1045.890.06 | 473104 | 25334 | 0.980.06 | 1080 |
| 2 | 1047.200.01 | 31545 | 4112 | 0.670.16 | 700 |
| 2.5 | 1047.450.02 | 688139 | 6010 | 0.470.04 | 630 |
| 3 | 1047.720.01 | 31338 | 996 | 0.720.03 | 550 |
| 4 | 1048.300.03 | 1692188 | 1297 | 0.850.08 | 390 |
| 5 | 1048.900.01 | 36921 | 1436 | 0.940.14 | 210 |
| 6 | 1049.840.11 | 1.11.0 | 7836 | 1.00 | 50 |
| Ly | |||||
| 0.5 | 1038.72 | 125220 | 289 | 0.99 | 1330 |
| 1 | 1039.60 | 816262 | 253 | 0.98 | 1080 |
| 2 | 1040.90 | 325102 | 41 | 0.67 | 700 |
| 2.5 | 1041.16 | 256203 | 60 | 0.47 | 630 |
| 3 | 1041.42 | 1346575 | 99 | 0.72 | 550 |
| 4 | 1042.00 | 2039330 | 129 | 0.85 | 390 |
| 5 | 1042.59 | 560145 | 143 | 0.94 | 210 |
| 6 | 1043.52 | 10931 | 78 | 1.00 | 50 |
| Low | High | |||||
|---|---|---|---|---|---|---|
| Component | log U | log | log U | log | ||
| (cm-2) | (cm-2) | |||||
| 0.5 | 2.63 | 1.28 | 18.0 | 0.16 | 19.5 | |
| 1 | 0.70 | 1.71 | 18.4 | 0.26 | 21.1 | |
| 2 | 0.87 | 1.66 | 18.1 | 0.20 | 20.7 | |
| 2.5 | 2.66 | 1.28 | 18.4 | 0.15 | 20.0 | |
| 3 | 0.11 | 2.05 | 18.4 | 0.56 | 22.0 | |
| 4 | 1.33 | 1.55 | 18.9 | 0.11 | 21.2 | |
| 5 | 1.59 | 1.48 | 18.5 | 0.03 | 20.6 | |
| 6 | 0.32 | 1.88 | 17.3 | 0.42 | 20.4 | |