Structure and dynamics of disks in galaxies
Abstract
One the most cited papers in astronomy is Ken Freeman’s 1970 paper on exponential disks in galaxies. In this contribution I review what has been done in this area since then and what we can infer about systematic properties of disks in galaxies from surface photometry, HI synthesis observations and measurements of stellar kinematics. Most disks have radial truncations at radial scalelengths . Galaxy disk thicknesses imply that these disk cannot be “maximum disks”. I briefly discuss a recent study of the “superthin” edge-on galaxy IC 5249.
Kapteyn Astronomical Institute, University of Groningen, P.O. Box 800, 9700 AV Groningen, the Netherlands, vdkruit@astro.rug.nl
1. Introduction
This meeting is a tribute to Ken Freeman, his research and that with his students. Ken’s most cited paper is undoubtedly “On the disks of spiral and S0 galaxies” (Freeman, 1970). Although it was de Vaucouleurs (e.g. 1959), who first showed observationally that the surface brightness distributions can be described by an exponential law, it was Ken in his seminal paper who collected the material available and studied the distribution of parameters and the dynamical relations. He derived the rotation curve and angular momentum distribution for an exponential disk in centrifugal equilibrium, found that 28 of the 36 galaxies have approximately the same face-on central surface brightness (known as “Freeman’s law”) and on the basis of the rotation curves of NGC300 and M33 concluded that there must be undetected matter of at least the mass of the detected galaxy.
| Author(s) | Year | Reference | Subject | ADS citations | ||
|---|---|---|---|---|---|---|
| Tot. | 9/0 | yr-1 | ||||
| Schönberg & | 1942 | ApJ 96, 161 | H-burning and | 57 | 5 | 1.0 |
| Chandrasekhar | S-C core | |||||
| Baade | 1944 | ApJ 100, 137 | Stellar populations | 129 | 5 | 2.3 |
| de Vaucouleurs | 1948 | An’Ap 11, 247 | -law | 388 | 42 | 7.5 |
| Spitzer & | 1951 | ApJ 114, 385 | Secular evolution of | 111 | 5 | 2.3 |
| Schwarzschild | stellar motions | |||||
| Sandage & | 1952 | ApJ 116, 463 | Giant-branch evolu- | 55 | 6 | 1.1 |
| Schwarzschild | tion; MS turn-off | |||||
| Hoyle & | 1955 | ApJSuppl 2, 1 | Giant-branch evolu- | 87 | 5 | 1.9 |
| Schwarzschild | tion; HR-diagrams | |||||
| Salpeter | 1955 | ApJ 121, 161 | Salpeter-function | 922 | 154 | 20.5 |
| Burbidges, | 1957 | RMP 29, 547 | Stellar nucleosyn- | 343 | 15 | 8.0 |
| Fowler & Hoyle | thesis | |||||
| Oort, Kerr & | 1958 | MN 118, 379 | HI structure of the | 40 | 2 | 2.0 |
| Westerhout | Galaxy | |||||
| Schmidt | 1959 | ApJ 129, 243 | SF; “Schmidt-law” | 376 | 39 | 9.2 |
| King | 1962 | AJ 67, 471 | King law | 440 | 42 | 11.6 |
| Sandage | 1962 | ApJ 135, 333 | NGC188 and chem- | 98 | – | 2.6 |
| ical evolution | ||||||
| Eggen, Lynden- | 1962 | ApJ 136, 748 | Collapse of the | 670 | 61 | 17.6 |
| Bell & Sandage | Galaxy | |||||
| Schmidt | 1963 | ApJ 137, 758 | G-dwarf problem | 227 | 10 | 6.1 |
| Toomre | 1964 | ApJ 139, 1217 | Local disk stability | 607 | 83 | 16.9 |
| Lin & Shu | 1964 | ApJ 140, 646 | Density wave theory | 232 | 18 | 6.4 |
| Goldreich & | 1965 | MN 130, 97 | Disk instability and | 128 | 14 | 3.7 |
| Lynden-Bell | 1965 | MN 130, 125 | spiral structure | 195 | 27 | 5.6 |
| King | 1966 | AJ 71, 64 | King models | 803 | 46 | 23.6 |
| Lynden-Bell | 1967 | MN 136, 101 | Violent relaxation | 347 | 25 | 10.5 |
| Schmidt | 1968 | ApJ 151, 393 | Quasars; -test | 504 | 34 | 15.8 |
| Tinsley | 1968 | ApJ 151, 547 | Photometric evolu- | 66 | 5 | 2.1 |
| tion | ||||||
| Freeman | 1970 | ApJ 160, 811 | Exponential disks | 820 | 84 | 27.3 |
| Freeman, San- | 1970 | ApJ 160, 831 | Origin of Hubble | 232 | 11 | 7.7 |
| dage & Stokes | types | |||||
| Searle | 1971 | ApJ 168, 327 | Disk abundance | 349 | 10 | 12.0 |
| gradients | ||||||
| Peebles | 1971 | A&A 11, 377 | Origin of angular | 54 | 5 | 1.9 |
| momentum | ||||||
| Toomre & Toomre | 1972 | ApJ 178, 623 | Interacting galaxies | 785 | 90 | 28.0 |
| Searle, Sargent & | 1973 | ApJ 179, 427 | Photometric evol- | 337 | 20 | 12.5 |
| Bagnuolo | ution of galaxies | |||||
| Ostriker & | 1973 | ApJ 186, 467 | Disk stability and | 439 | 29 | 16.3 |
| Peebles | dark halos | |||||
| Tully & Fisher | 1977 | A&A 54, 66 | TF-relation | 547 | 63 | 23.8 |
| Wielen | 1977 | A&A 60, 263 | Secular evolution of | 220 | 29 | 9.6 |
| stellar motions | ||||||
| Larson & Tinsley | 1978 | ApJ 219, 46 | Photometric evolu- | 554 | 29 | 25.2 |
| tion | ||||||
| Searle & Zinn | 1978 | ApJ 225, 357 | Globular clusters | 539 | 58 | 24.5 |
| and halo formation | ||||||
| Tinsley | 1980 | FCP 5, 287 | Photometric and | 449 | 57 | 15.0 |
| chemical evolution | ||||||
| van der Kruit & | 1981 | A&A 95, 105 | 3-D galaxy disk | 280 | 20 | 14.8 |
| Searle | model | |||||
| Gilmore & Reid | 1983 | MN 202, 1025 | Galactic thick disk | 291 | 16 | 17.1 |
It is of some interest to see how Ken’s 1970-paper compares in citation rate to others. For this purpose I collected such information using the NASA Astrophysics Data System (ADS). The citation scores in ADS are not complete, but certainly indicative and internally consistent. The first exercise was to draw up a list of what I feel are the most important papers related to studies of structure of galaxies. In Table 1 I give the total citation score up to the end of 2000, that for 1999+2000 (“9/0”) and the average number of citations per year. In this listing I find only a few papers that are comparable or exceed Ken’s 1970-paper in citations. These are Ed Salpeter’s 1955 paper on star formation in the Galactic disk in which he defines the “Salpeter function”, Ivan King’s 1966 paper on the dynamics of globular clusters and the “King models” and the study by the Toomre & Toomre in 1973 on models for interacting galaxies.
To complete the search I also checked in ADS which papers between 1945 and 1975 were annually the most highly cited papers in Ap.J. (main journal), A.J., M.N.R.A.S. and A&A. One that comes close is the galaxy redshift survey of Humason et al. (1956) (754 citations, 16 in 1999+2000). Outside the field of galaxies there are two papers that clearly exceed it, namely Shakura & Sunyaev (1973; A&A 24, 337; 1823 citations and 313 in 1999+2000) on the appearance of black holes in binary systems and Nino Panagia (1973, AJ 78, 929; 1026 and 46) on parameters of early type stars, while Brocklehurst (1971, MN 153, 471; 787 and 28) on hydrogen population levels in gaseous nebulae comes close.
In any case, Ken’s 1970 paper is well within the absolute top ten of citation scores of papers in astronomy and deservedly so.
2. Properties of disks
The exponential nature of the light distribution in galactic disks was extended to a three-dimensional model using the self-gravitating isothermal sheet description for the vertical distribution (van der Kruit & Searle, 1981)111As explained in that paper, the idea to use the isothermal sheet was inspired by a remark made by Ken Freeman during IAU Symposium 77 in 1978.:
| (1) |
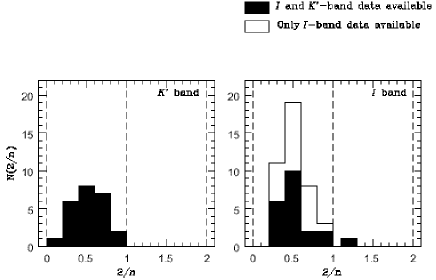
The isothermal assumption was later dropped and replaced by the family of models (van der Kruit, 1988)
| (2) |
This ranges from the isothermal distribution () to the exponential function (). From actual fits in and de Grijs et al. (1997) found (Fig. 1)
| (3) |
I will take the whole range from the sech-function to the exponential (that is ; ) into account in what follows, which is reflected in the “uncertainties” in the coefficients in the equations below.
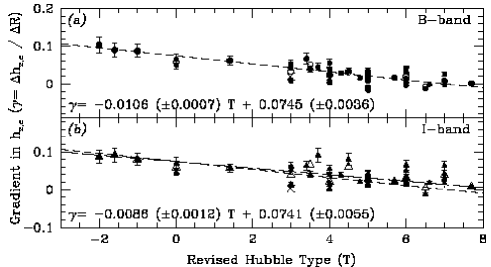
The constancy of the vertical scaleheight with radius has been studied in detail by de Grijs & Peletier (1997) (see Fig. 2) in the optical and near-IR and been confirmed at least for late-type galaxies. Disks in early type disks might have a small variation of with radius.
With a constant mass-to-light ratio , the luminosity density is proportional to the space density . Then the surface density becomes
| (4) |
the vertical velocity dispersion in the plane
| (5) |
and the z-velocity dispersion integrated perpendicular to the plane
| (6) |
For the vertical velocity dispersion of the stars we expect for a constant
| (7) |
This is consistent with observations by van der Kruit & Freeman (1986) and in Roelof Bottema’s thesis (1995, see also 1993), at least out to about 2 scalelengths (in ). Furthermore, Rob Swaters in his thesis (1999; chapter 7) found it also in the late-type dwarf UGC 4325, again out to about 2 scalelengths. On the other hand, Gerssen et al. (1997) could not confirm it in NGC 488: they suggest that the scalelength in is not representative for the mass distribution. Also, NGC 488 is of early type and may not have a constant . So, the verification of eq. (7) is not complete. It is important to obtain -band surface photometry for NGC 488 and the other galaxies in Bottema’s sample.
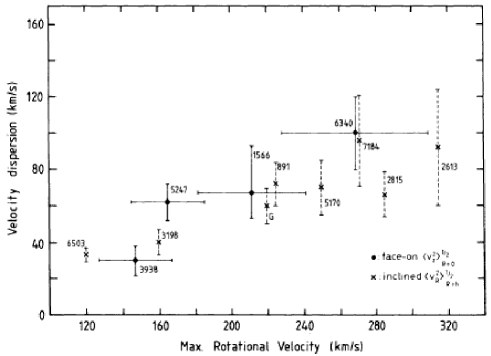
Bottema also found from a sample of 12 galaxies that the (extrapolated) vertical dispersion at the center and the radial one at one scalelength
| (8) |
where is the rotation velocity in the flat part of the rotation curve (Fig. 3). Even the late-type dwarf UGC 4325 was found to follow this relation (Swaters, 1999; km/s, km/s). It probably arises as follows:
Take the equation for the Toomre (1964) parameter for local stability
| (9) |
Use a Tully-Fisher relation with and note that for a flat rotation curve the epicyclic frequency . Then (9) can be rewritten as
| (10) |
Here is the central face-on surface brightness in ; and refer to the old disk population. So the Bottema relation implies that
| (11) |
even for low surface brightness dwarfs. Observations of course allow a substantial scatter in this quotient (or the individual terms) among galaxies.
For “normal” disks obeying “Freeman’s law” translates into 21.7 B-mag arcsec-2 and this then implies
| (12) |
If we ignore for the moment the (dynamical) influence of the gas, it can be shown (van der Kruit & de Grijs, 1999) that at
| (13) |
Here again the “uncertainty” in the coefficient relates to the range of vertical density distributions above. With the Bottema relation (8) this reduces to
| (14) |
In the solar neighborhood the axis ratio of the velocity ellipsoid (Dehnen & Binney, 1998). If this also holds at and using kpc and kpc, it follows that
| (15) |
The HI-layer thickness can be used to estimate the disk surface density. HI observations of face-on galaxies (e.g. van der Kruit & Shostak, 1984) indicate an HI velocity dispersion km s-1. We can write (van der Kruit, 1981)
| (16) |
Another estimate of the disk mass follows from the global stability criterion of Efstathiou et al. (1982)
| (17) |
For a pure exponential disk the maximum in the rotation curve (Freeman, 1970) occurs at with an amplitude
| (18) |
Hydrostatic equilibrium at the center gives
| (19) |
Eliminating between (18) and (19) and using the Bottema relation (8) gives
| (20) |
So, the flattening of the disk can be used to test the “maximum disk hypothesis”, for which fits to rotation curves usually give about 0.8 to 0.9 for this ratio.

3. Observations of disks
The most extensive study of the photometric disk parameters in
the optical and near-IR is that of
a statistically complete sample of 86 disk dominated galaxies in
Roelof de Jong’s thesis (1995, 1996abc; de Jong & van der Kruit, 1994).
Some of his conclusions are:
Freeman’s law is really an upper limit to the central surface
brightness.
The scalelength does not correlate with Hubble type.
In disks fainter regions are generally bluer, probably
resulting from a combination of stellar age and metallicity gradients.
Outer regions are on average younger and of lower abundance.

Richard de Grijs (1997, 1998; de Grijs & van der Kruit, 1996) presented
optical and near-IR surface photometry of a sample of 47 edge-on galaxies.
The data have recently been re-analysed by Kregel et al. (2001;
see also de Grijs et al., 2001) with a new and improved
2-D fitting procedure. Some results (Fig. 4 and 5):
Both and correlate in general terms
with .
For this is expected from the Tully-Fisher
relation.
Our Galaxy would be somewhat unusual if the scalelength
is as small as 2 to 2.5 kpc as some recent studies claim (see also van
der Kruit, 2000).
The flattening of the sample after volume correction is
. Then
| (21) |
So most galaxies appear not to be “maximum disk”. Recall that this
result follows directly from the observations using only the rotation
curve of the self-gravitating exponential disk, hydrostatic equilibrium
and Bottema’s (empirical, but explainable) relation (8).
Bottema (1993) derived a similar result in the analysis of his sample
of galaxies, in which he measured the stellar kinematics and found
.
At least 20 of the spirals show radial truncations.
The ratio of the truncation radius and the scalelength is
.
But large galaxies have smaller values for this ratio than
small ones.
For common disks with scalelengths of 5 kpc or less, the ratio
is about 4.
The truncation radius in a simple view results from the maximum specific angular momentum of the sphere from which the disk collapsed. Van der Kruit (1987), in the context the Fall & Efstathiou (1980) picture of disk galaxy formation, then predicted a value of 4.5 for the ratio, based on a Peebles (1971) spin parameter of 0.7. Dalcanton et al. (1997) have extended this to a models with a dispersion in the spin parameter. We have calculated model surface density profiles with their method for and . These are the lines in Fig. 5b.
For completeness I mention that in many cases there is a warp in the HI-layer in the outer parts, often starting roughly at the truncation radius. This suggests that the warp material has been accreted subsequent to disk formation.
4. IC 5249
The “superthin” disk galaxy IC 5249 has recently been studied by van der Kruit et al. (2001). In this paper, we re-analyse the ATCA HI observations reported in Abe et al. (1999), use the photometry of three Ken Freeman students, Claude Carignan (1983), Richard Wainscoat (1986) and Yong-Ik Byun (1992, 1998), and present a measurement of the stellar kinematics.
The HI observations show –contrary to the conclusions of Abe et al.– a rotation curve that is flat over a large part of the disk at km s-1. From the available photometry we adopt kpc, kpc, B-mag arcsec-2 and kpc. Note that is larger than that in our Galaxy! It follows that IC 5249 appears on the sky as a very thin disk, because it combines a low surface brightness with a very long scalelength and a truncation radius after only about 2.5 scalelengths.
From our data we can derive various kinematical and dynamical properties, using the equations given above.
| kpc | kpc | |
| (km/s) | 25-30 | – |
| (km/s) | ||
| (km/s.kpc) | ||
| (km/s.kpc) | ||
| (km/s) | – | |
| Asym. drift (km/s) | – | |
| (km/s) | – | |
| pc-2) | ||
| (km/s) | ||
| (FWHM)HI (kpc) |
At kpc the stellar velocity dispersions are similar to the solar neighborhood, while the surface density of the disk is about half that of the solar neighborhood. Star formation must have proceeded much slower in IC 5249 in order to give the low surface brightness. But, surprisingly, as much dynamical evolution has occured as in the Galactic disk. Also note that with , IC 5249 falls on the Bottema relation (8).
Acknowledgments.
I am grateful to the Mount Stromlo Observatory and John Norris for hospitality during the preparation of this review. Michiel Kregel kindly allowed me to quote from our recent paper and provided Fig.s 4 and 5. I thank Ken Freeman for stimulating discussions and collaborations over many years and wish him well.
References
Abe, F. et al. (another 34 authors), 1999, AJ, 118, 261
Bottema, R., 1993, A&A, 275, 16
Bottema, R., 1995, Ph.D. Thesis, University of Groningen
Byun, Y.-I, 1992, Ph.D. Thesis, Australian National University
Byun, Y.-I., 1998, Chin. J. Phys., 36, 677
Carignan, C., 1983, Ph.D. Thesis, Australian National University
Dalcanton, J.J., Spergel, D.N., Summers, F.J., 1997, ApJ, 482, 659
de Grijs, R., 1997, Ph.D. Thesis, University of Groningen
de Grijs, R., 1998, MNRAS, 299, 595
de Grijs, R., Kregel, M., Wesson, K.H., 2001, MNRAS, 324, 1074
de Grijs, R., Peletier, R.F., 1997, A&A, 320, 21
de Grijs, R., Peletier, R.F., van der Kruit, P.C., 1997, A&A, 327, 966
de Grijs, R., van der Kruit, P.C., 1996, A&AS, 117, 19
de Jong, R.S., 1995, Ph.D. Thesis, University of Groningen
de Jong, R,S., 1996a, A&AS, 118, 557
de Jong, R.S., 1996b, A&A, 313, 45
de Jong, R.S., 1996c, A&A, 313, 377
de Jong, R.S., van der Kruit, P.C., 1994, A&AS, 106, 451
de Vaucouleurs, G. de, 1959, ApJ, 130, 728
Dehnen, W., Binney, J.J. 1998, MNRAS, 298, 387
Efstathiou, G., Lake, G., Negroponte, J., 1982, MNRAS, 199, 1069
Fall, S.M., Efstathiou, G., 1980, MNRAS, 193, 189
Freeman, K. C., 1970, ApJ, 160, 811
Gerssen, J., Kuijken, K.H., Merrifield, J., 1997, /mnras, 288, 618
Kregel, M., van der Kruit, P.C., de Grijs, R., 2001, MNRAS, submitted
Peebles, P.J.E., 1971, A&A, 11, 377
Swaters, R.A., 1999, Ph.D. Thesis, University of Groningen
Toomre, A., 1964, ApJ, 139, 1217
van der Kruit, P.C., 1981, A&A, 99, 298
van der Kruit, P.C., 1987, A&A, 173, 59
van der Kruit, P.C., 1988, A&A, 192, 117
van der Kruit, P.C., 2000, In: “The Legacy of J.C. Kapteyn”, eds. P.C. van der Kruit & K. van Berkel, Kluwer, Dordrecht, p. 299
van der Kruit, P.C., de Grijs, R., 1999, A&A, 352, 129
van der Kruit, P.C., Freeman, K.C., 1986, ApJ, 303, 556
van der Kruit, P.C., Jiménez-Vicente, J., Kregel, M., Freeman, K.C., 2001, A&A, submitted
van der Kruit, P.C., Searle, L., 1981, A&A, 95, 105
van der Kruit, P.C., Shostak, 1984, A&A, 134, 258
Wainscoat, R.J., 1986, Ph.D. Thesis, Australian National University
Discussion
King: One of the tightest correlations you showed was between and . What does mean, and is there any obvious reason for such a tight correlation?
van der Kruit: is the truncation radius. The tightness of the correlation results from the fact that over scalelengths in the range from 1 to 15 kpc or so, the truncation radius occurs at 3 – 4 scalelengths. I have commented on this in the paper above.
Byun: In the 1970 Freeman paper, disk galaxies were divided into two groups, type I and type II. Type II galaxies had exponential disks which do not continue into the centers. What are our current understandings of these type II galaxies?
van der Kruit: Although there still are some systems having profiles that were called type II, it appears that these no longer make up a substantial fraction of the observed profiles. The prime example, M83, is barred and the bar may be the cause of this behavior, but there are also galaxies that are unbarred and display the type II characteristic. But again it no longer is an important class in modern surface photometry profiles.
Fall: My impression is that realistic angular momentum distributions produced by hierarchical clustering do not have the sharp features that would lead to edges in the disks. My preferred explanation for the edges at is in terms of local instabilities in the disks (Goldreich & Lynden-Bell and Toomre-type instabilities222The references to the papers by Goldreich & Lynden-Bell (1965) and Toomre (1964) appear in Table 1 [PCvdK]). George Efstathiou and I showed these would give rise to .
van der Kruit: I am aware of the Fall & Efstathiou (1980) explanation. Actually, in my third paper with Leonard Searle on edge-on galaxies (A&A, 110, 61, 1981) we refer to this and find that it predicts truncations at times the observed ones for our sample.
van der Kruit: After the session Mike Fall suggested
that the conclusion that the maximum disk hypothesis does not apply to
most galaxies using the disk flattening may be affected by underestimating
the scaleheight due to the presence of stellar generations in the disks
with a range in vertical velocity dispersions and scaleheights. The younger of
these are brighter and their smaller dispersions lead to a lower scaleheight
in the photometry than in the mass distribution. It is well-known that the
observed diffusion of stellar random motions gives –according to
observations in the solar neighborhood– a velocity dispersion
proportional to and Mike points out that the
stellar generations therefore have a scaleheight proportional
to age. I was urged by some participants to reply to this.
According to eq. (20) a systematic underestimate of the scaleheight
results in an overestimate in the ratio and allowing for it then takes the disks even
further from maximum disk. However, the effect must also
occur for the observed velocity disperions in face-on disks,
so Bottema would systematically have
underestimated the dispersions resulting in an underestimate of the
coefficient in eq. (8) and (20). I have returned to some old notes to myself on
this and updated these. In view of the potential importance of the
effect I document this here.
The luminosity of a generation of
stars as a function of age can be estimated in three ways. First look at
the luminosity of the main sequence (MS) turn-off stars. The stellar MS
luminosity is roughly proportional to and MS lifetime to
. So luminosities are roughly proportional to
. Secondly, we
may look at the giants only. I estimate from evolutionary tracks that at
the tip of the giant branch the luminosity is crudely
proportional to the mass on the MS (at least for stars between one and a few
solar masses; MS lifetimes of 1 to 10 Gyr), so that . Finally, single burst models of photometric evolution can be
used. A nice example is illustrated in Binney & Merrifield (Galactic
Structure; Princeton Univ. Press, 1998) in Fig. 5.19 on page 318. The
is proportional to age, so that the luminosity of a single
burst . This is –as expected– nicely in
between and .
To estimate the effect it is most practical to look at the integrated
velocity dispersion in a face-on disk. The weighted velocity dispersion
can then be estimated by integrating over the relevant ages in
To estimate the error this should then be compared to the case of equal weighing of the generations
We had and may take for late type disks as a
reasonable approximation a constant star formation rate SFR.
In order to check the effect on the scaleheights the best approximation is
to use . The results depend on the range in we take to
perform the integration. Since fits for are made above the
dust lanes we need to ignore the youngest generations. As examples I
take the integration from 2 and 3 to 10 Gyr ; this means ignoring generations
in which the scaleheights are
less than 0.2 and 0.3 times that of the oldest generations. The values for
are then underestimated by
respectively 9 and 6% and the scaleheights by 17 and 11%.
For the effect on the velocity dispersions we have to take
, since thes are measured by comparing to a late-GIII or
early-KIII template star. The galaxy spectra refer in practice for this
mostly to interarm regions, so it
is fair to take the lower limit in the integration now at 1 or 2 Gyr.
Then is underestimated by
respectively 8 and 4%. Even if the lower integration limit is set to zero
(assuming red supergiants fit the luminosity class III template star),
the error is only 18%.
So, the effects are small and furthermore in an application of eq. (20)
we need to take the square root of the
scaleheight, while the two effects work in opposite directions.