1]Center for Astrophysics at Notre Dame, Physics Dept., University Of Notre Dame, Notre Dame Indiana 46556 USA
John Poirier (poirier@nd.edu)
A Project GRAND Study of the GLE of July 14, 2000
Abstract
The Ground-Level Event (GLE) associated with the X5.7 solar flare of July 14, 2000 is studied by the Project GRAND proportional wire chamber array. Results are compared to those obtained by the Climax Neutron Monitor experiment which detects secondary neutrons. The Climax monitor, located in Climax, Colorado, is operated by the University of Chicago. The time of the GLE signal of the Climax station is examined for a possible coincident signal in the data of Project GRAND. Project GRAND is an array of 64 proportional wire chamber stations. The stations are sensitive to secondary muons with energies greater than 0.1 GeV. The mean energy of primaries which produce these ground level muons depends on the spectral index of the primary spectrum. For a differential spectral index of 2.4, the most probable primary energy is 10 GeV falling rapidly below this energy and falling slowly above this energy.
1 Introduction
Solar flares release a large amount of energy, typically to Joules. Charged particles are also accelerated to high speeds and can escape into interplanetary space as solar cosmic rays (Carroll and Ostlie, 1996). The detection of these particles on the Earth at ground level is referred to as a Ground Level Event (GLE). A GLE may be the result of showers of particles produced by the interaction between the atmosphere and the high energy primary. Solar flares are classified by their X-ray flux; an X class flare is the strongest type of flare and has, for example, a flux in excess of W/m2.
An X5.7 solar flare was reported on July 14th, 2000. According to X-ray data, the flare lasted from 10:03 UT through 10:43 UT with a peak at 10:24 UT (IPS Radio & Space Services Website, 2001). Data from Project GRAND (Project GRAND Website, 2001), an array of proportional wire chambers, is studied and compared to data obtained with the Climax Neutron Monitor (Space Physics Data System Website, 2001) during the time of the flare. Project GRAND (41.7∘N, 86.2∘W at 220 m) studies secondary muons and so is more likely to see an increase in counting rate that is time coincident with neutron monitor data than at the time of the X-ray data. The Climax Neutron Monitor station located in Climax, Colorado (39.4∘N, 253.8∘W at 1040 m) detected a Ground Level Event with onset time of 10:33 UT and peak time of 10:42 UT (Lopate, 2001). Their peak flux increased 6% over background, or a 10 statistical increase. The data from Climax are shown in Figure 1.
During the peak time of the flare the sun was at 113.6, 21.7 (Astonomical Almanac, 2000); placing the sun at an altitude of 0.4∘ and an azimuth of 60.7∘ at Project GRAND at the peak time of the flare. The interplanetary magnetic field of the sun intersects the Earth at angle relative to the Earth-sun line. The charged particles travel within a cone relative to this magnetic field (Lopate, 2001). This allows particles to be detected even though the sun is below the minimum altitude for Project GRAND (27∘). Because the particles still originate from roughly the same general direction as the sun, there should be a larger counting rate from particles originating from our eastern hemisphere (where the sun was located). Also, because these particles’ velocity is less than the speed of light and do not follow a straight line path, the GLE should be detected at a slightly later time than the X-ray event.
Project GRAND detects ground level muons originating from primaries whose energies are dependent on the differential spectral index. With a differential spectral index of 2.41, the most probable energy of the primaries is GeV (Fasso and Poirier, 2001); a lower index gives a higher primary energy. Climax detects particles above their geomagnetic cutoff energy of 3 GeV. Thus project GRAND is expected to see the GLE from the flare slightly earlier than Climax due to the higher energies (velocities) of the particles.
2 Experimental Array
Project GRAND is an array of 64 proportional wire chamber stations. Each station is composed of four sets of two orthogonal planes with each plane containing 80 detection cells of 14 mm width. The sets of planes are positioned above each other with 200 mm of separation between each pair of planes. This geometrical arrangement allows for the measurement of the direction of a muon track to within 0.26 degrees, on average, in each of the two projected planes. There is also a 50 mm steel plate above the bottom two planes. This steel plate and the two additional planes of proportional wire detector planes underneath enable tracks of secondary muons to be distinguished from electron tracks. A data rate of 2000 muons per second is currently being recorded with the GRAND array.
Information from each detector station is sent serially to a central computor at a rate of 10 MHz. The data from the 64 stations are read in parallel into a central data acquisition system in 70 microseconds. Eight CPU nodes are used in sequence, each in turn receiving data from all 64-stations as one event. The CPU’s task is to search the hits from 512 proportional wire planes and remember the wire numbers from the eight planes in any station which had one and only one hit on each plane of that station. Eight nodes operating in sequence perform this task with minimal dead time. Once a particular node has accumulated data on 900 muons in its buffer memory, the data buffer is written as one record on magnetic tape. The start time and end time of each record is recorded along with the wire numbers defining the angles for each of the accumulated 900 muons. Radio signals from WWVB in Boulder, Colorado, provide time information with precision of a millisecond.
3 Data Analysis
Project GRAND has a continuous data file starting at 9h UT on July 13 and running through 15h UT on July 14, allowing easy analysis of the data at the time of the flare as well as providing a significant amount of background data. The beginning and end time for each record of 900 muons were written to magnetic tape. The end time of the current record is compared to the end time of the previous record from that CPU; the times for each of the individual 900 muons are then interpolated evenly within that time interval. The average duration of a record during this time was 3.2 seconds.
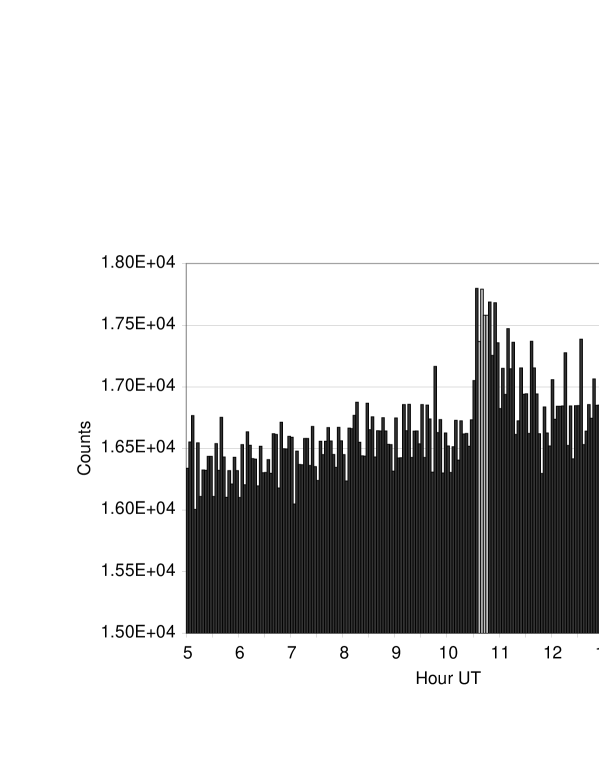
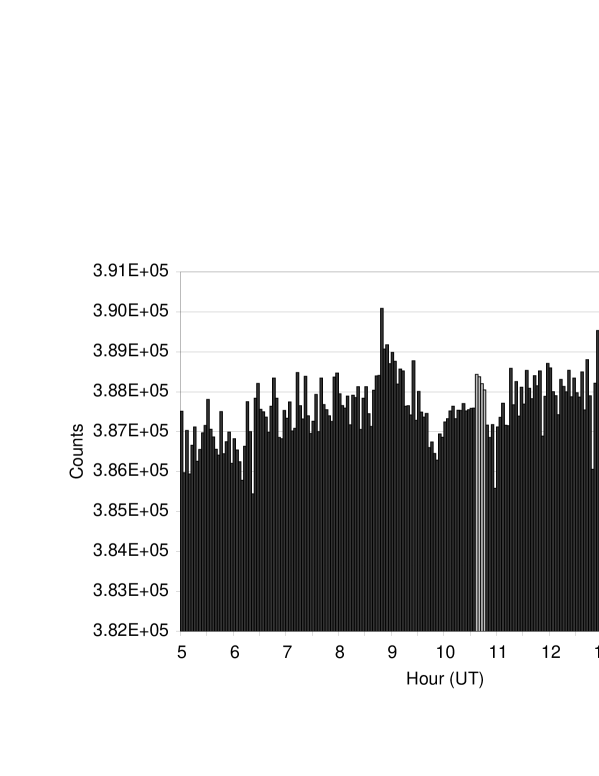
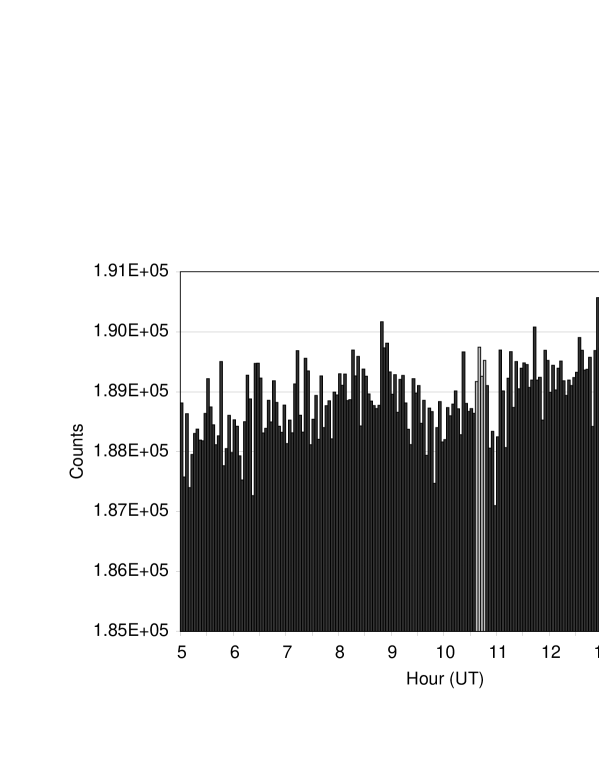
The muon counts are binned in 180 second bins. Data were examined for the total muon count (Figure 2) as a function of time as well as for counts of muons originating only from the eastern hemisphere (Figure 3). The rms deviation over this time interval is compared to the square root of the number of counts per bin to see if there are additional fluctuations in the data beyond the statistical. The rms deviation of the muon counts in this interval was 606 compared to the square-root error estimate of 622. For muons from only the eastern hemisphere, the rms deviation and square root error were 616 and 434, respectively, suggesting that the data from only the eastern hemisphere perhaps have additional components of variation beyond the statistical. The time period of 10.6 to 10.8h is examined using four 180 second bins for a possible counting excess. The background regions were one hour just before and one hour just after the signal region. This is ten times as much background time as signal time. The muon excess in the signal region was calculated by taking a difference between the counts in the signal region minus the average number of background counts received in an equal amount of time.
*
*
*
4 Conclusions
Project GRAND detects muons which have decayed from pions created predominantly through hadron-air interactions. The Climax Neutron Monitor detects secondary neutrons from interactions between the primaries and air. The Climax GLE has an onset time at 10.55 h and a peak time of 10.70 h. The entire period of increased rate is 50 minutes. The peak flux is an increase of 6% (over a ten-sigma statistical increase). The mean flux during the fifty minute period of increased rate is 7 above background (Lopate, 2001).
Over the interval of 10.6 - 10.8 hrs, using bins of width 180 seconds and a background one hour before and one hour after the interval, there is a possible excess above background of 33811307 counts, or 2.6 , calculated using statistical error (because in this case it is larger than the rms error). For muons of eastward origin, there is a possible excess of 25361295 or 2.0 (calculated using the larger rms error in this case). If these were interpreted as a statistical fluctuation, then they would have a probability of and , respectively.
Acknowledgements.
The authors wish to thank Cliff Lopate for his assistance. The Climax Neutron Monitor is operated by the University of Chicago and is supported by National Science Foundation Grant ATM-9912341. Project GRAND is supported through grants from the University of Notre Dame and private donations.References
- Astonomical Almanac (2000) Larson, D. and Holdway, R. ed., 2000 Astronomical Almanac. U.S. Government Printing Office, Washington D.C., published 1999.
- Carroll and Ostlie (1996) Carroll, B. and Ostlie, D., An Introduction to Modern Astrophysics, Addison-Wesley Publishing Company, Inc., New York, 1996.
- Fasso and Poirier (2001) Fasso, A. and Poirier, J., Phys. Rev. D 63, 036002, 2001.
- IPS Radio & Space Services Website (2001) IPS Radio and Space Services website, World Wide Web: http://www.ips.gov.au
- Lopate (2001) Lopate, C. private communication, 2000-01.
- Poirier et al. (2001) Poirier, J. et al, 2001 astro-ph/0103030.
- Project GRAND Website (2001) Project GRAND Website, World Wide Web: http://www.nd.edu/grand.
- Space Physics Data System Website (2001) Space Physics Data System Website, World Wide Web: http://ulysses.uchicago.edu/NeutronMonitor/neutron_mon.html.