Multiwavelength Studies of PSR J14206048, a Young Pulsar in the Kookaburra
Abstract
We present X-ray, radio, and infrared observations of the 68 ms pulsar PSR J14206048 and its surrounding nebula, a possible counterpart of the ray source GeV J14176100/3EG J14206038. Pulsed X-ray emission at the radio period is marginally detected by ASCA from a source embedded in the hard spectrum X-ray nebula AX J1420.16049. At radio wavelengths, the pulsar is found to be strongly linearly and circularly polarized, and the polarization sweep is measured. A comparison of high resolution ATCA radio imaging of the Kookaburra’s upper wing (G313.6+0.3), which contains the pulsar and the X-ray nebula, with infrared images suggests the radio emission is partly non-thermal.
1 Introduction
The X-ray source AX J1420.16049 is one of two extended, hard spectrum sources whose positions are consistent with the ray source GeV J14176100/3EG J14206038 (Roberts & Romani, 1998; Roberts, Romani, & Kawai, 2001). Radio images of the region from the Molonglo Synthesis Telescope (MOST) Galactic Plane Survey (Whiteoak, Cram, & Large, 1994; Green et al., 1999) and the Australia Telescope Compact Array (ATCA) (Roberts et al. 1999, hereafter R99) reveal a complex of compact and extended radio sources. This complex, known as the Kookaburra, consists of a shell with two “wings” stretching to the northeast and the southwest. There is also a bright HII region and several compact extra-Galactic sources in the field. AX J1420.16049 is coincident with a slight enhancement (K3 of R99) in the northeast wing. Low resolution 60 m imaging of this region shows evidence of thermal emission from the shell but shows a lack of emission from the wings. However, the low resolution and artifacts from the HII region prevent strong constraints to be derived from this image. The paucity of infrared emission along with the spectral index of the wing containing AX J1420.16049, although poorly constrained, hint at a non-thermal origin for the radio emission.
The 68.2 ms pulsar PSR J14206048 was recently discovered during the Parkes Multibeam Survey at a position consistent with AX J1420.16049 (D’Amico et al., 2001). Timing measurements have determined a characteristic age of yr, and a very high inferred spin-down energy ergs/s. This energy output is higher than all the known -ray pulsars except for the Crab, and is similar to the recently discovered pulsar and pulsar wind nebula (PWN) PSR J2229+6114, the likely counterpart of the ray source 3EG J2227+6122 (Halpern et al., 2001). PSR J14206048 has been monitored since 1998 October, and was observed to glitch in late 2000. In this letter, we report on X-ray spectral and timing analyses of a 1999 ASCA observation of AX J1420.16049, sensitive radio pulse profile and polarization measurements made with the Parkes radio telescope, high-resolution 20cm radio imaging with the ATCA, and high resolution infrared imaging at 60 m and 8.3 m.
2 ASCA Observations
On Feb. 13-15, 1999, ASCA re-observed GeV J14176100 centered on the two X-ray nebulae. Approximately 63 ks (ks with high-bit rate telemetry) of exposure was obtained with the Gas Imaging Spectrometers (GIS2,GIS3) in standard PH mode with no timing bits. Image and spectral analyses of the field have previously been reported in Roberts, Romani, & Kawai (2001), and we use similar reduction and analysis procedures here. Since the source fell near the edge of the SIS detectors, we restrict our analysis to the GIS data.
AX J1420.16049 is seen by ASCA to be significantly extended. However, there is a central concentration in AX J1420.16049 whose centroided position is from the radio position of the pulsar (see below). This is larger than the nominal 90% position uncertainty (Gotthelf et al., 2000), but is consistent with the 97% contour; we assume the peak of the X-ray emission is at the position of the pulsar in the following analsysis.

In general, timing solutions for young, glitching, pulsars such as PSR J14206048 cannot be reliably extrapolated back to previous observation epochs. Therefore, timing studies of the earlier ASCA dataset (1997 epoch) and the data are problematic. Fortunately, contemperaneous radio data is available for the 1999 ASCA observations (D’Amico et al., 2001). These were observed in default observing mode which has a nominal time resolution of . However, the reason for such a large nominal uncertainty in arrival time is a timing ambiguity which is only important for sources with extremely high count rates ( cps). For low count rate sources such as PSR J14206048, the time assignment precision of the GIS is equal to the telemetry output period ( ms for high bit-rate data, ms for medium bit-rate, Hirayama et al. 1996). Using the high bit-rate GIS data set, we extracted 1-10 keV photons from a 6 pixel radius region (, roughly corresponding to the half-power radius of the ASCA PSF) centered on the position of the X-ray peak. The small extraction region was chosen to minimize the photon contribution from the surrounding nebula. The resulting 314 photon arrival times were then corrected to the Solar System barycentre. Using the radio period and period derivative to determine arrival time phases, an H-test analysis was performed to determine the significance of any periodicity (de Jager, 1994) resulting in a test statistic value of 12.95. The formal chance probablity for a value this large is 0.0056, which we verified by examining the H-test values of independent nearby periods on the same dataset.
The telemetry times used by ASCA are delayed from the true arrival time by an offset of 8.5 ms , where has an approximately uniform probability of being any value between s and s ( s for the medium bit-rate data) (Hirayama et al., 1996). To extract the best folded light curve, we take into account this delay as well as the arbitrary placement of bin boundaries by assigning a fractional value to adjacent bins according to the probability of a photon belonging in each. The result is shown in Figure 1. The absolute phasing of this method was verified with an offset observation of the Crab pulsar taken in the same mode and folded using the Jodrell Bank ephemeris. For PSR J1420-6048, the X-ray pulse ranges in phase from referenced to the radio pulse maximum. A similar analysis with the medium bit-rate data resulted in a profile consistent in amplitude and phase with a highly smoothed version of the high bit-rate data. The formal H-test chance probability of the medium bit-rate data is only 0.14.
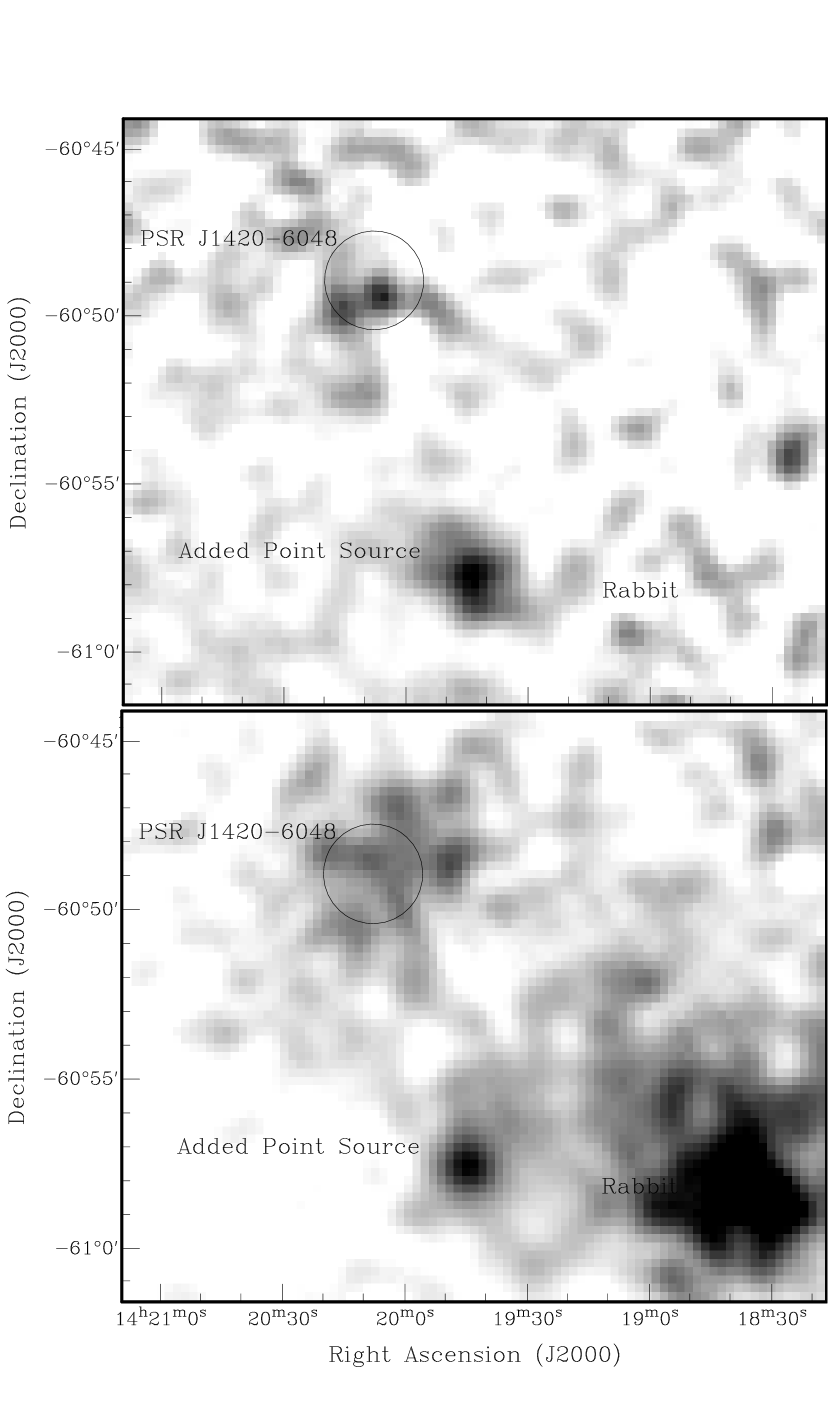
The above phase window was used to make on-pulse and off-pulse 1-10 keV images from the high bit-rate data. The off-pulse image was scaled and subtracted from the on-pulse image to create a pulsed-only image, which was then exposure corrected and smoothed with a 1.7 pixel Gaussian (roughly the width of the GIS PSF peak). A particle background image made from the night earth calibration files was subtracted from the off-pulse image, which was also exposure corrected and smoothed. The resulting pulsed-only and off-pulse images are presented in Figure 2. A radial profile comparison of these images to point-source calibration images for nearby positions on the detector, (one such is added as a reference to the images in Figure 2) show the pulsed-only profile to be consistent with that of the calibration source while the off-pulse profile is virtually flat out to and then slowly falls off. This provides additional support to the pulse detection.
The overall X-ray flux for the entire data set of high and medium bit-rate data is adequately fit by a power-law with with significant absorption () and a 2-10 keV flux of . Weak evidence for an Fe K line (EW eV) suggests that some thermal emission may also be present in the region. In order to estimate the magnitude of the apparent pulsed flux, a extraction radius was used to create on-pulse and off-pulse spectra from the high bit-rate data using a slightly larger phase range of 0.575-0.775 to maximize inclusion of the pulsed emission. This extraction region is roughly twice the point spread function full width half max, but is smaller than the nominal in order to limit noise due to photons from the surrounding nebula. Using the off-pulse spectrum as a background, and fixing the at the value for AX J1420.16049 as a whole, the resulting spectrum is adequately fit by either a power law or blackbody, with a 1-10 keV flux of roughly ergs .
3 Parkes Radio Timing Observations
PSR J14206048 was observed on May 20, 2001 with the Parkes 64m radio telescope as part of a program of high time-resolution observations of Vela-like pulsars (Johnston & Romani, 2002). The central feed of the 13 beam, 21 cm multi-beam system was used. The signal was split in two and sent to two different back-ends. One was a dual polarization, 512 channel filterbank receiver with a central observing frequency of 1517.5 MHz and a 256 MHz bandwidth, where the two polarizations were summed, fast sampled, one-bit digitized and written to storage tape for off-line de-dispersion and pulse folding. This was used for the high-resolution profile. The second back-end was a 128 MHz bandwidth correlator with somewhat lower frequency resolution, but which retained the full polarization information and was used for the polarization analysis.
A 4 hour integration on PSR J14206048 folded at the contemporary radio ephemeris produced the high resolution pulse profile in Figure 1. The pulsar has a broad profile ( = 16 ms at 10% of the peak flux) with two well separated components. We have set radio phase 0 (the maximum of the second peak) to the phase of the radio pulse at the (pre-glitch) ephemeris used to fold the X-ray data.

Figure 3 shows the polarization profiles of the radio peaks at ms effective time resolution. The pulse shows a high fractional linear polarization (), with a smooth position angle swing. High linear polarization appears to correlate with high spindown luminosity (Crawford, Manchester, & Kaspi, 2001) and PSR J14206048 supports this trend. A simple Radhakrishnan & Cooke (1969) rotating vector model fit to the position angle produces an adequate fit to the sweep for small impact parameters () and small magnetic inclinations , although the latter angle is relatively poorly determined. We have also extracted the rotation measure , which together with the previously measured dispersion measure gives a mean line-of-sight magnetic field strength of , pointed away from the observer. The pulsar also shows very strong (right handed) circular polarization, particularly in the second peak where the circular polarization reaches . This value is among the highest recorded (Han et al. 1998), certainly the highest among pulsars classified as ‘conal doubles’. The right-handed circular polarization and increasing position angle swing follow the correlation between handedness and sense of position angle change found by Han et al. (1998) for cone-dominated pulsars. With no reversal of sign, the phase averaged circular polarization fraction is quite large at 23%.
4 Radio and Infrared Imaging
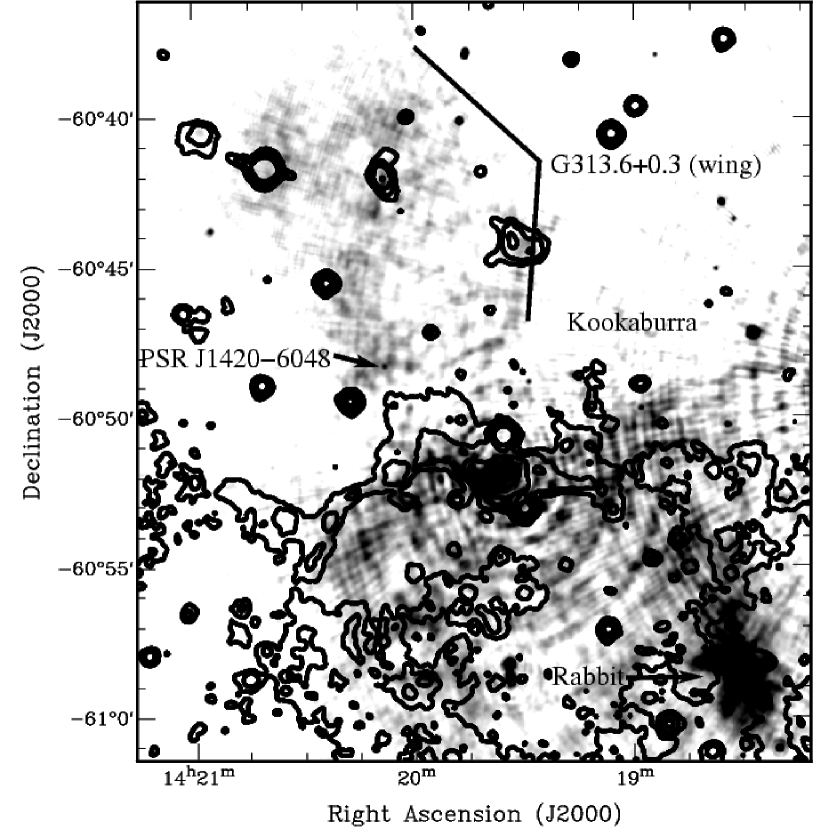
R99 presented results of radio continuum observations at 20 cm and 13 cm of the Kookaburra complex with the ATCA in three antenna configurations (1.5A, 0.375, and 0.75A configurations on 11 Jan., 28 Mar., and 22 Apr., respectively.) Three additional 20 cm continuum observations have since been performed (6D, 0.375, and 0.75C configurations on 20 Aug. 1999, 13 Jan. 2001, and 03 Mar. 2001). All these data were reduced and analysed with the Miriad software package (Sault & Killeen, 1998). A high resolution ( beam, 1375 MHz mean frequency) image was produced by combining all of the 20 cm data. Figure 4 shows the upper wing of the Kookaburra which we name G313.6+0.3 (K2 of R99). The pulsar is clearly seen as a point source near the southeast corner at R.A.(J2000)=14h 20m 8.23(6)s, Dec.(J2000)= , consistent with the timing position of PSR J14206048 (D’Amico et al., 2001). Stokes V parameter imaging finds a circular polarization fraction consistent with the time averaged value from the Parkes data. Using the dual-frequency 1998 data and only the longest ( km) baselines to resolve out the continuum flux, we obtain pulse average fluxes of mJy (20cm) and mJy (13cm) for a net spectral index .
Whiteoak & Green (1996) have used a low ratio of infrared to radio flux as an indicator of non-thermal emission in order to identify supernova remnant candidates. We have obtained IRAS Hi-res m and MSX m images from the NASA/IPAC Infrared Science Archive, and compared them to the radio maps. The shell is clearly seen in infrared, but there is no excess emission associated with G313.6+0.3 (Figure 4 contours) in either image.
5 Discussion
Yadigaroglu & Romani (1997) noticed a plausible association between the ray source and a complex of young star forming regions and SNR at a distance kpc. However, the pulsar dispersion measure (DM=360 pc , D’Amico et al. 2001) indicates a much larger distance kpc (Taylor & Cordes, 1993). The measured X-ray absorption of is consistent with the total Galactic towards that direction estimated from the FTOOLS tool derived from the HI map by Dickey & Lockman (1990). However, the prevalence of HII regions and dense clouds in this direction may mean the DM and are dominated by local sources in the Carina arm, implying a closer distance.
We can compare the X-ray and radio fluxes of our sources with other PSR/PWN. Saito (1997) fits an empirical relation for pulsed ASCA fluxes of erg/s, where is the spin-down power in units of is erg/s. This matches our observed pulsed flux at kpc.
The radio flux can also be compared to known PWN. R99 suggested that the K3 site, a mJy enhancement above the general flux in G313.6+0.3, was the radio counterpart to AX J1420.1-6049. Assuming a typical radio PWN spectral index , Gaensler et al. (2000) note the fraction of the spin-down energy which goes into radio emission is related to the 20 cm flux density by mJy. This suggests an efficiency at a distance of 8 kpc which is rather low compared to most other detected radio PWN (Frail & Scharringhausen, 1997; Gaensler et al., 2000), and would be even lower if the true distance is closer. However, the entire wing has a flux of Jy, the nature of which is uncertain. It is possible that a substantial fraction of the flux is due to the pulsar wind. A PWN flux of mJy would make for a fairly typical value of at 8 kpc, and reasonable values at closer distances. The implied size of the nebula at 8 kpc, pc, would then be unusually large.
The morphology of G313.6+0.3 is curious, being a rectangular plateau of radio emission with a question mark shaped enhancement starting at the pulsar and reaching up to nearly the top, reminiscent of a trailing bow-shock. The lack of IR emission, along with the apparent excess of polarized flux seen by R99 in portions of the wing and their estimate of for the spectral index, suggest the entire wing may be a supernova remnant. However, the large scatter in the T-T plot of R99 makes their spectral index value problematic. The expanded data set confirms the presence of linear polarizaton near the top of the enhancement, but seems to suggest that G313.6+0.3 has a mixture of thermal and non-thermal spectral components.
Given the rarity of such high pulsars, it is natural to assume a connection with GeV J14176100/3EG J14206038. The average MeV flux for this source is . Models of -ray pulse emission (e.g. Romani 1996) allow one to predict the typical -ray flux for pulsar spin parameters and the magnetic inclination angle . For PSR J14206048 (yr, surface magnetic field G), an assumed 1 steradian beam, and an efficiency of (somewhat less than Vela) the observed MeV flux is expected for if the distance were as close as 2 kpc. At a distance of 8 kpc, the inferred efficiency would need to be significantly higher if the ray emission is 100% pulsed. If is truely less than , the expected -ray efficiency is quite small and in an outer gap picture one would not expect the -ray beam to cross the line of sight for small . In this case the -ray emission could have an unpulsed, pulsar wind origin.
It is important to note that the -ray flux appears variable. A significant fraction of the emission may therefore be associated with a pulsar wind shock, where instabilities might produce luminosity fluctuations on month time scales. Similar variability is seen in other unidentified EGRET sources containing PWN (Roberts, Gaensler, & Romani, 2001). A second pulsar in the nearby Rabbit PWN candidate, unseen in the radio, might also contribute to the ray flux.
References
- Case & Bhattacharya (1999) Case, G. & Bhattacharya, D. 1999, ApJ, 521, 246
- Crawford, Manchester, & Kaspi (2001) Crawford, F., Manchester, R. N., & Kaspi, V. M. 2001, astro-ph/0106544, AJin press.
- D’Amico et al. (2001) D’Amico, N. et al. 2001, ApJ, 552, L45
- de Jager (1994) de Jager, O. C. 1994, ApJ, 436, 239
- Dickey & Lockman (1990) Dickey, J. M. & Lockman, F. J. 1990, ARA&A28, 215
- Frail & Scharringhausen (1997) Frail, D. A. & Scharringhausen, B. R. 1997, ApJ, 480, 364
- Gaensler et al. (2000) Gaensler, B. M., Stappers, B. W., Frail, D. A., Moffett, D. A., Johnston, S., & Chatterjee, S. 2000, MNRAS, 318, 58
- Gotthelf et al. (2000) Gotthelf, E. V., Ueda, Y., Fujimoto, R., Kii, T., & Yamaoka, K. 2000, ApJ, 543, 417
- Green et al. (1999) Green, A. J., Cram, L. E., Large, M. I., & Ye, T., 1999, ApJS, 122, 207
- Halpern et al. (2001) Halpern, J. P., Camilo, F., Gotthelf, E. V., Helfand, D. J., Kramer, M., Lyne, A.G., Leighly, K. M., & Eracleous, M. 2001, ApJ, 552, L125
- Han et al. (1998) Han, J. L., Manchester, R. N., Xu, R. X., & Qiao, G. J. 1998, MNRAS, 300, 373
- Hirayama et al. (1996) Hirayama, M., Nagase, F., Gunji, S., Sekimoto, Y., & Saito, Y. 1996, ASCA News, Issue 4.
- Johnston & Romani (2002) Johnston S. & Romani R.W 2001, ApJ, in preparation
- Radhakrishnan & Cooke (1969) Radhakrishnan, V. & Cooke, D. J. 1969, Astrophys. Lett., 3, 225
- Roberts & Romani (1998) Roberts, M. S. E. & Romani, R. W. 1998, ApJ, 496, 827
- Roberts et al. (1999) Roberts, M. S. E., Romani, R. W., Johnston, S., & Green, A. J. 1999, ApJ, 515, 712 (R99)
- Roberts, Gaensler, & Romani (2001) Roberts, M. S. E., Gaensler, B. M., & Romani, R. W. 2001, in preparation.
- Roberts, Romani, & Kawai (2001) Roberts, M. S. E., Romani, R. W., & Kawai, N. 2001, ApJS, 133, 451
- Romani (1996) Romani, R.W. 1996, ApJ, 470, 469
- Saito (1997) Saito, Y. 1997, Ph.D. Thesis Univ. of Tokyo
- Sault & Killeen (1998) Sault, R.J. & Killeen, N. E. B. 1998, The Miriad User’s Guide (Sydney: Australia Telescope National Facility)
- Taylor & Cordes (1993) Taylor, J. H., & Cordes, J. M. 1993, ApJS, 88, 529
- Whiteoak, Cram, & Large (1994) Whiteoak, J. B. Z., Cram, L. E., & Large, M. I. 1994, MNRAS, 269, 294
- Whiteoak & Green (1996) Whiteoak, J.B.Z. & Green, A.J. 1996, A&AS, 118, 329
- Yadigaroglu & Romani (1997) Yadigaroglu, I.-A. & Romani, R.W. 1997, ApJ, 476, 347