The SCUBA Bright Quasar Survey (SBQS): 850micron observations of the z4 sample
Abstract
We present initial results of a new, systematic search for massive star-formation in the host galaxies of the most luminous and probably most massive z4 radio-quiet quasars (; ). The survey, undertaken at using SCUBA at the James Clerk Maxwell Telescope (JCMT), has a target sensitivity limit of 10mJy, set to identify sources suitable for detailed follow-up e.g. continuum mapping and molecular line diagnostics. A total of 38z4 radio-quiet quasars have been observed at 850, of which 8were detected (3) with mJy (submillimetre-loud). The new detections almost triple the number of optically selected, submillimetre-loud z4 radio-quiet quasars known to date. We include a detailed description of how our quasar sample is defined in terms of radio and optical properties. As a by-product of our selection procedure we have identified 17 radio-loud quasars with z4.
There is no strong evidence for trends in either detectability or 850 flux with absolute magnitude, . We find that the weighted mean flux of the undetected sources is mJy, consistent with an earlier estimate of mJy based on more sensitive observations of a sample z4 radio-quiet quasars (McMahon et al.,1999). This corresponds to an inferred starformation rate of 1000, similar to Arp220. The typical starformation timescale for the submillimetre-bright sources is , 10 times longer than the typical accretion-driven e-folding timescale of years. Our 850 detection of the quasar PSS J10484407 when analysed in conjunction with 1.2mm single-dish and interferometric observations suggests that this source is resolved on angular scales of 1-2″(6-12 kpc). In addition, we present a new optical spectrum of this source, identifying it as a broad absorption line (BAL) quasar. The new redshift is outside that covered in a recent CO line search by Guilloteau et al., (1999), highlighting the need for accurate redshifts for the obervation and interpretation of high-redshift line studies.
keywords:
high-redshift star-formation ; radio-quiet quasars; quasar host galaxies1 Introduction
It is becoming increasingly clear that star-formation with its complementary photometric and spectroscopic signatures provides observers with a range of probes with which to study formation and evolution of galaxies in the early Universe. Particularly important to such studies are the millimetre-/submillimetre-/far-infrared- wavebands, a wavelength range in which clear fingerprints of both warm dust, heated by UV starlight from massive young stars, as well as atomic and molecular line emission, excited in regions of on-going starformation, can be seen. Recent work by Wright & Reese [2000] has further illustrated the importance of this waveband, demonstrating that roughly half the radiation produced by starlight in galaxies is absorbed by dust and reradiated in the far-infrared/submillimetre-waveband. Likewise, COBE observations have shown that the cosmological starformation rates inferred from UV- and optical studies (eg. Madau et al., (1998)) are more than a factor of two lower than those required to produce the observed far-infrared background, suggesting that there exists a population of star-forming galaxies that are hidden at optical wavelengths.
How can one use the (sub)millimetre-waveband to study starformation, both qualitatively and quantitatively, in the high-redshift universe? Photometric measurements of the (sub)millimetre-wave emission constrain the rest-frame spectral energy distribution – with more than one (sub)millimetre flux it is possible to evaluate a (sub)millimetre spectral index, thus confirming or refuting a thermal origin of the emission (eg. Hughes et al.[1993], Isaak et al.[1994]). With sufficient data, one can also determine a best-fit dust temperature, from which a bolometric (sub)millimetre-/far-infrared luminosity can be derived. Establishing the original energy source responsible for this reprocessed emission is considerably more difficult (eg. Sanders et al., [1989]), as the continuum spectral signatures of dust-obscured AGN and massive starbursts are very similar, indeed, with current telescopes indistinguishable at (sub)millimetre-wavelengths. If one assumes that some fraction of the (sub)millimetre/far-infrared luminosity arises from reprocessed UV-light from massive stars, then it is possible to infer starformation rates also. The presence and detection of the molecular gas tracer CO, found ubiquitously in nearby starburst galaxies, points to future starformation potential. In addition spectral line measurements provide important kinematic and dynamic information. Whilst thermal emission from dust out to high redshift can now be detected with relative ease due to the new generation of sensitive multi-pixel millimetre [1998] and submillimetre-wave arrays [1999], detecting CO is more difficult, requiring a very accurate measure of the source redshift because of the limited bandwidth (), and thus small fractional bandwidth at 100-200 GHz (), of the current generation of millimetre-wave receivers.
2 Survey design
2.1 Choice of targets
Recent attempts to study starformation in the high redshift Universe have focused on identifying target objects in two quite distinct ways. The first of these – deep, unbiased surveys of blank sky – only recently became possible with the introduction of sensitive, multi-pixel (sub)millimetre-wave bolometer arrays. Surveys undertaken using SCUBA (Submillimetre Continuum Bolometer Array [1999]) at the James Clerk Maxwell Telescope (eg. Hughes et al.[1996], Barger et al.[1996], Smail et al.[1997], Eales et al.[1999]) have been particularly successful, identifying some tens of submillimetre-selected sources with fluxes mJy. Classifying these sources, in particular assigning redshifts, is complicated by (i) the limited accuracy with which one can determine the source positions using a single-dish telescope (ii) the large number of potential, though very faint, optical counterparts revealed in deep observations of the submillimetre-wave source fields. As a result it has been possible to begin to derive the starformation properties of only handful of submillimetre-selected sources (eg. Frayer et al.[1998, 2000]).
In contrast, objects with known redshift provide a very convenient starting point from which to base searches for and studies of star-formation at high-redshift. The first submillimetre-wave observations of high redshift objects were made in the early 1990s [1992, 1992]. Following on from the successful detection both of the (sub)millimetre continuum (by Clements et al., [1992]) and CO emission (by Brown & VandenBout [1991] and subsequently Solomon, Radford and Downes [1992]) from the ultra-luminous infrared galaxy IRAS F10214+4724 at , (sub)millimetre studies of the continuum and CO line emission at high redshift of a small sample of radio-quiet quasars taken from the Cambridge APM BR/BRI QSO survey [1991, 1996, 2001], were made. At the time, these quasars were amongst the most distant known. With the combination of the measured with UKT14 [1990] on the JCMT [1994] and the fluxes measured at IRAM-30m [1994], it was possible to show that the (sub)millimetre continuum spectral indices were consistent with thermal emission. The (sub)millimetre emission thus indicates the presence of massive quantities of warm dust (K) at redshifts of , synthesized, and possibly heated, by bursts of star-formation in the host galaxies. Large quantities of molecular gas, as traced by CO (eg. Ohta et al.[1996], Omont et al.[1996a], Guilloteau et al. [1999]), were also detected in the host galaxies of a handful of quasars at . The detected gas masses are comparable to the total dynamical mass of the galaxy, a situation seen in galaxies undergoing their first bouts of star-formation (eg. Downes & Solomon [1998]).
2.2 Survey definition
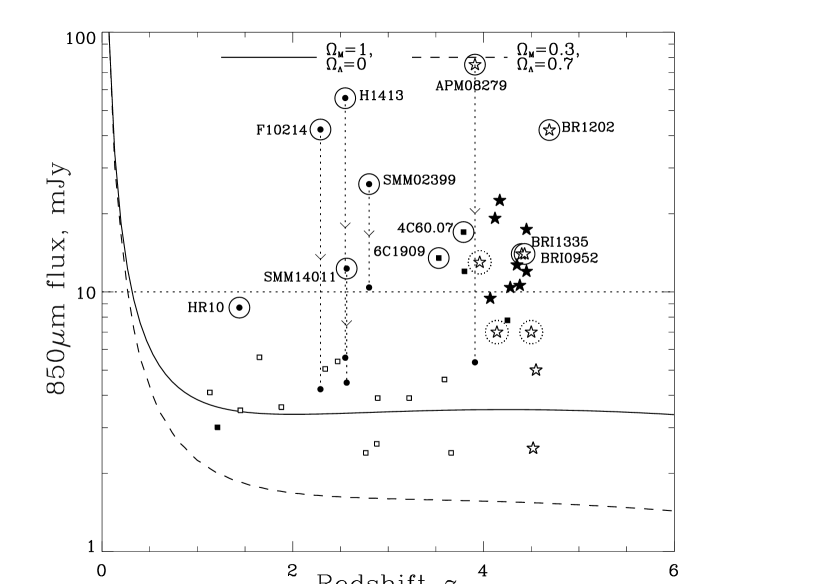
The number of objects from which both dust and CO emission have been detected is small, and so it is currently not possible to differentiate between observed/derived properties that are representative of objects at high redshift, and those that are extreme. An efficient way by which to increase the number of massive star-forming galaxies that can be readily studied needs to be identified. Shown in Figure 1 is a plot of the observed flux vs. redshift for a selection of high-redshift objects with accurately determined redshifts. Looking at : each source from which CO emission has been detected at greater than 5 (see Guilloteau et al., 1999 and references therein) has 10mJy, and conversely CO emission has been detected from 4 of the 5 objects with 10mJy 111CO has not detected in BR B11171329, which has mJy, Buffey et al., in prep.). This suggests an observationally imposed cutoff for successful CO detections of mJy. If we assume that by (0.9(1.2) after recombination, using an Einstein De Sitter cosmology, with and a cosmology, , , respectively) at least one massive burst of star-formation has already taken place, producing dust, then it is clear that it is more efficient with the current generation of radio telescopes to search first for the continuum dust emission from an object, following up secure detections with searches for CO.

A detection of a source with mJy takes approximately 25 minutes (excluding pointing and calibration overheads) using SCUBA/JCMT under observing conditions for which the sky transparency is c. 65%. Such conditions occur of the time (Figure 2) and thus a survey for submillimetre-loud object at high redshift can slot well into periods during which the sky transmission is not high enough to undertake the high-priority projects requiring the highest possible sky transmission. Indeed, under the very best observing conditions, when the zenith transparency at can be as high as 90% , the required sensitivity can be reached in an elapsed time of around 12 minutes. Such observations become an inefficient use of telescope time since they become dominated by slew time and pointing checks. In contrast, the detection of associated molecular gas for a mJy source would currently take some tens of hours using the PdB Interferometer and the Owens Valley Millimeter Interferometer 222If we assume that the submillimetre flux is thermal in origin, then with assumptions about the physical properties of the dust: , a dust spectral index of (see Priddey & McMahon [2001] for a “fiducial” quasar), a power-law dust emission given by Eq. 5, we derive a dust-mass estimate of around for mJy. Assuming a “typical” gas-to-dust ratio of 500, and conversion factor of , the equivalent gas mass that one might expect is few xdetectable at millimetre wavelengths using either the Plateau de Bure interferometer or the Owens Valley Radio Observatory Interferometer in some 10s of hours.
Samples of statistically significant size over a wide range of redshifts are crucial not only to studies of starformation and AGN activity at different epochs, but also to the determination of the role of starformation activity and black-hole accretion in the evolution of the Universe.
In this paper we report on the first results of an program to search for massive star-bursts in the host galaxies of the most optically bright radio-quiet quasars at using SCUBA at the JCMT. The aim of the survey is to identify a sample of 10 submillimetre-bright sources, from which it should in principle be possible to detect molecular gas emission using the current generation of millimetre interferometers. Based on extrapolations to of observations of radio-quiet quasars at by Omont et al. [1996b], we might expect to detect submillimetre-bright sources per hour (mJy) under modest submillimetre-observing conditions (sky transparency of c. 65% at ). We note that this detection rate is based on the simplifying assumption that the sample of Omont et al.[1996b] has the same distribution of source properties as any sample that we might define for the purposes of these observations. Such newly identified submillimetre-bright sources, together with the 4 well-studied objects from which CO has already been detected, and those for which upper limits to a gas mass have been obtained, will provide a sample of statistically significant size (), with which it will be possible to begin to draw conclusions about massive star-formation and its role in the high redshift universe.
We present here the interim results of our survey for a subset of 38 sources and discuss the implications of these current and future observations on studies of star-formation at high-redshift. In a companion paper, Omont et al. [2001] present 1.2mm observations of the same parent sample of z4 quasars. In a future paper(Priddey et al., in prep.) we will present an analysis of the combined sample of more than 100 z4 quasars, including observations by others of different samples , which have now been observed at either or 1.2mm,
We have adopted an Einstein de Sitter cosmology of , and, where useful, include a comparison with parameters derived using a -cosmology with , ; .
3 Sample definition
3.1 Optical properties
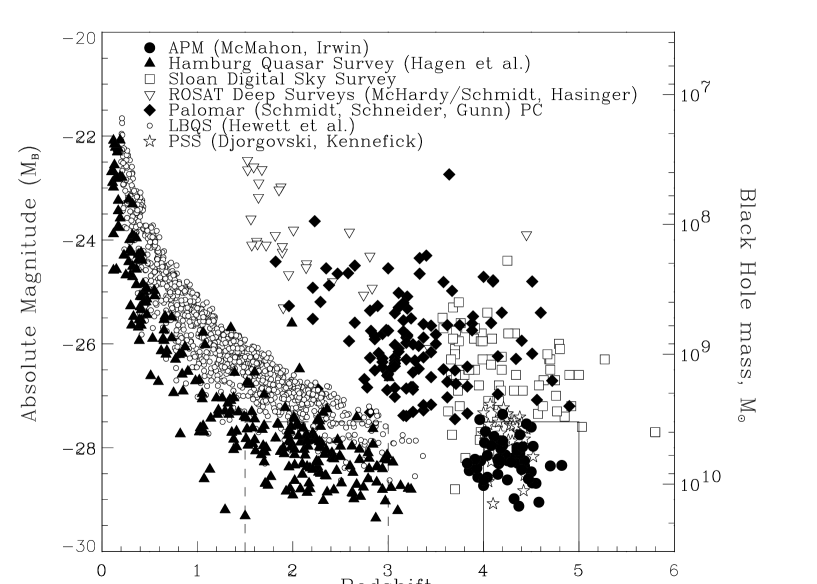
The parent observational sample has been selected to include the most luminous (rest-frame UV) radio-quiet quasars known as of January, 2000. The quasar sample was primarily drawn from the APM multicolour photographic surveys based on APM scans of UKST plates by Irwin, McMahon & Hazard(1991), Storrie-Lombardi et al.(1996, 2001) and the Caltech DPOSS based on STSCI scans of POSS-II plates by Kennifick et al.(1995). The first step in the sample definition was to calculate the absolute magnitude in a consistent manner for all (200) known z4 quasars in order to select a sample on the basis of their rest-frame absolute B band magnitudes (see Figure 3).
Absolute band magnitudes () were evaluated using observed band magnitudes for all the quasars, assuming a spectral index and using the relationship
| (1) |
where is the observed -band() magnitude and is the distance modulus, evaluated at the source redshift. band magnitudes were determined from APM scans of UKST (5900–6900Å) or of POSS-1 (6200–6800Å) plates from APMCAT (www.ast.cam.ac.uk/apmcat; McMahon & Irwin(1992)). Errors on these magnitudes are estimated to be . At , the band starts to sample the rest-frame spectrum near the prominent Lyman- emission line; and at higher redshifts, the band suffers from the strong intergalactic absorption shortwards of Lyman-. To compensate for both of these effects, a redshift- and filter-dependent correction factor () is invoked. Initially, for the purposes of sample selection, we adopted the empirical correction of Kennefick, Djorgovski & Meylan (1996). However, for the subsequent analysis, we derived our own correction, based on the mean LBQS quasar spectrum [1991], combined with the model of the hydrogen opacity of the intergalactic medium of Madau [1995], to obtain an average correction for each filter as a function of redshift. The correction was compared with empirical values derived from all quasars for which we possess accurately flux-calibrated spectra (see Storrie-Lombardi et al., 1996, and Peroux et al., 2001), and is found to follow the trend of the data well. The scatter superimposed on this trend is large, however, leading to an overall uncertainty in the magnitude . This scatter reflects not only the idiosyncratic variations in the effects of emission and absorption features, but also an intrinsic dispersion in the slope of the quasar continuum. For some of the quasars in the sample, a more direct measure of the continuum luminosity is available either through optical spectroscopy or through photometry in the band, which, at , samples the rest-frame band directly. However, for consistency and for the purposes of comparison, we use the uniformly available magnitudes to derive a homogeneous measure of luminosity. Issues pertaining to the derivation of accurate source magnitudes will be addressed more completely in a following paper.
| Quasar name | RA (J2000) | Dec (J2000) | 333Separation between optical and nearest radio source positions | 444Logarithm of the probability that the optically selected quasar has been falsely associated with a radio source from the NVSS catalogue, separated by distance | 555Extrapolated contribution by synchrotron emission to any observed 850 flux, based on a spectral index, , of 0.7, | 666[] = | 777Ratio of radio (1.4 GHz) to optical (rest-frame B-band) luminosities | |||
| ″ | (false) | mJy | mJy | |||||||
| PSS J0121+0347A | 01 21 26.1 | +03 47 07 | 4.13 | 1.7 | 4.5 | 78.6 | 1.65 | 27.5 | 34.69 | 2.97 |
| PSS J0211+1107 | 02 11 20.0 | +11 07 17 | 3.99 | 0.5 | 5.5 | 44.1 | 0.93 | 27.7 | 34.41 | 2.61 |
| PSS J04390207 | 04 39 23.2 | 02 07 02 | 4.40 | 0.5 | 5.5 | 43.8 | 0.92 | 27.5 | 34.49 | 2.77 |
| PSS J2256+3230 | 22 56 10.4 | +32 30 19 | 4.04 | 2.41 | 4.1 | 14.7 | 0.31 | 26.0 | 33.95 | 2.83 |
| BRI B01510025A | 01 53 39.6 | 00 11 05 | 4.20 | 7.3 | 3.2 | 3.0 | 0.07 | 27.5 | 33.28 | 1.56 |
| BR J02341806 | 02 34 55.1 | 18 06 09 | 4.30 | 0.7 | 5.2 | 35.8 | 0.75 | 27.5 | 34.38 | 2.66 |
| BR J03242918 | 03 24 44.3 | 29 18 21 | 4.62 | 0.6 | 5.3 | 236.8 | 5.00 | 28.8 | 35.26 | 3.02 |
| BR J03553811 | 03 55 04.9 | 38 11 42 | 4.58 | 13.4 | 2.6 | 2.4 | 0.05 | 29.4 | 33.26 | 0.78 |
| BR J05233345 | 05 25 06.2 | 33 43 06 | 4.40 | 1.0 | 4.9 | 188.7 | 3.96 | 28.1 | 35.12 | 3.16 |
| BR J10530016 | 10 53 20.4 | 00 16 49 | 4.29 | 2.6 | 4.1 | 9.7 | 0.2 | 27.0 | 33.81 | 2.29 |
| BR J13051420 | 13 05 25.2 | 14 20 42 | 4.04 | 0.96 | 4.9 | 20.6 | 0.43 | 28.0 | 34.09 | 2.17 |
| SDSSp J0131+0052B | 01 31 08.2 | +00 52 48 | 4.19 | 3.76 | 3.8 | 4.2 | 0.09 | 25.8 | 33.43 | 2.39 |
| SDSSp J02100018B | 02 10 43.2 | 00 18 18 | 4.77 | 3.24 | 3.9 | 11.5 | 0.24 | 26.8 | 33.97 | 2.53 |
| SDSSp J0300+0032B | 03 00 25.2 | +00 32 24 | 4.19 | 7.80 | 3.1 | 7.1 | 0.15 | 26.0 | 33.70 | 2.58 |
| SDSSp J12350003C | 12 35 03.0 | 00 03 31.8 | 4.69 | 0.48 | 5.5 | 19.5 | 0.41 | 26.3 | 34.19 | 2.95 |
| PC J0027+0525A | 00 29 49.97 | +05 42 04.4 | 4.10 | 8.47 | 3.0 | 4.8 | 0.10 | 24.8 | 33.47 | 2.83 |
| PC J2331+0216A | 23 34 32.0 | +02 33 22 | 4.09 | 4.92 | 3.5 | 2.7 | 0.06 | 27.3 | 33.22 | 1.58 |
For completeness all quasars in our parent sample for which potential radio counterparts were found are listed in the table. Those marked with A and B have already been found by Stern et al., [2000] and Fan et al., [2001] to have NVSS counterparts, whilst the source labelled C has a radio-counterpart [2000] as found in the FIRST survey [, 1995]
Objects already observed to a sensitivity equivalent or better than that of the survey as parts of other (sub)millimetre programs were excluded from the target list (eg. the 5 quasars observed by McMahon etal, 1999; BR B00191522, PSS J01343307, PSS J07474434, BR B16000729, BR B22370607), as were sources with transit elevations of less than 60 degrees. An exception to this was PSS J10484407, previously observed and detected at mm at the IRAM 30-m (Maoli et al., in prep), but not confirmed with 1.35mm observations at the Plateau de Bure interferometer [1999].
3.2 Radio properties
The final source selection criterion was that of radio flux. We have used the NRAO VLA Survey Survey(NVSS) to measure or place upper limits on the radio emission from all z4 quasars that were potentially in our sample. The NVSS survey [1998] is a sensitive radio survey that was carried out with the VLA at 20cm in B-array, with a 5 sensitivity of mJy/beam. To determine which of the optically selected quasars are radio-loud, we cross-correlated the optical positions of our parent sample with sources in the NVSS catalogue. To assess the probability of a radio source being matched to one of the optically selected quasars by chance, the background source density was determined by counting the density of radio sources in the annulus with radius 100″to 1000″, resulting in a value of 50 deg-2. The rms positional error of the NVSS catalogue is given as 7″and thus, if one assumes that any radio source within 21″is a potential match, one expects 0.005 chance associations per source, or a probability of 1 in 200 of incorrectly attributing radio emission to an optically selected quasar. Even if this radio emission were not to be from the quasar itself, a fraction of the emission would still be picked up by JCMT/IRAM main and error beams.
Listed in Table 1 are all optically-selected z 4 quasars for which we find an NVSS source within a 30″radius – a total of 17 objects – along with their derived parameters. A detailed discussion of the radio properties of the sample is beyond the scope of this paper and will be presented elsewhere. All sources with mJy were excluded from the final SBQS target list. Based on a flux extrapolation of , and a canonical spectral index of , we therefore expect the maximum synchrotron contamination at to be less than mJy. Thus, it is reasonable to assume that the emission from any source that is detected at is likely to be thermal in origin.
Our final target list comprised 76 sources with , augmented by 22 sources with which were included to improve sky coverage: 15 quasars were taken from the APM B/R and B/R/I survey (BR and BRI sources : [1991, 1996, 2001]), 70 from the Palomar Sky Survey (PSS sources: [2000]), 2 from the Palomar Survey (PC sources : [1991, 1991]), 1 from the VLA (VLA source: [2000]) and 9 from the Sloan Digital Sky Survey (SDSSp sources: Fan et al.[1999, 2000]).
4 Observations and Data Reduction
4.1 Observations
Observations were made using the wide-band filter on SCUBA, during periods when the zenith sky transparency was (, referred to as grade 3 weather in JCMT parlance). Sources were observed by the “displaced observer” with priority set by source availability and luminosity. The standard photometry observing mode was used – a 9-position jiggle superposed onto a 7 Hz/60″chop throw of the secondary mirror in the azimuthal direction, implemented to remove sky emission offsets. Gradients in sky emission were taken out by “nodding” the telescope – a physical movement of the telescope to the off-position every 18s. A typical observation consisted of sets of c. 30–50 18-second integrations, with the total number of integrations chosen to achieve a sensitivity of mJy. Pointing was checked regularly, and found to be accurate to better than a few arc-seconds. Astronomical seeing was monitored using the 5GHz CfA phase interferometer – the phase monitor was not in continual use however, when working, the data suggested that the seeing was not worse than 3″888 We note that in the worst case, the combined pointing and seeing errors of 3″would result in a loss of point-source coupling of 40%, assuming a Gaussian beam profile with a FWHM of 14″. Sky transparency was monitored using regular sky-dips and data taken by the 225 GHz Caltech Submillimetre-Observatory (CSO) tau-meter. Flux calibration was achieved using the primary calibrators Mars and Uranus, as well as the secondary calibrators HLTau, IRC10216 999IRC10216 was adopted as calibrator on one occasion only, due to its periodic variability. When used as a calibrator, the output flux of IRC10216 was at a maximum, OH231 and 16293 101010 See the JCMT web-page for the most recent calibrator fluxes. Absolute fluxes for the planets were derived using the Starlink package, FLUXES. The average time to complete the observation of a single source, including pointing, calibration, sky-dip and slewing overheads, was over 1 hour. This is quite a bit longer than would be the case for a contiguous set of observations, reflecting the start/stop nature of a back-up program.
Here, we discuss observations of a subset of the target list: sources observed during the period February – July, 2000.
4.2 Data reduction
Data were reduced using the Starlink SURF reduction package [2000],
using the automated ORACDR pipeline [2000] as well as a
basic SURF-based pipeline written in-house prior to the release of ORACDR.
Two different schemes were implemented to determine an appropriate
measure of the background sky-noise, the first using the mean of the
inner ring of six pixels surrounding the central on-source bolometer
to define the temporal sky variations, and the second the median of
all bolometers. In general, only small differences in the
final fluxes and rms noise determinations were seen between the two
methods for observations in which detections were made. There were,
however, more significant differences in rms values determined
for non-detections. In particular, the sky-noise correction
derived from the inner-ring mean resulted in a non-zero offset in the
distribution of the signal/noise ratios for all off-source bolometers,
indicating incomplete sky-removal. This was in contrast to the median-derived
sky correction which we chose to adopt in the final analysis.
All quasar data were clipped at the level prior
to applying the sky-subtraction in order to eliminate transient spikes.
Corrections for atmospheric extinction were made using sky opacities
derived from 850 sky-dips.
Individual sets of integrations were gain-calibrated and then
concatenated, with a despiking applied to remove
outlier data points.

| 111111BR/BRI source positions taken from the APM catalogue; PSS source parameters have been taken from the Palomar Sky Survey ([2000]) SDSSp source positions have been taken from the Sloan Digital Sky Survey ([1999, 2000]) | 121212Palomar Sky Survey redshifts have been taken from Djorgovski [2000], with the exception of sources marked , where redshifts have been taken from Peroux et al. and Storrie-Lombardi et al. | RA | Dec. | 131313 magnitudes determined from APM scans of the UKST (5900–6900Å) or POSS-1 (6200–6800Å) plates. Errors are estimated to be | 141414See text for an explanation of the method used to evaluate the absolute source magnitudes | obs. | integ. 151515Integration times have been calculated based on no: integrations x 18s/integration x 1.5, where both chopping and a 50% observational SCUBA overhead has been allowed for, This does not include any overhead for calibration or pointing. | Flux 161616Where a detection was not been achieved, the tabulated flux is given as the on-source signal only | rms | S/N |
| (J2000) | (J2000) | date | time (s) | (mJy) | (mJy) | |||||
| PSS J0452+0355 | 4.38 | 04 52 51.5 | +03 55 57 | 19.1 | 27.6 | 7Feb00 | 2640 | 10.6 | 2.1 | 5.0 |
| PSS J0808+5215 | 4.45 | 08 08 49.4 | +52 15 15 | 18.3 | 28.7 | 4Feb00 | 2640 | 17.4 | 2.8 | 6.2 |
| PSS J1048+4407 171717 The position reported here is that taken from the Djorgovski web page. A check of the position using the APM catalogue after the JCMT SCUBA observations had been made revealed that the published position is out by 2″. The correct position is: (J2000) 10 48 46.64 +44 07 10.9 | 4.38* | 10 48 46.6 | +44 07 13 | 19.6 | 27.4 | 12Feb00/3Jul00 | 3940 | 12.0 | 2.2 | 5.3 |
| PSS J1057+4555 | 4.12 | 10 57 56.3 | +45 55 53 | 16.5 | 29.4 | 11Feb00 | 2640 | 19.2 | 2.8 | 6.9 |
| PSS J1248+3110 | 4.35 | 12 48 20.2 | +31 10 44 | 18.9 | 27.6 | 22Apr00 | 1340 | 12.7 | 3.4 | 3.8 |
| PSS J1418+4449 | 4.28 | 14 18 31.7 | +44 49 38 | 17.6 | 28.6 | 23Apr/3Jul00 | 4200 | 10.4 | 2.3 | 4.5 |
| PSS J1646+5514 181818The flux reported is the weighted sum of 4 sets of integrations that differed considerably in statistical significance, ranging from and better detections to a near-zero on-source flux. | 4.04* | 16 46 56.5 | +55 14 46 | 17.1 | 28.7 | 13/14.02/7Feb00 | 5240 | 9.5 | 2.5 | 3.8 |
| PSS J2322+1944 | 4.17 | 23 22 07.2 | +19 44 23 | 17.7 | 28.1 | 27Jul00 | 1600 | 22.5 | 2.5 | 8.9 |
| PSS J0007+2417 | 4.05 | 00 07 38.7 | +24 17 24 | 18.3 | 27.6 | 13Jun00 | 1340 | 1.2 | 3.5 | 0.3 |
| PSS J0014+3032 | 4.47 | 00 14 43.0 | +30 32 03 | 18.7 | 28.1 | 30May00 | 1340 | 10.6 | 4.2 | 2.5 |
| PSS J0133+0400 | 4.15* | 01 33 40.3 | +04 00 59 | 18.3 | 27.6 | 13Jun00 | 1340 | 1.0 | 2.8 | 0.4 |
| BRB03000207 | 4.25 | 03 02 53.0 | 01 56 07 | 18.5 | 27.6 | 12Feb00 | 3940 | 1.7 | 2.8 | 0.6 |
| BRB03511034 | 4.35* | 03 53 46.9 | 10 25 19 | 18.6 | 27.8 | 12Feb00 | 2640 | 2.8 | 3.0 | 0.9 |
| BRB04011711 | 4.24 | 04 03 56.6 | 17 03 24 | 18.7 | 27.6 | 11Feb00 | 3940 | 2.6 | 3.4 | 0.8 |
| PSS J0852+5045 | 4.2 | 08 52 27.3 | +50 45 11 | 17.7 | 28.2 | 9/12Feb00 | 5240 | 1.8 | 2.2 | 0.8 |
| PSS J0926+3055 | 4.19 | 09 26 36.3 | +30 55 05 | 16.4 | 29.5 | 4/11Feb00 | 6540 | 0.8 | 1.9 | 0.4 |
| BRI B09450411 | 4.14 | 09 47 49.6 | 04 25 15 | 18.8 | 27.3 | 5Feb00 | 2640 | 2.1 | 2.2 | 1.0 |
| PSS J0957+3308 | 4.25 | 09 57 44.5 | +33 08 20 | 17.8 | 28.3 | 11Feb/7Mar00 | 5396 | 3.7 | 1.9 | 2.0 |
| BRI B1013+0035 | 4.40 | 10 15 49.0 | +00 20 19 | 18.8 | 27.9 | 12Feb00 | 2640 | 5.5 | 2.7 | 2.0 |
| PSS J1026+3828 | 4.18 | 10 26 56.7 | +38 28 45 | 18.1 | 27.8 | 12Feb00 | 2640 | 5.2 | 2.5 | 2.1 |
| PSS J1058+1245 | 4.33 | 10 58 58.4 | +12 45 55 | 17.6 | 28.8 | 12Feb00 | 2640 | 0.00 | 2.2 | 0.0 |
| BRI B1110+0106 | 3.92* | 11 12 46.3 | +00 49 58 | 18.3 | 27.1 | 5Apr00 | 1340 | 7.1 | 3.4 | 2.1 |
| SDSSp J1226+0059 | 4.25 | 12 26 00.7 | +00 59 24 | 18.9 | 27.0 | 14Feb00 | 2640 | 0.06 | 3.3 | 0.0 |
| BRB13021404 | 4.00* | 13 05 25.2 | 14 20 42 | 18.6 | 27.4 | 23Apr00 | 1600 | 1.0 | 3.2 | 0.3 |
| PSS J1315+2924 | 4.18 | 13 15 39.8 | +29 24 39 | 18.5 | 27.4 | 22Apr00 | 1340 | 4.1 | 3.3 | 1.3 |
| PSS J1326+0743 | 4.17 | 13 26 11.8 | +07 43 58 | 17.5 | 28.4 | 3Jul00 | 1340 | 0.3 | 3.9 | 0.1 |
| PSS J1347+4956 | 4.46 | 13 47 43.3 | +49 56 21 | 18.5 | 28.3 | 22Apr00 | 1470 | 8.5 | 3.9 | 2.2 |
| SDSSp J14130049 | 4.14 | 14 13 32.4 | 00 49 10 | 19.1 | 27.0 | 14Feb00 | 2640 | 1.0 | 3.2 | 0.3 |
| PSS J1432+3940 | 4.28 | 14 32 24.8 | +39 40 24 | 18.0 | 28.2 | 3Jul00 | 2640 | 1.4 | 3.3 | 0.4 |
| BRB1500+0824 | 3.94* | 15 02 45.4 | +08 13 06 | 19.3 | 26.3 | 14Feb00 | 3940 | 6.2 | 3.0 | 2.1 |
| PSS J2154+0335 | 4.36 | 21 54 06.7 | +03 35 39 | 19.0 | 27.5 | 5Apr00 | 1860 | 2.6 | 2.6 | 1.0 |
| PSS J2155+1358 | 4.26* | 21 55 02.2 | +13 58 26 | 18.0 | 28.1 | 5Apr00 | 1860 | 0.8 | 3.1 | 0.4 |
| PSS J2203+1824 | 4.38 | 22 03 43.4 | +18 28 13 | 18.0 | 28.7 | 30May00 | 1340 | 3.0 | 4.2 | 0.7 |
| BRB22121626 | 3.99* | 22 15 27.3 | 16 11 33 | 18.1 | 27.9 | 30May00 | 1340 | 7.9 | 4.5 | 1.7 |
| PSS J2238+2603 | 4.03 | 22 38 41.6 | +26 03 45 | 17.0 | 28.9 | 30May00 | 1340 | 2.2 | 3.9 | 0.6 |
| PSS J2241+1352 | 4.44* | 22 41 47.8 | +13 52 02 | 19.1 | 28.0 | 5Apr/30May00 | 2250 | 0.2 | 3.0 | 0.05 |
| PSS J2323+2758 | 4.18 | 23 23 40.9 | +27 58 00 | 18.6 | 27.3 | 30May00 | 1340 | 2.8 | 4.0 | 0.7 |
| PSS J2344+0342 | 4.24* | 23 44 03.2 | +03 42 26 | 18.2 | 28.1 | 30May00 | 1340 | 11.3 | 4.0 | 2.8 |
5 Results
Source positions, redshifts and derived absolute B-magnitudes () are tabulated in Table 2, along with dates of observation, observed flux densities, rms values and signal-to-noise ratios. Note that calibration errors of 20% have not been included in the error budget.
A total of 38quasars have been observed (see Table 2):
8sources were detected with mJy, at
statistical significances of better than . 30 sources were
observed but not detected: 19 sources
with mJy, 8 sources
with mJy and 3 sources
with mJy (see Table 2). Achieving the pre-requisite
survey sensitivity consistently proved to be difficult – the initial
mJy sensitivity threshold was frequently both bettered
(19 non-detections) and not reached (11 non-detections).
The size of the observed sample is large enough not only for a significant number of submillimetre-bright sources to have been newly identified, but also to define a sample with which to start to assess the detection rate as well as detectability as a function of redshift and absolute magnitude. Here we adopt a 12mJy cut-off (a limit which includes 90% of sources observed in our program, Figure 4), noting that there are possibly as many as 3 sources which may have mJy, but for which the observations obtained were not deep enough to obtain a detection. Sources were initially included in our target list based on an approximate mJy cutoff at – BR B1500+0824 and BR B1302-1404 were thus included in the JCMT sample in spite of having been observed at mm at IRAM-30m down to an equivalent mJy. We include these two sources in our statistical sample which includes all sources for which the observed sensitivity is mJy – a total of 35objects.
6 Discussion
6.1 Newly detected submillimetre-bright sources
To date, our survey has identified a total of 8submillimetre-bright sources (where here we include PSS J10484407) with fluxes between mJy. This equates to a detection rate, which is comparable to the rate of seen by Omont et al. [1996b] ,and based on 1.25 mm observations of a sample of radio-quiet, optically selected APM quasars with z4. We stress here that the comparison between the detection rates of the two different samples is valid ONLY if the underlying properties of the constituent sources are the same. We defer a more detailed analysis of this issue to another paper 191919To make the comparison between the two different samples, observed at two different wavelengths, we use the flux ratio of derived by Priddey & McMahon [2001] for z4 quasars. At this ratio is , and thus we can compare the sample here with sources observed to mJy at m by Omont et al.[1996b]. In evaluating our detection rate we have excluded BR B15000824 and BR B13021404 because of the common non-detection to the IRAM-30m sample. In each case, the measured fluxes are more than a factor of 100 in excess of what might be expected based on the NVSS radio limits. Thus, the single submillimetre flux measurements, combined with the a-priori radio limit of our parent sample, suggest strongly that we are detecting submillimetre emission from these sources that is thermal in origin.
How do the fluxes reported here compare with those measured for other z4 radio-quiet quasars? The brightest radio-quiet quasar z4 host galaxy observed both at submillimetre and millimetre wavelengths remains BR B1202-0725 (Isaak et al. [1994], McMahon et al.[1994], Buffey et al., in prep) – with an flux of almost greater than twice that of the brightest sources detected in this survey, PSS J08085215, PSS J10574555 and PSS J23221944. Arc-second resolution ( c. 1-2″) imaging with the Plateau de Bure interferometer (PdB) by Omont et al.[1996b] have shown BR B1202-0725 to be a composite source, made up of two comparable gas-rich and possibly interacting galaxies. If we assume that the flux distribution is similar to that of the 1.25mm flux, split equally between the two objects, then BR B12020725 is no longer such an exceptional object, and has a flux comparable to that of the brightest sources present here. With the further assumption that PSS J08085215, PSS J10574555 and PSS J23221944 are all single sources, there is a suggestion of a maximum observed flux of mJy. The origin of such a maximum is intriguing. A possibility is that the starformation is self-regulated, with the large number of supernovae events in the massive star-burst disrupting the local ISM and blocking star-formation. We are currently obtaining both deep radio observations with the VLA and millimetre observations with PdB, with which we will be able to establish the degree of extension of the sources.
We note that the sources we detect here are as bright, if not brighter than those detected in blank-sky and cluster-lensing surveys. Interestingly, the two brightest sources detected in the cluster lensing surveys [1998, 2000] have fluxes of just over , and are both AGN at . For comparison, the measured fluxes of the brightest and median source in the Canada-UK-Deep-Sky-Survey are mJy and mJy respectively (eg. [1999]). The 200-square arcminute survey “8mJy survey” (8mJy (Dunlop 2000, Scott et al., in prep.) has yielded 24 sources, detected at statistically significant levels, with brighter than mJy, and the brightest with a flux of mJy. We note here that others have also started similar surveys to our own at 1.25mm using the IRAM-30m [2001a], but leave a comparison between surveys to a companion paper.

6.2 PSS J10484407
In addition to identifying new submillimetre-bright sources, we detected PSS J10484407, a source for which observations at mm with IRAM-PdB and the IRAM-30m were in conflict.
6.2.1 Single-dish vs. interferometric observations
As reported by [1999], PSS J10484407 was not detected at 1.35mm using the PdB interferometer ( mJy) in the CD configuration, but was tentatively detected by Maoli et al (in prep.) 1.25mm at the IRAM-30m (mJy). Our result, mJy, is consistent, to within the error-bars, with the 30-m single-dish measurement if we assume a ratio of , as derived by Priddey & McMahon [2001]. Neither of the two single-dish measurements, however, are consistent with the interferometer observations. Pointing errors in the interferometer map and the effects of anomalous refraction would need to be much larger than realistically possible to explain the non-detection with the interferometer, given that at GHz the primary beam is ″. It is more likely that the host galaxy of PSS J10484407 is spatially extended on the scales greater than the synthesized beam of the interferometer ( 3″x 2″).
To resolve out a substantial fraction of the millimetre flux, the spatial extent of the emission does not need to be much greater than the size of the beam, depending more critically on the projected baselines/effective U-V coverage of the observations and the source extension relative to the position angle of the beam. At a redshift of , 1″equates to a linear size of c. 6kpc To resolve out emission over arc-second scales suggests that the star-burst activity, as traced by the millimetre emission, is taking place over the whole galaxy rather than confined to nuclear regions as observed in Arp220 [1998, 1999], Arp193 and Mrk273 [1998]. This is in contrast to BRI B09520115 and BR B13350417 where a comparison between the single-dish and interferometric observations suggests that in each case a significant fraction of the millimetre emission is unresolved, but similar to the case of BR11171329 and BR11440723, as discussed in Omont et al., [2001].
6.2.2 Updated redshift
Also reported in Guilloteau et al., [1999] is the non-detection of CO (5-4) line emission using the PdB interferometer. This is interesting in light of the detection presented here, as the source is one of two from five with a previously inferred mJy for which a search for CO emission failed. A reassessment of the source redshift based on a new optical spectrum taken at the WHT by Peroux et al. [2001] (Figure 5) reveals that the CO observations were centred at an erroneous redshift. Using the combination of the Ly, CIV and the SiIV+OIV emission lines, we derive a redshift of , in contrast to that derived from the Ly line only by Kennefick et al.[1995], , and the redshift at which a search for CO emission was made [1999]. The difference in redshift is significant – much greater than that covered by the interferometer correlators. Our average redshift may, however, be biased high as it contains the measurement based on the Lyman- line which is observed to be systematically higher than the other two emission lines(CIV, SiIV+OIV). It is possible that the Lyman- line profile is affected by absorption due to the NV(1240Å) line which would bias its peak redward. Using the CIV line alone, we derive a systemic redshift of , correcting for the systemic shift from rest for the line as derived by Tytler & Fan (1992).
Given the discrepancy between the observed and newly derived redshift we suggest that the failure to detect CO emission is due to incorrect redshift, rather than an anomalous gas-to-dust ratio. This serves as a note of caution – given the limited bandwidth of the current generation of millimetre and submillimetre telescopes, the non-detection of any spectral line emission should be considered both in an astronomical context and, as important, in terms of a possible error in redshift.
| Source name | SFR | ||||||||||
| mJy | |||||||||||
| (1) | (2) | (3) | (4) | (5) | (6) | (7) | (8) | (9) | (10) | (11) | (12) |
| PSS J0452+0355 | 4.38 | 27.6 | 0.9 | 3.6 | 80 | 7.3 | 10.6 | 0.9 | 1.2 | 1200 | 0.6 |
| PSS J0808+5215 | 4.45 | 28.7 | 2.5 | 10.0 | 220 | 20 | 17.4 | 1.5 | 2.0 | 2000 | 1.0 |
| PSS J1048+4407 | 4.38 | 27.4 | 0.8 | 3.0 | 70 | 6.0 | 12.0 | 1.1 | 1.3 | 1300 | 0.5 |
| PSS J1057+4555 | 4.12 | 29.4 | 2.8 | 19.0 | 420 | 38 | 19.2 | 1.8 | 2.3 | 2300 | 1.7 |
| PSS J1248+3110 | 4.35 | 27.6 | 0.9 | 3.6 | 80 | 7.3 | 12.7 | 1.1 | 1.4 | 1400 | 0.5 |
| PSS J1418+4449 | 4.28 | 28.6 | 2.3 | 9.1 | 200 | 18 | 10.4 | 0.9 | 1.2 | 1200 | 1.5 |
| PSS J1646+5514 | 4.35 | 28.7 | 2.5 | 10.0 | 220 | 20 | 9.45 | 0.8 | 1.1 | 1100 | 1.9 |
| PSS J2322+1944 | 4.17 | 28.1 | 1.4 | 5.8 | 130 | 12 | 22.5 | 2.0 | 2.6 | 2600 | 0.4 |
| median z4 SBQS 202020The quantities and parameters evaluated for the median quasar are based on the median observables, from which parameters are derived. | 4.35 | 28.4 | 1.8 | 7.4 | 165 | 15 | 12.4 | 1.1 | 1.4 | 1350 | 1.1 |
| 212121Median quasar properties evaluated as above, based on a cosmology, , , and . For comparison the ratio of the square of the luminositiy distance under the two cosmologies at is 1.38 | 4.35 | 28.7 | 2.5 | 10.2 | 230 | 21 | 12.4 | 1.5 | 2.0 | 1950 | 1.1 |
6.3 Inferred astrophysical properties
Shown in Table 2 are physical properties of the detected sources derived from the optical luminosities and submillimetre fluxes reported here. We have assumed that the measured submillimetre flux arises from thermal emission from warm dust, and that the dust is heated solely by the UV flux from massive star-formation. The former can be justified, at least in part, by the radio-selection criterion that we used to define the parent sample. In addition, we will be able to combine the fluxes measured here with mm fluxes that have been measured in a parallel mm MAMBO survey [2001] running at the IRAM-30m (Priddey et al., in prep.). The latter assumption is more difficult to justify, as it is possible that a fraction of the rest-frame UV absorbed by the dust comes from the central AGN. The size of the AGN contribution is difficult to estimate as it depends on the source geometry (eg. Sanders et al.[1989]), about which we have little knowledge. Observations of local, ultra-luminous infrared galaxies (ULIRGs, with ), arguably the most likely low-redshift counterparts of the quasar host galaxies, have been interpreted as being suggestive that between 70-80% of ULIRGS are powered predominantly by star-burst activity, with at least half the sources observed probably have simultaneous star-burst and AGN activity on the physical size scales of a few kpcs (eg. Genzel et al., [1998]). An additional unknown at this point is the extent of gravitational lensing and thus source magnification. The incidence of gravitational lensing amongst high luminosity quasars is around 1% for samples of bright quasars [1993]. Studies of previous samples have, however, a median redshift of only . At the probability of a quasar being lensed by a foreground galaxy is a factor of higher due to the larger optical depth to lensing [1984, 1992]. This qualitative argument is in rough agreement with the empirical result that only one of the 49 APM BRI quasars, the APM quasar BRI B09520115 with mJy (Buffey et al., in prep) is known to be gravitationally lensed. It therefore seems unlikely that a large number of the submillimetre-bright source detections reported here are lensed. High resolution optical imaging of the whole sample would be needed to confirm this. At present we have no evidence to support or refute the possibility of magnification, and thus assume that there is none.
6.3.1 Astrophysical properties inferred from the optical AGN luminosity
An advantage of targeting quasars for a study of high-redshift (sub)millimetre sources is that we are able to use the optical luminosity of the AGN to constrain the mass of the black hole powering the AGN, from which we can estimate the mass of the surrounding host galaxy. If we assume a bolometric correction from the band of [1994], and that the black hole is accreting at the Eddington rate, then there exists a simple relation between black hole mass, , and its bolometric luminosity, :
| (2) |
where is the Thomson scattering cross-section and the proton mass.
The accretion rate can be written in terms of the luminosity and an efficiency parameter , for which a conservative estimate is ([1984]):
| (3) |
While Equation 3 holds, the growth of black hole mass and luminosity is exponential, with an -folding time-scale . Studies in the local Universe [1998, 2000] have shown that there exists a linear relation between the mass of non-active black holes and the stellar mass of the surrounding galactic bulge at the current epoch. If we assume that there is some imprint of this relationship at early epochs (however, see Omont et al. [2001] and Priddey et al. (in prep)), then we can obtain a measure of the mass of the final (ie. ) quasar host galaxy (Column 7 of Table 3) using a value of from Gebhardt et al. [2000]. It is clearly possible that at , the ratio of the black hole to spheroid mass is different from the local value. For example Kauffmann & Haehnelt (2000) predict that the host masses will less massive by a factor of between 5-10 at as compared to . Work by Rix et al (1999) on the magnitudes of lensed host galaxies of lensed quasars also suggests that the masses of quasar hosts are low at high redshift however although this is based on the observed rest-frame B band magnitudes, these observations could be affected by dust obscuration, and hence the inferred masses may be underestimated. In the long term, one would hope that it will be possible to determine the dynamical masses of quasar hosts at high redshifts so that the issue can be studied more directly.
These estimates represent lower limits to the mass of the central engine, as we observe the quasars while they are still accreting. It seems unlikely for a number of reasons, however, that the masses grow much larger than this. Firstly, the inferred masses are large, comparable to the most massive non-active black holes () at the cores of nearby galactic bulges [2000]. Secondly, the accretion rates required to sustain these luminosities (Table 3, Column 6) are extreme— and encroaching upon (% of) the star-formation rates inferred from the far-infrared luminosity (Column 11). Thus, the gas supplies in the galaxy are being rapidly diminished, at a rate too high to sustain either processes for much longer than – indeed Priddey & McMahon determine a median gas consumption timescale of [2001]. Although we have no knowledge of the precise accretion history of the AGN, we can derive a time taken to assemble the inferred black masses of around if we assume that the accretion rate is Eddington-limited throughout the growth of the black hole and that the seeds from which the black holes form are (Haehnelt, Natarajan & Rees, 1998).
6.3.2 Astrophysical properties inferred from the submillimetre fluxes
Turning to the host galaxy properties derived from submillimetre flux observed at frequency , the dust mass given in Column 9 of Table 3 is determined using
| (4) |
where we assume that the emissivity is a power-law function of frequency, and we adopt the normalisation of Hildebrand (1983):
| (5) |
where is the value determined at m. For the dust temperature and emissivity index, we use K and , derived by Priddey & McMahon [2001] from a composite submillimetre spectrum of z4 quasars. The far-infrared luminosity is calculated by integrating under the thermal, grey-body spectral energy distribution,
| (6) |
where again we assume K, , is the Gamma-function and is the Riemann-Zeta function. If we assume that all the energy re-radiated by the dust originates from stars, then the far-infrared luminosity can be used to estimate the current star-formation rate:
| (7) |
The exact value of depends sensitively upon the star-formation history of the host galaxy, the stellar Initial Mass Function (IMF) and the fraction of starlight absorbed by the dust cloud. We adopt the simplifying assumptions that the starformation rate is constant and that the cloud-covering factor is unity. Then, for a Salpeter IMF with upper and lower mass cut-offs of and respectively, and is approximately constant for ages yr. The total time required to form the final stellar mass (Column 7) inferred from the black hole mass is given in Column 12 of Table 3, and is roughly . The starformation history derived from the chemical/dynamical model of elliptical galaxy evolution developed by Friaça & Terlevich [1998] has just such a form— a constant star formation rate lasting for around . Observational support for long periods of sustained high starformation rates is reported in Abraham et al. [1999] (see Figure 6). For an alternative interpretation, however, see Omont et al. [2001] who argue for shorter burst timescales.
We have two time-scales describing the fate of gas in the evolving host galaxy: a time-scale for the conversion of gas into stars, , or gas accretion onto a super-massive central black hole with an accretion time of the same order. This may be suggestive of a possible synchrony between formation of the AGN and its host galaxy, however we leave a more detailed and speculative discussion of the inferred quasar and host galaxy properties to a future paper.
Throughout, we have assumed that the dominant heating source is starformation in the quasar host galaxy. At present, however, it is not possible to determine conclusively whether this is indeed the case. If instead, we were to that assume the AGN contribution to the dust heating cannot be neglected, then (a) for a fixed dust temperature the inferred starformation rate would fall, with a corresponding increase in the formation time for the massive spheroid (b) a hotter dust component heated directly by the AGN would contribute significantly to the overall far-infrared luminosity, and thus inaddition, smaller dust masses as well as lower starformation rates and longer timescales would be inferred. Observations of samples, such as this SBQS sample, at shorter wavelengths using SIRTF will reveal any warmer dust component.


6.4 Optical/submillimetre correlations
With a sample of 38observed sources, it becomes meaningful to start to make both qualitative and quantitative assessments of the trends in the detection rates with source redshift and magnitude. Shown in Figures 6 and 7 are the cumulative magnitude and redshift distributions for the observed, detected and non-detected subsamples. To assess quantitatively the degree of similarity between the distributions we use the Kolmogorov-Smirnoff (K-S) test (eg. Barlow [1998]). In Figure 6 we note that there is some indication of a difference between the detected and non-detected cumulative magnitude distributions however, formally, the difference is not statistically significant, and so we cannot reject the null hypothesis that the two samples are drawn from the same population. The magnitude and redshift distribution of the two samples are shown in a slightly different way in Figures 8 and 9.
Plotted in Figure 10 are the fluxes and absolute magnitudes for the detections presented in this paper, as well as upper limits ( (90% confidence level) + “on-source signal”) for non-detections. Error bars for both detections and non detections are . It is difficult to make a quantitative assessment of the significance of the optical/submillimetre magnitude correlation, given the significant fraction of upper limits in the sample. There are two competing physical processes that would produce a statistically significant correlation between detected submillimetre flux and absolute quasar luminosity. Firstly, the most luminous quasars reside in the most massive host galaxies, in which there is likely to be ongoing star-formation – the larger the host galaxy, the greater the potential for massive bursts of star-formation, and thus more dust and more UV photon flux with which to heat the dust. More quantitatively, using Equations 2, 3 and 7,
| (8) |
If we observe these objects just before the end of their accretion lifetime, when the accretion rate encroaches upon the star formation rate, [2001]. Secondly, the more luminous the central quasar, the greater its UV-output, and thus the larger the power that may be absorbed by dust, and re-emitted in the rest-frame far-infrared.
A plot of the source magnitude vs. redshift for detections and non-detections also fails to reveal a preferential range of redshifts/magnitudes for which the number of detections is high. It must be cautioned, however, that the number of sources in any one bin is small, so the overall statistical significance of this result is low.


In addition, a potential systematic bias arises from the fact that the absolute -band magnitudes have been derived from the measured -band APM magnitudes. As discussed in Section 3.1, calculating an optical luminosity from an magnitude is complicated for sources at because the band is contaminated by redshifted Lyman- emission, and at higher redshifts, intergalactic absorption. We introduced a correction to account these effects, and found that it worked well on average, but that the scatter about the average was . Obtaining optical spectra and/or -band photometry for all the targets may ultimately help to alleviate this.
6.5 Non-detections – an assessment of the contribution of the population to the submillimetre-wave background
Shown in Figure 11 is the signal-to-noise distribution of the non-detections (solid line) – this has a clear non-zero mean. More quantitatively, the weighted mean of fluxes of the observed non-detections is mJy, a quantity that we can evaluate because our survey has a sensitivity that is consistent between sources to within a factor of . The mean can therefore be used to provide a statistical measure of the submillimetre flux of the underlying radio-quiet quasar host galaxy population. The derived value is consistent with the earlier estimate of mJy based on the deeper observations of a sample 6 z4 radio-quiet quasars [1999], and is also around the value that one might expect for an Arp220-like ultraluminous infrared galaxy at 4.5 (Figure 1 – the value obtained is between the curves predicted by the two different cosmological models). If we assume a source density for quasars of 1 per deg-2, and a mean flux as determined above, then the contribution of the quasar host galaxies to the background is negligible.
7 Followup work
Whilst useful for identifying the most submillimetre-bright sources, the detection of objects at a single wavelength clearly provides only limited insight into the detailed physical properties of the individual sources. Given the strong dependence of the inferred far-infrared luminosity on dust temperature, and that star-formation rates are derived from the far-infrared luminosity, it is important to determine the far-infrared spectral energy distributions for individual objects if we are to obtain independent measures of the star-formation properties and potential of the quasar host galaxies. We have started followup programs at several wavelengths: (a) a parallel program at using the IRAM-30m which, when combined with (b) measurements using SCUBA at the JCMT will be used to constrain the spectral energy distributions and thus dust temperatures and far-infrared luminosities (c) CO observations using millimetre interferometers to measure the gas mass, simultaneously setting upper limits to the physical extents of the high-z host galaxies, are also in progress along with (d) VLA observations to search for the signatures of starformation or weak radio-sources [2001b].
Our approach to targeting starformation at high-redshift has been to preselect candidates that are likely to have massive molecular gas reservoirs, as inferred from the presence of dust. At some redshift, however, it may become more efficient to search directly for the gas reservoir itself, as the presence of significant quantities of dust preselects for objects in which at least one massive starburst of star-formation must already have taken place.
A second selection effect arises from the original definition of our sample. By basing our sample on the most optically-bright quasars, we tacitly assume that the quasar and the host galaxy are coeval. Using arguments based on timescales given in Section 6.3 above, we have shown that this may be the case. The evidence, however, is not conclusive, and indeed depends on a number of assumptions, not least of which being that the rest-frame far-infrared luminosity is powered solely by star-formation, and that there is no gravitational lensing of the quasar and its host galaxy. With the combination of measurements of the CO, dust and optical properties, the physical parameters that we can derive from these measurements and a sample of statistically significant size, we will be able to investigate in a more quantitative manner.
We are currently undertaking a parallel search for submillimetre-bright quasar host galaxies at redshifts 2. The elapsed time interval between and is around , corresponding to a doubling of the age of the Universe at . Given the gas masses observed in these radio-quiet quasar host galaxies, and the high star-formation rates that we infer from the FIR luminosity (Table 3), one might expect that if the formation redshift of quasar host galaxies is high, a sizeable fraction of any molecular gas reservoir would be used up between and by . The submillimetre-wave properties of the two samples should therefore be quite different. We note, however, that the e-folding lifetime of the quasar () is considerably shorter than this interval (again, see Table 3), and so the quasar population that we see at may not be the same as the population. Any global evolution in submillimetre-wave luminosity between and host galaxies could in this case reflect variation in the underlying cosmological processes, such as merger rates, dynamical timescale and availability of cold gas, driving the evolution of the population [2000].
8 Summary
We have observed a total of 38 z4 radio-quiet quasars at using the JCMT. We have identified a total of 8 new submillimetre-bright sources with mJy including a previously ambiguous detection made at the IRAM-30m at 1.25 mm. The observations were carried out under modest observing conditions (sky transmission %), but even so the integration time per target was around 0.5 hour, giving an overall detection efficiency of 0.5 sources per hour of integration. This method, observing preselected targets in photometry mode, thus compares favourably with the complementary strategy of blank-field mapping. These observations triple the number of known z4 objects for which CO observations should be possible in a finite amount of observing time to . As such, we now have a submillimetre-bright sample of statistically significant size, for which we possess accurate identifications and spectroscopic redshifts, for which we can now start to study the star-formation properties in detail. We analysed a new optical spectrum of the BAL PSS J10484407, one of the sources detected, and find that the redshift is quite different from that used for CO observations of Guilloteau et al.,[1999], which may explain the observed lack of CO from this object. The strong 850 emission in contrast to the lack of 1.35mm emission detected in PdB observations suggests strongly that the much higher angular resolution obtained with the interferometer is causing significant fraction of the emission to be resolved out – the (sub)millimetre- source is extended.
Of the remaining 30 objects observed, 27 were observed down to a sensitivity of mJy and not detected. Based on this sample, we find that our detection rate is comparable to that measured by Omont et al.,[1996b] at 1.25 mm using 30-m, scaled to match the appropriate flux limits. At present, the sample (detections and non-detections) is too small to determine formally whether there is a range of absolute magnitudes and redshifts for which the rate of detection is high, however there may be some indication that the magnitude distribution of the detections and non-detections differ. We determined a fiducial flux of mJy for the non-detections, which we believe to be a statistical measure of the submillimetre flux of the more submillimetre-faint quasar host population.
Acknowledgments
We thank the support scientists and telescope support specialists at the JCMT, in particular Gerald Moriarty-Schieven and Iain Coulson, the “displaced observer” for the care and attention afforded to the observations and Tim Jenness for very useful discussions on SURF and ORACDR. KGI, RSP, CP and RS acknowledge a PPARC fellowship and PPARC studentships respectively, and RGM acknowledges the support of the Royal Society. This work was partially funded by the EC TMR FMRX-CT96-0068 and EARA. The JCMT is operated by JAC, Hilo, on behalf of the parent organisations of the Particle Physics and Astronomy Research Council in the UK, the National Research Council in Canada and the Scientific Research Organisation of the Netherlands.
References
- [ 1999] Abraham, R.G., Ellis, R.S., Fabian, A.C., Tanvir, N.R., Glazebrook, K., 1999 MNRAS, 303, 641
- [ 2000] Archibald, E.M., Dunlop, J.S., Hughes, D.H., Rawlings, S., Eales, S.A., Ivison, R.J., 2000 submitted MNRAS, astro-ph/0002083
- [ 1998] Barlow, R.J., 1998 Statistics, pub.
- [ 1996] Barger, A.J., Cowie, L.L., Sanders, D.B., Fulton, E., Taniguchi, Y., Sato, Y., Kawara, K., Okuda, H., 1996 Nature, 394, 248
- [ 1992] Barvainis, R., Antonucci, R.., Coleman, P., 1992 ApJ, 399,L19 Barger, A.J., Cowie, L.L., Sanders, D.B., Fulton, E., Taniguchi, Y., Sato, Y., Kawara, K., Okuda, H., 1996 Nature, 394, 248
- [, 1995] Becker, R.H., White, R.L., Helfand, D.J., 1995 ApJ, 450, 559
- [ 1991] Brown, R.L., Vanden Bout, P.A., 1991 AJ, 102, 1956
- [ 2001a] Carilli, C.L., Bertoldi, F., Rupen, M., Strauss, M.A., Menten, K.M., Hreysa, E., Schneider, D.P., Bertarini, A., Yun, M.S., Zylka, R. 2001 submitted ApJ, astro-ph/010352
- [ 2001b] Carilli, C.L., Bertoldi, F., Omont, A., Cox, P., McMahon, R.G., Isaak, K.G. 2001 accepted AJ, astro-ph/0107005
- [ 1992] Clements, D.L., Rowan-Robinson, M., Lawrence, A., Broadhurst, T., McMahon, R., 1992 MNRAS, 256, 35L
- [ 1998] Condon, J.J., Cotton, W.D., Greissen, E.W., Yin, Q.F., Perley, R.A., Taylor, G.B., Broderick, J.J., 1998 AJ, 115, 1693
- [ 2000] Djorgovski, G. Webpage Jan/August 2000: http://www.astro.caltech.edu/ george/z4.qsos
- [ 1998] Downes, D., Solomon, P.M., 1998 ApJ, 507, 615
- [ 1990] Duncan, W.D., Sandell, G., Robson, E.I., Ade, P.A.R., Griffin, M.J., 1990 MNRAS, 243, 126
- [ 2000] Dunlop, J., in “Deep Millimeter Surveys: Implications for Galxy Formation and evolution”, Eds. Lowenthal & Hughes
- [ 1999] Eales, S., Lilly, S., Gear, W., Dunne, L., Bond, R.J., Hammer, F., Le Fevre, O., Crampton, D., 1999 ApJ, 515, 518
- [ 1994] Elvis, M., Wilkes, B.J., McDowell, J.C., Green, R. F., Bechtold, J., Willner, S.P., Oey, M.S., Polomski, E., Cutri, R., 1994 ApJ Suppl., 95, 1
- [ 1999] Fan, X. et al., 1999 AJ, 118, 1
- [ 2000] Fan, X. et al., 2000 AJ, 119, 1
- [ 2001] Fan, X. et al., 2001 AJ, 121, 31
- [ 1991] Francis, P.J., Hewett, P.C., Foltz, C.B., Chaffee, F.H., Weymann, R.J., Morris, S.L., 1991 ApJ, 373, 465
- [ 1998] Frayer, D.T., Ivison, R.J., Scoville, N.Z., Evans, A.S., Yun, M., Smail, I., Barger, A.J., Blain, A.W., Kneib, J.-P., 1998 ApJ, 506, L7
- [ 2000] Frayer, D.T., Smail, I., Ivison, R.J., Scoville, N.Z., 2000 AJ, 120, 1668
- [ 1998] Friaça, A., Terlevich, R., 1998 MNRAS, 298, 399
- [ 1992] Fukugita, M., Futanase, T., Kasai, M., Turner, E.L., 1991 ApJ, Fukugita, M., Tutumases, T., Kasai, M., Turner, E.L., 1992 ApJ, 393, 3
- [ 2000] Gebhardt, K., Bender, R., Dressler, A., Faber, S.M., Filippenko, A.V., Green, R., Grillmair, C., Lauer, T.R., Magorrian, J., Pinkney, J., Richstone, D., Tremaine, S. 2000 ApJ, 539, L13
- [ 1998] Genzel, R., Lutz, D., Sturm, E., Egami, E., Kunze, D., Moorwood, A.F.M., Rigopoulou, Spoon, H.W.W., Sternberg, A., Tacconi-Garman, L.E., Tacconi, L., Thatte, N., 1998 ApJ, 498, 579
- [ 1999] Guilloteau, S., Omont, A., Cox, P., McMahon, R.G., Petitjean, P., 1999 A&A 349, 363
- [ 1998] Haehnelt, M., Natarajan, P., Rees, M., 1998 MNRAS, 300, 817
- [ 1983] Hildebrand, R.H., 1983 QJRAS, 24, 267
- [ 1999] Holland, W.S,Robson, E.I., Gear, W.K.P., Cunningham, C.R., Lightfoot, J.F., Jenness, T., Ivison, R.J., Stevens, J.A., Ade, P.A.R., Griffin, M.J., Duncan, W.D., Murphy, J.A., Naylor, D.A. 1999 MNRAS, 303, 659
- [ 1993] Hughes, D.H., Robson, E.I., Dunlop, J.S., Gear, W.P.K., 1993 MNRAS, 263, 609
- [ 1996] Hughes, D.H., Serjeant, S., Dunlop, J., Rowan-Robinson, M., Blain, A., Mann, R.G., Ivison, R., Peacock, J., Efstathiou, A., Gear, W., Oliver, S., Lawrence, A., Longair, M., Goldschmidt, P., Jenness, T., 1996 Nature, 394, 241
- [ 1994] Isaak, K.G., McMahon, R.G., Hills, R.E., Withington, S. 1994 MNRAS, 267, L28
- [ 1991] Irwin, M., McMahon, R.G., Hazard, C., 1991 ASP Conf. Series, 21, 117
- [ 1998] Ivison, R.J., Smail, I., Le Borge, J.-F., Blain, A.W., Kneib, J.-P., Bezecourt, J., Kerr, T.H., Davies, J.K., 1998 MNRAS, 298, 583
- [ 2000] Jenness, T., Economou, F., 2000 STARLINK 231
- [ 2000] Jenness, T., Lightfoot, J., 2000 STARLINK 216
- [ 2000] Kauffmann, G., Haehnelt, M. 2000 MNRAS, 311, 576
- [ 1995] Kennefick, J.D., Djorgovski, S.G., de Carvalho, R.R., 1995 AJ, 110, 2553
- [ 1996] Kennefick, J.D., Djorgovski, S.G., Meylan, G. 1996 AJ, 111, 1816
- [ 2000] Knudsen, K.K, van der Werf, P., Jaffe, W., in “Deep Millimeter Surveys: Implications for Galaxy Formation and evolution”, Eds. Lowenthal & Hughes
- [ 1993] Kochanek, C.S. 1993 ApJ, 417, 438
- [ 1998] Kreysa, E., Gemuend, H-P., Gromke, J., Haslam, C.G., Reichertz, L., Haller, E.E., Beeman, J.W., Hansen, V., Sievers, A, Zylka, R., 1998 Proc. SPIE Vol. 3357, 319, Advanced Technology MMW, Radio and Terahertz Telescopes, ed. Philips, T.G.
- [ 1995] Madau, P. 1995 ApJ, 441 18
- [ al., 1998] Madau, P., Pozzetti, L., Dickinson, M., 1998 ApJ, 498, 106
- [ 1998] Magorrian, J., Tremaine, S., Richstone, D., Bender, R., Bower, G., Dressler, A., Faber, S.M., Gebhardt, K., Green, R., Grillmair, C., Kormendy, J., Lauer, T., 1998 AJ, 115, 2285
- [ 1992] McMahon, R.G., Irwin, M.J., In Digitised Optical Sky Survyes Ed. H.T.MacGillivray & E.B.Thoimpson, Astrophysics and Space Science Library, 174, 417, Kluwer.
- [ 1994] McMahon, R.G., Omont, A., Bergeron, J., Kreysa, E., Haslam, C.G.T., 1994 MNRAS, 267, L9
- [ 1999] McMahon, R.G., Priddey, R.S., Omont, A., Snellen, I., Withington, S., 1999 MNRAS, 309, L1
- [ 1996] Ohta,K., Yamada, T., Nakanishi, K., Kohno, K., Akiyama, M., Kawabe, R., 1996 Nature 382, 426
- [ 1996a] Omont, A., Petitjean, P., Guilloteau, McMahon, R.G., Solomon, P.M., Pecontal, E., 1996 Nature 382, 428
- [ 2001] Omont, A., Cox, P., Bertoldi, F., McMahon, R.G., Carilli, C., Isaak, K.G., 2001 A&A accepted, astro-ph/0107005
- [ 1996b] Omont, A., McMahon, R.G., Cox, P., Kreysa, E., Bergeron, J., Pajot, F., Storrie-Lombardi, L.J., 1996 A&A 315, 1
- [ 2001] Peroux, C., Storrie-Lombardi, L.J., McMahon, R.G., Irwin, M.J., Hook, I.M., 2001 AJ, in press, astro-ph/0101179
- [ 2001] Priddey, R.S., McMahon, R.G. MNRAS, 324, L17
- [ 1984] Rees, M.J., 1984 ARAA, 34, 279
- [ 1999] Rix, H.-W., Falco, E., Impey, C., Kochanek, C., Lehar, J., McLeod, B., Munoz, J., Peng, C., astro-ph/991090
- [ 1999] Sakamoto, K., Scoville, N.Z., Yun, M.N., Crosas, M., Genzel, R., Tacconi, L.J., 1999 ApJ, 514, 68
- [ 1989] Sanders, D.B., Phinney, E.S., Neugebauer, G., Soifer, B.T., Matthews, K., 1989 ApJ, 347, 29
- [ 1991] Schneider, D.P., Schmidt, M., Gunn, J.E., 1991 AJ, 101, 2004
- [ 1991] Schneider, D.P., Greenstein, J.L., Schmidt, M., Gunn,J.E., 1991 AJ, 102, 1180
- [ 1992] Solomon, P.M., Radford, S.J.E., Downes, D., Brown, R.L., 1992 Nature 356, 318
- [ 2000] Stern, D., Djorgovski, S.G., Perly, R.A., de Carvalho, R.R., Wall, J.V., AJ, 119 1526
- [ 1996] Storrie-Lombardi, L.J., McMahon, R.G., Irwin, M.J., Hazard, C., 1996, ApJ, , 468, 121
- [ 2001] Storrie-Lombardi, L.J., Irwin, M.J., McMahon, R.G., Hook, I., 2000, MNRAS, in press, astro-ph/0012446
- [ 1997] Smail, I., Ivison, R.J., Blain, A.W., 1997 ApJ, 490, L5
- [ 1984] Turner, E.L., Ostriker, J.P., Gott III, J.R., 1984 ApJ, 284, 1
- [ 1992] Tytler, D., Fan, X.-M., 1992 ApJS 79, 1
- [ 2000] Wright, E.L. & Reese, E.D., 2000 ApJ, 545, 43