Evidence for binarity in the bipolar planetary nebulae A~79, He~2-428 and M~1-91 ††thanks: Based on observations made with the 2.5 m INT and the 2.6 m NOT telescopes operated on the island of La Palma by the ING and the NOTSA, respectively, in the Spanish Observatorio del Roque de Los Muchachos (ORM) of the Instituto de Astrofísica de Canarias.
We present low and high resolution long-slit spectra of three bipolar planetary nebulae (PNe) with bright central cores: A~79, He~2-428 and M~1-91. He~2-428 and M~1-91 have high density (from to cm-3) unresolved nebular cores that indicate that strong mass loss/exchange phenomena are occurring close to their central stars. An F0 star is found at the centre of symmetry of A~79; its reddening and distance are consistent with the association of the star with the nebula. The spectrum of the core of He~2-428 shows indications of the presence of a hot star with red excess emission, probably arising in a late-type companion. A~79 is one of the richest PNe in and , the abundances of M~1-91 are at the lower end of the range spanned by bipolar PNe, and He~2-428 shows very low abundances, similar to those measured for halo PNe. The extended nebulae of A~79 and He~2-428 have inclined equatorial rings expanding at a velocity of 15 km s-1, with kinematical ages 104 yrs. The association of these aged, extended nebulae with a dense nebular core (He 2-428) or a relatively late type star (A 79) is interpreted as evidence for the binarity of their nuclei.
Key Words.:
ISM: abundances – ISM: kinematics and dynamics – planetary nebulae: individual: A 79 – planetary nebulae: individual: He 2-428 – planetary nebulae: individual: M1-911 Introduction
Most planetary nebulae (PNe) possess axisymmetrical shapes, and some 10–15% of the global sample display a marked bipolar morphology, in the form of an ‘equatorial’ waist or ring from which symmetrical lobes depart (Corradi & Schwarz CS95 (1995)).
It has been shown that pure hydrodynamical collimation provided by dense equatorial disks or torii (Icke et al. I89 (1989)), and/or magneto-hydrodynamical collimation requiring the presence of toroidal fields (Chevalier & Luo che94 (1994)) can explain the development of the extreme bipolar geometries observed. While the dynamical mechanisms leading to the formation of bipolar lobes have therefore been identified, the AGB or post-AGB phase at which the asymmetries develop (e.g. Sahai sah00 (2000)) and the ultimate cause of their occurrence are still not well understood. In particular, whether a binary companion is needed to cause or enhance the asymmetry in the wind of the PN progenitor is the subject of a long term debate (cf. the proceedings of the recent conference edited by Kastner, Soker & Rappaport kas00 (2000)). A recent view (Soker & Rappaport sok00 (2000)) is that bipolar PNe, especially those with the most extreme morphologies, are formed in binary systems that avoid a common envelope evolution during the AGB phase of the star on the way of producing the PN, i.e. by binaries with (present) orbital separations from 5 to 200 AU. It is hard to find evidence of binary motions from radial velocity measurements, especially for the longest period systems. An additional, major reason that makes it difficult to find a direct evidence for binarity in bipolar PNe is that their central stars are generally faint. In some cases, this is because of dust obscuration in dense circumstellar discs surrounding the central stars, but in general it is due to the fact that bipolar PNe are produced by the most massive progenitors of PNe ( , Phillips phi01 (2001)), which rapidly evolve towards low-luminosities in their post-AGB evolution.
For these reasons, the surprisingly high brightness of the central star of He~2-428 (PN G049.4+02.4), whose bipolar nebula appears rather old in the existing narrowband images, attracted our attention and we decided to investigate its nature by means of low and high resolution spectroscopy. Abell~79 (PN G102.902.3) and M~1-91 (PN G061.3+03.6) were also observed because they share some similarities with He~2-428 and with a subclass of bipolar PNe having properties reminding those of known binary systems such as symbiotic stars (Corradi cor95 (1995)). The results of our spectroscopic study are presented in this paper.
2 Observations and data analysis
2.1 Low-resolution spectroscopy
| Object | PA | Date | Exposure times | Scale | ||
| (hh mm ss) | (° ′ ″) | (°) | (min.) | (″ pixel-1) | ||
| Low-resolution spectroscopy | ||||||
| He~2-428 | 19 13 05 | 15 46 42 | 0 | 1996 July 25 | 30, 3 (3690–6300) | 0.41 |
| 20, 3 (6020–9220) | ||||||
| M~1-91 | 19 32 57 | 26 52 40 | 1996 July 25 | 30, 3 (3690–6300) | 0.41 | |
| 20, 3 (6020–9220) | ||||||
| A~79 | 22 26 17 | 54 49 38 | 1996 Aug 3 | , (3690–7050) | 0.84 | |
| High-resolution spectroscopy | ||||||
| He~2-428 | 1999 August 31 | 0.14 | ||||
| A~79 | 1999 August 31 | 0.14 | ||||
Long-slit spectra covering the effective ranges 3650–9220 (He~2-428 and M~1-91) and 3690–7050 (A~79) were obtained at the 2.5 m Isaac Newton Telescope on La Palma equipped with the IDS spectrograph, the 500 mm camera (He~2-428 and M~1-91) or the 235 mm camera (A~79) and a CCD detector. The spectral ranges were covered with spectral resolutions of Å using either a grating of 150 lines mm-1 at two angles (He~2-428 and M~1-91), or a grating of 300 lines mm-1 at one angle (A~79) and slit widths of 11 (He~2-428 and M~1-91) and 16 (A~79). The long slit was placed through the central bright cores of the objects and across the rings and lobes. The positions and orientations (PA) of the slit, the spatial resolutions and the exposure times are listed in Table 1.
Bias frames, twilight or tungsten flat-field exposures, wavelength calibrations and exposures of the standard star BD~+284211 (from the IRAF compilation) were taken each night. The spectra were reduced to absolute intensity units using the IRAF reduction package, following standard procedures for the long-slit case. After the bias subtraction, flat-field correction and two-dimensional wavelength calibration, the individual exposures were flux calibrated using the standard star fluxes and the mean extinction curve for La Palma. Cosmic rays were removed and, after subtracting the sky contribution, the equivalent nebular spectra were combined to improve the signal-to-noise ratio.
One dimensional spectra were then extracted over the main morphological regions of the nebulae: the core or central star, the lobes and/or rings. The two regions on each side of the central star are identified in the following as A (the region towards the north for A~79 and He~2-428, and the region towards the west for M~1-91) and B (the regions towards the south or east). Tables 2-6 give the positions and sizes of the selected regions. Line intensities were measured in each region by fitting Gaussian profiles.
2.2 High-resolution spectroscopy
High resolution, long-slit spectra of He~2-428 and A~79 were obtained at the 2.6 m Nordic Optical Telescope on La Palma, using the echelle spectrograph IACUB and a Thompson THX31156 CCD. The projected slit width was 05, providing a spectral resolution 40000, with a reciprocal dispersion of 0.05 Å per binned pixel. The spectral range, selected using a narrowband filter, includes H and the [N ii] line. The slit position angles and exposure times are given in Table 1. The data were reduced using standard procedures in IRAF. The uncertainties in the measured relative velocities are of 2 km s-1.
2.3 Imaging
An image of He 2-428 was obtained on April 25, 2001, at the prime focus Wide Field Camera of the INT, equipped with a mosaic of 4 EEV CCDs. The scale was 033, the exposure time 10 min and the seeing 11. The central wavelength and width of the filter are 6568 Å and 95 Å, respectively.
2.4 Extinction correction and atomic data
In the low resolution spectra, line intensities have been corrected for extinction by interpolating Cardelli et al.’s (car89 (1989)) -dependent extinction law, with , the mean value for the diffuse interstellar medium. The logarithmic extinction (see Osterbrock ost89 (1989)) has been calculated for the outer nebular regions by fitting the ratio to its recombination value for suitable physical conditions: for and . The procedures followed to determine the values of the extinction parameter in the cores are explained in Sects 4.1, 4.2 and 4.3. All the values used for are given in Tables 2–6, along with the measured and reddening-corrected line intensities for each area.
The line ratios of [S ii] lines , [N ii] lines and [O iii] lines have been used to determine densities and temperatures. At high densities, like those found in the cores of He~2-428 and M~1-91 (see below), the [N ii] and [O iii] ratios are strongly dependent on density and can be used to determine this quantity if a value for the temperature is assumed. The physical conditions based on these lines as well as the ionic abundances implied by all the collisionally excited lines, excluding [Fe iii], have been determined with the nebular package in IRAF, with the atomic parameters referenced therein. The He i and He ii emissivities have been taken from Benjamin et al. (ben99 (1999)), [Fe ii] emissivities are from Bautista & Pradhan (bau96 (1996)). Collision strengths and transition probabilities for [Fe iii] are those from Zhang (zha96 (1996)) and Quinet (qui96 (1996)), respectively.
3 Morphology of the nebulae
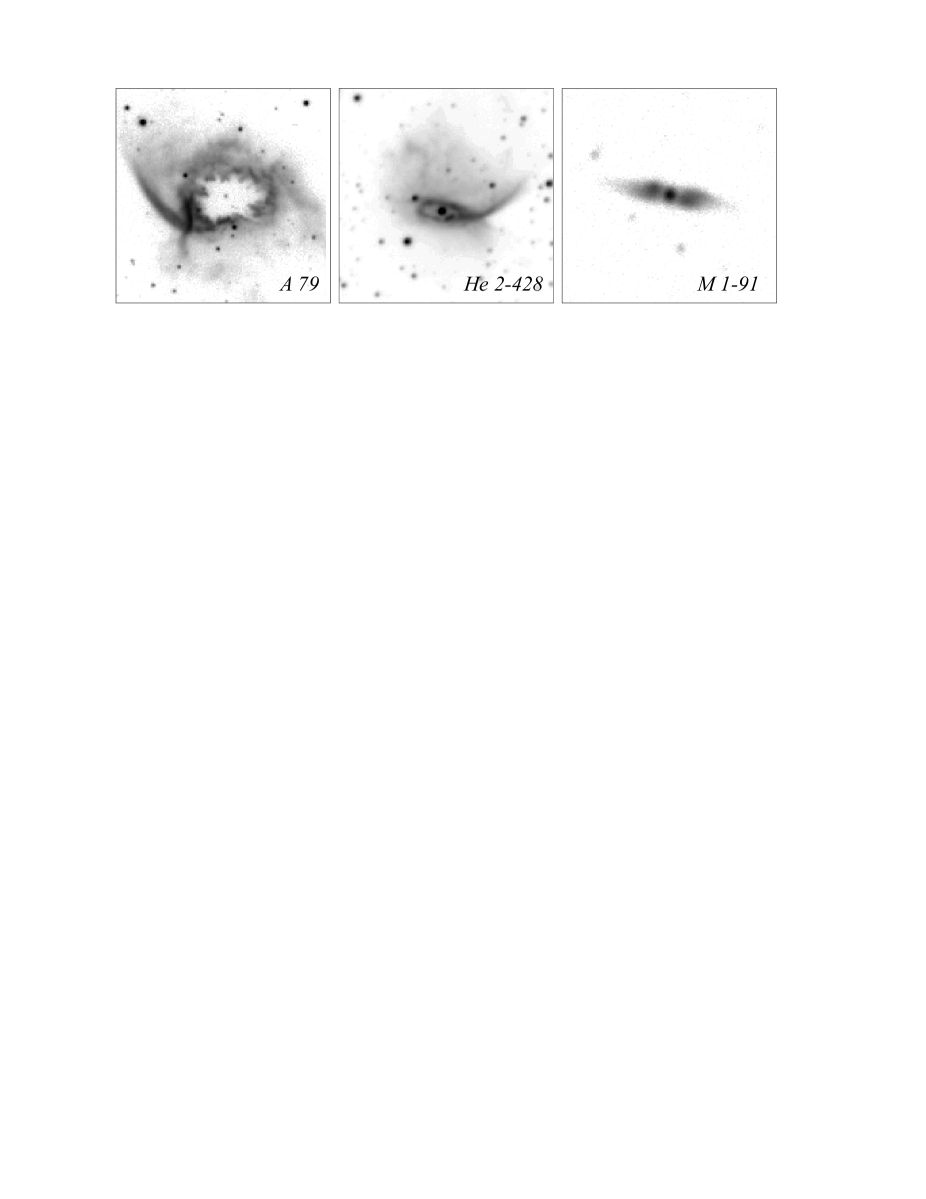
Figure 1 shows the images of the three nebulae. In addition to our INT image of He~2-428, a [N II] image of A~79 was kindly provided by B. Balick (from Balick B87 (1987)) and an H one of M~1-91 by T. Rauch (Rauch rau99 (1999)).
A~79 and He~2-428 (Fig. 1, left and centre) are similar, looking like rather evolved bipolar nebulae. They are composed of an irregular ring from which faint bipolar lobes depart, which appear to have almost vanished into the interstellar medium. Note the asymmetry in the surface brightness of the upper lobes, which have one edge much brighter than the other ones (the NE edge for A~79 and the NW one for He~2-428).
He~2-428 has a bright core inside the ring, while a fainter star-like object appears roughly at the centre of symmetry of the ring of A~79. M~1-91 (Fig. 1, right) also has a bright core, and possesses highly collimated lobes similar to those of its more studied sibling M~2-9 (cf. Doyle et al. doy00 (2000)).
4 The nuclei of the nebulae


The central source in A~79 is found to have a stellar spectra, which is shown in Fig. 2 and discussed in Sect. 4.1, but the nuclei of He~2-428 and M~1-91 have emission line spectra. Figure 3 shows a close-up of the low-resolution spectra of the bright cores of He~2-428 and M~1-91; Tables 2 and 3 show the line intensities relative to H before and after the extinction correction, the intensity measured for H, the logarithmic extinction and the size of the region over which the spectra have been extracted. Although both cores show indications of emission at high densities, as detailed below, their spectra are quite different. Both cores show the emission lines usually found in low-excitation nebulae (H i, He i, [O ii], [O iii], [N ii], [S ii], [Ar iii]). M~1-91 shows also numerous lines of Fe ii, [Fe ii], [Fe iii], [Fe iv], [Ni ii] – most of them characteristic of high-density emission nebulae. However, He~2-428 does not have a single line, but does show the IR triplet in emission. He~2-428 also has a quite strong continuum emission.
4.1 The central star of A~79
Figure 2 shows the low-resolution spectrum of the stellar-like object which is located roughly at the centre of symmetry of the nebular ring of A~79. At variance with He~2-428 and M~1-91, no nebular component is found in the core, and the spectrum is typical of a star of intermediate spectral type. This stellar spectrum has been compared with those in the library of stellar spectra of Jacoby et al. (jac84 (1984)). The best visual fit is obtained with an F0 V star, whose spectrum is also shown in Fig. 2, but our spectrum does not allow us to exclude the adjacent spectral types or to define the luminosity class. The spectrum has been corrected for extinction using , the value leading to the best fit with the F0 V star spectrum. This value is equivalent to , only somewhat higher than the optical depths found for the extended nebula of A~79 (), which supports the possibility that the star is in fact associated with the nebula. The agreement between the two spectra breaks in the range 5500–6400, where the central star of A~79 shows excess emission, a bump, over the comparison star. Similar excesses were found in two other field stars observed in the same exposure. The flux calibration was checked with another standard star and with data from different IRAF directories, but the bumps remained. They could be due to a deviation of the extinction curve from a linear trend around this wavelength region, known as the very broad structure in the extinction curve. The deviation seems to correlate with reddening and its origin is not well understood (see e.g. Jenniskens jen94 (1994)). However, the deviation found for the central star of A~79, which amounts to mag, is higher than the value expected from its reddening, mag. Therefore, other explanations, including some uncontrolled instrumental effect, cannot be excluded.
4.2 The core of He~2-428
| Identification | Identification | ||||||||
| 3726.3 | [O ii] 3726.0 + 3728.8 | 0.10 | 0.37 | 6678.8 | He i 6678.2 | 0.18 | 0.042 | ||
| 3869.4 | [Ne iii] 3868.8 | 0.36 | 1.14 | 6718.1 | [S ii] 6716.5 | 0.033 | 0.0077 | ||
| 3889.6 | He i 3888.7 + H8 3889.1 | 0.073 | 0.22 | 6732.5 | [S ii] 6730.9 | 0.043 | 0.0098 | ||
| 3968.9 | [Ne iii] 3967.5 + H 3970.1 | 0.11 | 0.30 | 7066.3 | He i 7065.3 | 0.42 | 0.081 | ||
| 4102.1 | H 4101.7 | 0.12 | 0.28 | 7136.9 | [Ar iii] 7135.8 | 0.65 | 0.12 | ||
| 4341.4 | H 4340.5 | 0.27 | 0.49 | 7282.4 | He i 7281.4 | 0.049 | 0.0084 | ||
| 4364.1 | [O iii] 4363.2 | 0.20 | 0.35 | 7321.0 | [O ii] 7319.7 | 0.54 | 0.090 | ||
| 4471.9 | He i 4471.5 | 0.034 | 0.053 | 7331.5 | [O ii] 7330.2 | 0.43 | 0.071 | ||
| 4862.3 | H 4861.2 | 1.00 | 1.00 | 7752.6 | [Ar iii] 7751.1 | 0.20 | 0.027 | ||
| 4923.6 | He i 4922.2 | 0.022 | 0.021 | 8416.0 | Pa19 8413.3 | 0.046 | 0.0044 | ||
| 4960.0 | [O iii] 4958.9 | 2.05 | 1.83 | 8447.5 | O i 8446.5 | 0.26 | 0.025 | ||
| 5007.9 | [O iii] 5006.8 | 6.42 | 5.48 | 8469.4 | Pa17 8467.3 | 0.061 | 0.0057 | ||
| 5756.4 | [N ii] 5754.6 | 0.057 | 0.023 | 8501.5 | Ca ii 8498.0 + Pa16 8502.5 | 0.16 | 0.015 | ||
| 5877.0 | He i 5875.7 | 0.41 | 0.17 | 8545.1 | Ca ii 8542.1 + Pa15 8545.4 | 0.17 | 0.015 | ||
| 6302.3 | [O i] 6300.3 | 0.16 | 0.047 | 8599.6 | Pa14 8598.4 | 0.095 | 0.0083 | ||
| 6312.0 | [S iii] 6312.1 | 0.14 | 0.040 | 8665.4 | Ca ii 8662.1 + Pa13 8665.0 | 0.18 | 0.015 | ||
| 6364.8 | [O i] 6363.8 | 0.059 | 0.016 | 8751.8 | Pa12 8750.5 | 0.12 | 0.0094 | ||
| 6549.1 | [N ii] 6548.0 | 0.12 | 0.031 | 8864.1 | Pa11 8862.8 | 0.18 | 0.014 | ||
| 6563.9 | H 6562.8 | 11.6 | 2.89 | 9070.4 | [S iii] 9068.9 | 1.17 | 0.101 | ||
| 6584.4 | [N ii] 6583.4 | 0.42 | 0.10 | ||||||
The spectrum of the nucleus of He~2-428 is shown in Figs. 3a and 3b; the measured and reddening-corrected intensities are listed in Table 2. The logarithmic extinction has been calculated by fitting the ratios , , , and to their recombination values for suitable physical conditions (see below). Optical depth effects might be affecting the H i intensities, as in M~1-91 (see Sect. 4.3), but since the reddening-corrected ratios are within 10% of their recombination values for and , these effects, if present, must be small.
The extinction-corrected line ratios imply densities in the ranges: , , for K (with the highest values for and corresponding to the lower temperature).
The core shows a relatively strong continuum, with absorption lines from He II and some interstellar features. When corrected for reddening, the continuum and the absorption lines can be reproduced with an O5 star and an additional continuum component with an apparent onset at Å. This additional component could be due to a late-type companion or arise in the line-emitting gas. The minimum contribution of this additional component to the observed continuum can be estimated by assuming that the continuum up to 5000 Å is mainly due to the hot star. We find that a minimum of 20–25% of the observed continuum should be due to this additional continuum component. The strongest source of nebular continuum that could produce an observable onset at 5000 Å, is the recombination continuum of H i. An estimate of its contribution to the observed continuum can be obtained from the intensity measured for H and the emission coefficients for this line and the continuum (Osterbrock ost89 (1989)). The result is that just a few percent of the observed continuum can be of nebular origin. Therefore, the additional continuum component is probably due to a late-type stellar companion of the hot star.
The spectrum in Fig. 3 shows also that the Ca ii infrared triplet lines appear in emission, blended with three Paschen lines. The Ca ii line intensities can be estimated by subtracting the expected contribution of the Paschen lines. This has been done by linearly interpolating the intensities of the surrounding Pa12, Pa14 and Pa17 lines. The three Ca ii lines turn out to have very similar intensities, with , and , i.e. in the ratio 1.0:0.9:0.7, whereas the ratio for optically thin emission is 1:9:5. A near equality of the Ca ii intensities is usually found in all objects where the triplet is in emission and is explained as due to a high optical depth. The Ca ii infrared triplet has been observed in emission in a variety of objects: some Be stars, high-luminosity young stellar objects (some with bipolar molecular outflows), certain active galactic nuclei, cataclysmic variable stars and T Tauri stars (Persson 1988a and references therein), symbiotic stars (Cieslinski et al. cie97 (1997)) and the proto-planetary nebula He~3-401 (García-Lario et al. gar99 (1999)). These objects support a dense neutral region in close proximity to a source of photons that is capable of ionizing – whose ionization potential is very low, 11.9 eV – unless it is well shielded. Therefore, for most of these Ca ii triplet emitters, the emission is expected to arise in a disk. Some of the Ca ii triplet emitters also show emission in [Ca ii] 7291 and 7324, transitions which arise in the metastable lower levels of the triplet lines. These forbidden lines are suppressed at high densities, so that their absence in the core of He~2-428 suggests in the Ca ii emitting region (Ferland & Persson fer89 (1989)). Most of the Ca ii emitters, unlike He~2-428, also show Fe ii emission, which at least in active galactic nuclei seems to be correlated with Ca ii emission (Persson 1988b ), although the Ca ii lines must arise in a more dense and optically thick material than Fe ii emission.
4.3 The core of M~1-91
| Identification | Identification | ||||||||
|---|---|---|---|---|---|---|---|---|---|
| 3724.5 | [O ii] 3726.0 + 3728.8 | 0.099 | 0.23 | 5550.8 | N ii 5552.0 ? | 0.0088 | 0.0055 | ||
| 3797.3 | H10 3796.9 | 0.024 | 0.053 | 5754.0 | [N ii] 5754.6 | 0.10 | 0.057 | ||
| 3835.0 | H9 3835.4 | 0.030 | 0.063 | 5798.8 | [Fe iv] 5798.0 () | 0.0088 | 0.0049 | ||
| 3868.3 | [Ne iii] 3868.8 | 0.19 | 0.39 | [Fe iv] 5800.4 () | |||||
| 3888.1 | He i 3888.7 + H8 3889.1 | 0.079 | 0.16 | 5875.4 | He i 5875.7 | 0.50 | 0.27 | ||
| 3968.3 | [Ne iii] 3967.5 + H 3970.1 | 0.16 | 0.30 | 5956.8 | Si ii 5957.6 | 0.012 | 0.0063 | ||
| 4027.3 | He i 4026.2 | 0.014 | 0.026 | 5978.4 | Si ii 5978.9 | 0.018 | 0.0094 | ||
| 4101.4 | H 4101.7 | 0.15 | 0.26 | 6000.4 | [Ni iii] 6000.2 (2) | 0.012 | 0.0062 | ||
| 4243.9 | [Fe ii] 4244.0 (21) | 0.0083 | 0.013 | 6046.1 | O i 6046.4 | 0.012 | 0.0062 | ||
| 4287.2 | [Fe ii] 4287.4 (7) | 0.025 | 0.039 | 6300.3 | [O i] 6300.3 | 0.086 | 0.042 | ||
| 4388.0 | He i 4387.9 | 0.0064 | 0.0091 | 6312.0 | [S iii] 6312.1 | 0.26 | 0.12 | ||
| 4340.3 | H 4340.5 | 0.31 | 0.45 | 6347.3 | Si ii 6347.1 | 0.022 | 0.0096 | ||
| 4362.8 | [O iii] 4363.2 | 0.25 | 0.36 | 6364.8 | [O i] 6363.8 | 0.041 | 0.018 | ||
| 4415.1 | [Fe ii] 4416.3 (6) | 0.023 | 0.032 | 6384.3 | Fe ii 6383.8 (…) | 0.0044 | 0.0019 | ||
| 4455.0 | [Fe ii] 4452.1 (7) | 0.0059 | 0.0079 | 6547.3 | [N ii] 6548.0 | 0.40 | 0.16 | ||
| [Fe ii] 4458.0 (6) | 6564.8 | H 6562.8 | 18.41 | 7.58 | |||||
| 4471.0 | He i 4471.5 | 0.055 | 0.073 | 6583.1 | [N ii] 6583.4 | 0.88 | 0.36 | ||
| 4606.6 | [Fe iii] 4607.1 (3) | 0.0054 | 0.0065 | 6678.1 | He i 6678.2 | 0.18 | 0.070 | ||
| 4657.9 | [Fe iii] 4658.1 (3) | 0.12 | 0.14 | 6716.0 | [S ii] 6716.5 | 0.036 | 0.014 | ||
| 4701.2 | [Fe iii] 4701.6 (3) | 0.054 | 0.060 | 6730.7 | [S ii] 6730.9 | 0.055 | 0.021 | ||
| 4712.2 | He i 4713.2 | 0.011 | 0.013 | 6915.4 | [Cr iv] 6914.8 (2) | 0.014 | 0.0052 | ||
| 4732.7 | [Fe iii] 4733.9 (3) | 0.023 | 0.025 | 6998.3 | [Fe iv] 6997.1 () | 0.031 | 0.011 | ||
| 4754.0 | [Fe iii] 4754.8 (3) | 0.028 | 0.030 | 7065.2 | He i 7065.3 | 0.55 | 0.19 | ||
| 4771.6 | [Fe iii] 4769.6 (3) | 0.033 | 0.035 | 7088.0 | [Fe iii] 7088.5 (15) | 0.011 | 0.0037 | ||
| [Fe iii] 4777.7 (3) | 7135.7 | [Ar iii] 7135.8 | 0.75 | 0.25 | |||||
| 4813.6 | [Fe ii] 4814.6 (20) | 0.020 | 0.021 | 7155.2 | [Fe ii] 7155.1 (14) | 0.061 | 0.021 | ||
| 4861.1 | H 4861.2 | 1.00 | 1.00 | 7171.5 | [Fe ii] 7172.0 (14) | 0.026 | 0.0087 | ||
| 4881.9 | [Fe iii] 4881.0 (2) | 0.0080 | 0.0078 | 7225.0 | [Fe iv] 7222.9 () | 0.012 | 0.0040 | ||
| 4890.5 | [Fe ii] 4889.6 (4) | 0.0083 | 0.0081 | 7235.4 | C ii 7236.2 | 0.021 | 0.0070 | ||
| 4905.2 | [Fe ii] 4905.4 (20) | 0.016 | 0.015 | 7254.2 | O i 7254.4 | 0.030 | 0.0099 | ||
| [Fe iv] 4906.7 () | 7281.3 | He i 7281.4 | 0.057 | 0.019 | |||||
| 4921.7 | He i 4921.9 | 0.031 | 0.030 | 7319.9 | [O ii] 7319.7 | 0.96 | 0.31 | ||
| 4930.8 | [Fe iii] 4930.5 (1) | 0.013 | 0.012 | 7330.2 | [O ii] 7330.2 | 0.75 | 0.24 | ||
| 4958.5 | [O iii] 4958.9 | 0.80 | 0.74 | 7378.0 | [Ni ii] 7377.9 (2) | 0.0254 | 0.017 | ||
| 5006.5 | [O iii] 5006.8 | 2.50 | 2.26 | 7387.8 | [Fe ii] 7388.2 (14) | 0.029 | 0.0092 | ||
| 5040.3 | Si ii 5041.0 | 0.025 | 0.022 | 7411.5 | [Ni ii] 7411.6 (2) | 0.021 | 0.0066 | ||
| 5084.2 | [Fe iii] 5084.8 (1) | 0.0081 | 0.0069 | 7452.7 | [Fe ii] 7452.5 (14) | 0.019 | 0.0059 | ||
| 5112.4 | [Fe ii] 5111.6 (19) | 0.0054 | 0.0045 | 7712.3 | Fe ii 7711.4 (73) | 0.012 | 0.0034 | ||
| 5159.5 | [Fe ii] 5157.9 (19) | 0.043 | 0.035 | 7750.9 | [Ar iii] 7751.1 | 0.22 | 0.062 | ||
| [Fe ii] 5158.8 (18) | 7816.2 | He i 7816.2 | 0.0095 | 0.0026 | |||||
| 5194.9 | [Ar iv] 5191.8 | 0.022 | 0.018 | 7890.8 | [Ni iii] 7889.9 (1) | 0.068 | 0.019 | ||
| [N ii] 5197.9 + 5200.3 | 7999.2 | [Cr ii] 7999.9 (1) | 0.036 | 0.0091 | |||||
| 5219.9 | [Fe ii] 5220.1 (19) | 0.0068 | 0.0053 | 8124.5 | [Cr ii] 8125.2 (1) | 0.042 | 0.010 | ||
| 5234.1 | [Fe iv] 5234.2 () | 0.0068 | 0.0053 | 8157.8 | Fe ii 8157.5 () ? | 0.0076 | 0.0019 | ||
| Fe ii 5234.6 (49) | 8187.1 | N i 8188.0 | 0.021 | 0.0051 | |||||
| 5270.3 | [Fe ii] 5261.6 (19) | 0.16 | 0.12 | 8345.1 | He i 8342.4 + Pa23 8345.6 | 0.028 | 0.0064 | ||
| [Fe iii] 5270.4 (1) | 8359.5 | Pa22 8359.0 + He i 8361.7 | 0.058 | 0.013 | |||||
| [Fe ii] 5273.4 (18) | 8374.3 | Pa21 8374.5 | 0.022 | 0.0050 | |||||
| 5317.9 | Fe ii 5316.6 (49) | 0.0053 | 0.0039 | 8392.0 | Pa20 8392.4 | 0.031 | 0.0069 | ||
| 5333.6 | [Fe ii] 5333.7 (19) | 0.015 | 0.011 | 8412.9 | Pa19 8413.3 | 0.049 | 0.011 | ||
| 5348.0 | ? | 0.0027 | 0.0019 | 8446.3 | O i 8446.5 | 0.60 | 0.13 | ||
| 5363.9 | Fe ii 5362.9 (48) | 0.0063 | 0.0045 | 8467.0 | Pa17 8467.3 | 0.069 | 0.015 | ||
| 5376.2 | [Fe ii] 5376.5 (19) | 0.014 | 0.0095 | 8501.6 | Pa16 8502.5 | 0.099 | 0.022 | ||
| 5411.8 | [Fe iii] 5412.0 (1) | 0.021 | 0.014 | 8545.5 | Pa15 8545.4 | 0.086 | 0.018 | ||
| 5433.9 | [Fe ii] 5433.1 (18) | 0.0074 | 0.0050 | 8580.5 | [Cl ii] 8578.7 + He i 8582.5 | 0.028 | 0.0060 | ||
| 5526.5 | [Fe ii] 5527.3 (17) | 0.015 | 0.0096 | 8598.2 | Pa14 8598.4 | 0.11 | 0.024 |
| Identification | Identification | ||||||||
| 8616.6 | [Fe ii] 8617.0 (13) | 0.086 | 0.018 | 8862.7 | Pa11 8862.8 | 0.21 | 0.041 | ||
| 8664.7 | Pa13 8665.0 | 0.13 | 0.027 | 8891.5 | [Fe ii] 8891.9 (13) | 0.039 | 0.0076 | ||
| 8682.4 | N i 8680.2 + 8683.4 | 0.022 | 0.0046 | 8926.0 | Fe ii 8926.7 () | 0.069 | 0.013 | ||
| 8728.6 | [Fe iii] 8728.9 (8) | 0.034 | 0.0070 | 9014.8 | Pa10 9014.9 | 0.27 | 0.051 | ||
| 8750.3 | Pa12 8750.5 | 0.16 | 0.032 | 9068.7 | [S iii] 9068.9 | 1.53 | 0.29 | ||
| 8840.0 | [Fe iii] 8838.2 (8) | 0.034 | 0.0070 | ||||||
The spectrum of the core of M~1-91 is shown in Figs. 3c and 3d; the measured and reddening-corrected intensities are listed in Table 3. The relative intensities of the H i lines do not agree with case B expectations for any amount of reddening, implying that the core of M~1-91 must be optically thick in H (Drake & Ulrich dra80 (1980)). Since the amount of extinction has been estimated by averaging those derived for the outer regions of the nebulae (see Sect. 4), and it is probably higher in the core, the reddening-corrected intensities are mainly given for illustrative purposes.
Line identifications rely on the comparison of the spectrum with those of He~2-25 and Th~2-B (Corradi cor95 (1995)), M8 (Esteban et al. est99 (1999)), $η$~Car (Hamann et al. ham94 (1994)), RR~Tel (McKenna et al. mck97 (1997)), IC~4997 (Hyung et al. hyu94 (1994)), the peculiar B[e] star HD~45677 (Swings swi73 (1973)), and the tables by Moore (moo45 (1945)). The lines can have contributions of fainter transitions, mainly from [Fe ii] and Fe ii, and some weak lines of Mg ii may also be present. The spectrum is very similar to those found in the cores of its sibling M2-9 (as noted previously by Calvet & Cohen cal78 (1978) and Goodrich goo91 (1991)) and other highly collimated planetary nebulae: He~2-25 and Th~2-B (Corradi cor95 (1995)). The four objects have however different degrees of excitation and the intensities of the [Fe iv], [Fe iii], [Fe ii] and Fe ii lines are also different, probably reflecting different conditions of density, and maybe, different evolutionary states.
The extinction-corrected line ratios, after allowing for a possibly somewhat higher extinction correction, imply densities in the ranges: , , , and for K.
5 Chemical abundances in the lobes or rings
| A~79 A | A~79 B | |||||||
| Identification | ||||||||
| 3727.6 | 2.27 | 3.32 | 3727.1 | 3.02 | 4.12 | [O ii] 3726.0+3728.8 | ||
| 3868.2 | 1.38 | 1.94 | 3867.8 | 1.27 | 1.67 | [Ne iii] 3868.8 | ||
| 4339.8 | 0.41 | 0.49 | 4340.6 | 0.48 | 0.55 | H 4340.5 | ||
| 4685.0 | 1.06 | 1.12 | 4685.1 | 0.84 | 0.88 | He ii 4685.7 | ||
| 4860.8 | 1.00 | 1.00 | 4860.7 | 1.00 | 1.00 | H 4861.2 | ||
| 4958.4 | 3.54 | 3.42 | 4958.5 | 2.56 | 2.50 | [O iii] 4958.9 | ||
| 5006.2 | 10.75 | 10.24 | 5006.5 | 8.14 | 7.83 | [O iii] 5006.8 | ||
| 5198.0 | 0.23 | 0.20 | 5199.0 | 0.26 | 0.24 | [N i] 5197.9+5200.3 | ||
| 5753.2 | 0.46 | 0.35 | 5754.6 | 0.45 | 0.36 | [N ii] 5754.6 | ||
| 5875.8 | 0.15 | 0.11 | 5876.3 | 0.23 | 0.18 | He i 5875.7 | ||
| 6300.1 | 0.42 | 0.29 | 6300.6 | 0.58 | 0.43 | [O i] 6300.3 | ||
| 6311.5 | 0.17 | 0.12 | 6312.2 | 0.08 | 0.06 | [S iii] 6312.1 | ||
| 6547.3 | 6.43 | 4.27 | 6547.9 | 7.69 | 5.52 | [N ii] 6548.0 | ||
| 6562.1 | 4.24 | 2.81 | 6562.7 | 3.91 | 2.80 | H 6562.8 | ||
| 6582.6 | 19.38 | 12.78 | 6583.1 | 22.36 | 15.98 | [N ii] 6583.4 | ||
| 6715.7 | 1.43 | 0.92 | 6716.3 | 1.73 | 1.22 | [S ii] 6716.5 | ||
| 6730.1 | 1.09 | 0.70 | 6730.6 | 1.37 | 0.97 | [S ii] 6730.9 | ||
| 0.48 | 0.39 | |||||||
| 118 | 84 | |||||||
| 185 | 244 | |||||||
| a Distance from the center of the extracted region to the central star | ||||||||
| He~2-428 A | He~2-428 B | |||||||
| Identification | ||||||||
| 3727.1 | 0.70 | 1.97 | 3727.6 | 0.63 | 1.95 | [O ii] 3726.0+3728.8 | ||
| 4101.9 | 0.18 | 0.36 | 4102.3 | 0.11 | 0.24 | H 4101.7 | ||
| 4340.4 | 0.32 | 0.51 | 4341.2 | 0.36 | 0.60 | H 4340.5 | ||
| 4861.9 | 1.00 | 1.00 | 4862.2 | 1.00 | 1.00 | H 4861.2 | ||
| 4959.7 | 1.34 | 1.23 | 4959.8 | 1.29 | 1.17 | [O iii] 4958.9 | ||
| 5007.7 | 4.15 | 3.66 | 5007.9 | 3.92 | 3.42 | [O iii] 5006.8 | ||
| 5757.2 | 0.05 | 0.02 | 5753.2 | 0.06 | 0.03 | [N ii] 5754.6 | ||
| 5876.7 | 0.34 | 0.16 | 5876.8 | 0.34 | 0.15 | He i 5875.7 | ||
| 6300.7 | 0.09 | 0.03 | 6302.0 | 0.15 | 0.05 | [O i] 6300.3 | ||
| 6549.0 | 0.75 | 0.25 | 6549.2 | 1.11 | 0.34 | [N ii] 6548.0 | ||
| 6563.8 | 8.38 | 2.77 | 6564.0 | 9.32 | 2.80 | H 6562.8 | ||
| 6584.3 | 2.22 | 0.73 | 6584.6 | 3.34 | 0.99 | [N ii] 6583.4 | ||
| 6678.9 | 0.15 | 0.05 | 6679.5 | 0.14 | 0.04 | He i 6678.2 | ||
| 6716.8 | 0.25 | 0.08 | 6717.8 | 0.36 | 0.10 | [S ii] 6716.5 | ||
| 6731.2 | 0.28 | 0.09 | 6732.2 | 0.42 | 0.12 | [S ii] 6730.9 | ||
| 7066.6 | 0.17 | 0.05 | 7066.4 | 0.14 | 0.03 | He i 7065.3 | ||
| 7137.2 | 0.36 | 0.09 | 7137.1 | 0.41 | 0.10 | [Ar iii] 7135.8 | ||
| 7320.8 | 0.20 | 0.05 | 7321.6 | 0.30 | 0.06 | [O ii] 7319.7 | ||
| 7331.3 | 0.16 | 0.04 | 7332.1 | 0.18 | 0.04 | [O ii] 7330.2 | ||
| 9070.4 | 1.44 | 0.18 | 9070.8 | 1.58 | 0.16 | [S iii] 9068.9 | ||
| 1.30 | 1.41 | |||||||
| 33 | 33 | |||||||
| 37 | 37 | |||||||
| a Distance from the center of the extracted region to the core | ||||||||
| M~1-91 A | M~1-91 B | |||||||
| Identification | ||||||||
| 3726.7 | 0.90 | 1.95 | 3726.4 | 0.86 | 2.05 | [O ii] 3726.0 + 3728.8 | ||
| 3868.5 | 0.039 | 0.076 | 3867.8 | 0.029 | 0.062 | [Ne iii] 3868.8 | ||
| 4101.3 | 0.15 | 0.25 | 4101.3 | 0.16 | 0.29 | H 4101.7 | ||
| 4340.2 | 0.33 | 0.47 | 4340.0 | 0.33 | 0.49 | H 4340.5 | ||
| 4362.8 | 0.032 | 0.045 | 4362.2 | 0.012 | 0.018 | [O iii] 4363.2 | ||
| 4471.0 | 0.043 | 0.056 | 4470.6 | 0.031 | 0.042 | He i 4471.5 | ||
| 4657.1 | 0.023 | 0.027 | 4657.5 | 0.020 | 0.023 | [Fe iii] 4658.1 (3) | ||
| 4861.0 | 1.00 | 1.00 | 4860.8 | 1.00 | 1.00 | H 4861.2 | ||
| 4881.8 | 0.0095 | 0.0094 | 4882.3 | 0.0073 | 0.0072 | [Fe iii] 4881.0 (2) | ||
| 4922.0 | 0.017 | 0.017 | 4921.9 | 0.018 | 0.017 | He i 4921.9 | ||
| 4958.6 | 0.54 | 0.51 | 4958.4 | 0.56 | 0.52 | [O iii] 4958.9 | ||
| 4985.6 | 0.0061 | 0.0057 | 4984.1 | 0.016 | 0.015 | [Fe iii] 4985.9 + 4987.2 (2) | ||
| 5006.6 | 1.69 | 1.53 | 5006.3 | 1.73 | 1.55 | [O iii] 5006.8 | ||
| 5198.8 | 0.030 | 0.024 | 5198.0 | 0.030 | 0.023 | [N i] 5197.9 + 5200.3 | ||
| 5269.4 | 0.030 | 0.023 | 5270.0 | 0.025 | 0.018 | [Fe iii] 5270.4 (1) | ||
| 5753.9 | 0.037 | 0.022 | 5753.9 | 0.039 | 0.022 | [N ii] 5754.6 | ||
| 5875.6 | 0.27 | 0.15 | 5875.2 | 0.27 | 0.14 | He i 5875.7 | ||
| 6300.0 | 0.074 | 0.035 | 6299.7 | 0.070 | 0.030 | [O i] 6300.3 | ||
| 6312.0 | 0.022 | 0.011 | 6311.7 | 0.023 | 0.010 | [S iii] 6312.1 | ||
| 6364.0 | 0.023 | 0.011 | 6363.9 | 0.031 | 0.013 | [O i] 6363.8 | ||
| 6547.7 | 1.57 | 0.69 | 6547.6 | 1.84 | 0.73 | [N ii] 6548.0 | ||
| 6562.7 | 6.54 | 2.87 | 6562.6 | 7.30 | 2.87 | H 6562.8 | ||
| 6583.1 | 4.90 | 2.13 | 6582.6 | 5.73 | 2.23 | [N ii] 6583.4 | ||
| 6677.6 | 0.086 | 0.037 | 6677.3 | 0.098 | 0.037 | He i 6678.2 | ||
| 6716.2 | 0.32 | 0.13 | 6715.8 | 0.35 | 0.13 | [S ii] 6716.5 | ||
| 6730.6 | 0.45 | 0.19 | 6730.2 | 0.51 | 0.19 | [S ii] 6730.9 | ||
| 7064.9 | 0.092 | 0.035 | 7064.4 | 0.11 | 0.036 | He i 7065.3 | ||
| 7135.7 | 0.30 | 0.11 | 7135.1 | 0.35 | 0.11 | [Ar iii] 7135.8 | ||
| 7281.7 | 0.019 | 0.0067 | 7280.3 | 0.025 | 0.0078 | He i 7281.4 | ||
| 7320.0 | 0.096 | 0.033 | 7318.7 | 0.11 | 0.032 | [O ii] 7319.7 | ||
| 7330.0 | 0.074 | 0.026 | 7329.2 | 0.097 | 0.029 | [O ii] 7330.2 | ||
| 7750.6 | 0.088 | 0.027 | 7750.3 | 0.10 | 0.027 | [Ar iii] 7751.1 | ||
| 8446.6 | 0.094 | 0.023 | 8446.3 | 0.068 | 0.014 | O i 8446.5 | ||
| 8545.4 | 0.021 | 0.0051 | 8543.3 | 0.045 | 0.0090 | Pa15 8545.4 | ||
| 8597.8 | 0.035 | 0.0083 | 8597.7 | 0.041 | 0.0079 | Pa14 8598.4 | ||
| 8664.4 | 0.047 | 0.011 | 8664.6 | 0.052 | 0.010 | Pa13 8665.0 | ||
| 8750.6 | 0.043 | 0.0098 | 8750.4 | 0.051 | 0.0095 | Pa12 8750.5 | ||
| 8862.1 | 0.058 | 0.013 | 8861.3 | 0.056 | 0.010 | Pa11 8862.8 | ||
| 9014.2 | 0.075 | 0.016 | 9014.6 | 0.12 | 0.020 | Pa10 9014.9 | ||
| 9068.7 | 1.16 | 0.24 | 9068.3 | 1.39 | 0.24 | [S iii] 9068.9 | ||
| 0.97 | 1.10 | |||||||
| 41 | 41 | |||||||
| 62 | 62 | |||||||
| a Distance from the center of the extracted region to the core | ||||||||
The measured line intensities for the extended areas (lobes or rings) of the three objects, along with the values derived for the logarithmic extinction and the reddening-corrected relative intensities for all lines of interest are presented in Tables 4, 5 and 6.
| Position | O+ | O++ | N+ | S+ | S++ | Ar++ | Ne++ | He+ | He++ | Fe++ | ||
|---|---|---|---|---|---|---|---|---|---|---|---|---|
| (cm-3) | (K) | |||||||||||
| He~2-428 A | 1100 | 13700 | 2.7e-5 | 4.9e-5 | 6.9e-6 | 2.4e-7 | 2.6e-6 | 4.3e-7 | … | 0.13 | … | … |
| He~2-428 B | 1200 | 14500 | 2.2e-5 | 3.9e-5 | 8.4e-6 | 2.8e-7 | 2.1e-6 | 4.3e-7 | … | 0.12 | … | … |
| M~1-91 A | 2400 | 8700 | 2.0e-4 | 8.8e-5 | 6.3e-5 | 1.5e-6 | 8.1e-6 | 1.4e-6 | 1.5e-5 | 0.11 | … | 2.3e-6 |
| M~1-91 B | 2300 | 8600 | 2.2e-4 | 9.4e-5 | 6.8-5 | 1.6e-6 | 8.3e-6 | 1.5e-6 | 1.3e-5 | 0.11 | … | 1.6e-6 |
| A~79 A | 110 | 14000 | 3.7e-5 | 1.4e-4 | 1.2e-4 | 1.9e-6 | 8.8e-6 | … | 6.9e-5 | 0.095 | 0.102 | … |
| A~79 B | 170 | 12600 | 6.7e-5 | 1.4e-4 | 1.9e-4 | 3.2e-6 | 6.2e-6 | … | 8.2e-5 | 0.15 | 0.078 | … |
| Position | [O/H] | log(N/O) | [N/H] | [S/H] | [Ar/H] | [Ne/H] | He/H |
| He~2-428 A | 7.88 | 0.59 | 7.30 | 6.51 | 5.90 | … | |
| He~2-428 B | 7.79 | 0.42 | 7.36 | 6.38 | 5.90 | … | |
| M~1-91 A | 8.46 | 0.50 | 7.97 | 6.98 | 6.41 | 7.69 | |
| M~1-91 B | 8.49 | 0.51 | 7.98 | 7.00 | 6.45 | 7.63 | |
| A~79 A | 8.45 | 0.50 | 8.94 | 7.18 | … | 8.15 | 0.19 |
| A~79 B | 8.43 | 0.45 | 8.89 | 7.04 | … | 8.20 | 0.21 |
| BPNa | 7.95 to 8.87 | 0.68 to 0.47 | 7.95 to 8.86 | 6.26 to 7.18 | 6.04 to 6.76 | 7.78 to 8.34 | 0.11 to 0.25 |
| H iib | 8.45 | 0.75 | 7.70 | 7.00 | 6.40 | 7.60 | |
| M2-9c | 8.36 | 0.57 | 7.79 | … | … | 7.41 |
The values for the temperatures , densities and ionic abundances for the three nebulae, derived with the atomic data referenced in Sect. 2.4, are listed in Table 7. The [O iii] line could be measured in both positions of M~1-91, but it has a poor signal-to-noise ratio, it could furthermore be contaminated by reflection from the core, and leads to temperatures up to 18500 K, which are much higher than the temperatures derived from the [N ii] lines (8600 and 8700 K) and have not been used in the abundance determination.
In A~79, where the intensity of He ii is similar to that of H, the H Balmer intensities in Table 4 include the contribution of the lines from the He Pickering series. This contribution was estimated using and (Storey & Hummer sto95 (1995)). The line intensities used in the abundance determination for A~79 were consequently corrected by multiplying the line intensities in Table 4 by 1.06 (A~79 A) and 1.05 (A~79 B).
The total abundances were derived by estimating the contribution of the unobserved ions using the relations of Kingsburgh & Barlow (kin94 (1994)); the results are presented in Table 8. An estimate of the abundance for M~1-91 can be obtained from , or about one fourth of the solar value.
The derived abundances can be compared with those found for 15 bipolar PNe by Perinotto & Corradi (per98 (1998)) and Pottasch et al. (pot00 (2000)), and with the abundances measured in H ii regions in the solar neighbourhood (Osterbrock ost92 (1992); Rodríguez rod99 (1999)), also shown in Table 8. A~79 is among the richest PNe in and , and shows a overabundance that could be real (Perinotto & Corradi per98 (1998)). M~1-91 and He~2-428 have a abundance ratio one order of magnitude lower, unusual but not unique among bipolar PNe (cf. Fig. 8 in Perinotto & Corradi per98 (1998)). The , and abundances in A~79 and M~1-91, and the abundance in M~1-91, are essentially identical to those measured in nearby Galactic H ii regions. This is not unexpected since the Galactocentric distances of the three PNe considered here are most probably between 6 and 10 kpc (this can be deduced from their distances: see Sect. 7), the same distance range covered by the H ii regions whose abundances are given in Table 8. However, He~2-428 shows quite low abundances for most elements relative to , when compared both with the H ii regions and with the sample of bipolar PNe. In fact, the abundances are similar to those found for PNe belonging to the halo (Howard et al. how97 (1997)) and close to the abundances of some PNe classified as Peimbert’s (pei78 (1978)) type III, i.e belonging to an intermediate type between disc and halo nebulae (Maciel et al. mac90 (1990)). This low metallicity suggests that the central star of He~2-428 had a low-mass progenitor. The low upper limit derived for 2 emission in this nebula by Guerrero et al. (gue00 (2000)) strengthens this conclusion, since 2 emission in PNe seems to show some correlation with the mass of the progenitor star (Zuckerman & Gatley zuc88 (1988)).
6 Kinematics of A~79 and He~2-428
The expansion velocities of the rings of A~79 and He~2-428 have been derived by assuming that the rings are intrinsically circular so that their inclination , or angle between the polar axis of the ring and the line of sight, can be estimated from the relative lengths of the major and minor semi-axis in the [N II] images. This inclination angle can then be used to deproject the velocities measured in the high-resolution spectra.
The ring of A~79, which is fragmented and broadened, is estimated to have its major semi-axis, equivalent to the ring radius, at a position angle with size and inclination . The ring of He~2-428 is more clearly defined, with its major semi-axis at , with and .
The velocities in the rings and lobes of the nebulae were measured by fitting Gaussian profiles to the [N II] 6583 line in the echelle spectra; this line was chosen since it has a lower thermal broadening than the H line.
The slit orientations for A~79 were located off the major and minor axes of the ellipse that fits the ring in the image. The differences in velocity between opposite regions of the ring were found to be km s-1, for the position near the minor axis (), and km s-1 for the position near the major axis (). These velocities can be deprojected to the plane of the ring by using the expression , where , and is the offset angle between the slit and the major axis of the ellipse. The deprojected velocities are consistent, within the errors, with the hypothesis of a circular ring expanding at km s-1 (its northern side approaching us and the southern one receding with respect to the core). Assuming a constant expansion velocity, its kinematical age is then yrs, where is the distance in kpc. The systemic velocity of A~79 is km s-1 with respect to the Local Standard of Rest. No detailed information is available for the expansion pattern in the faint, asymmetrical lobes.
In He~2-428, the long slit was oriented very close to the minor and major axes of the ring. As expected for an inclined expanding ring, no velocity difference was found between regions of the ring on either side of the central star along the major axis (), while a difference of km s-1 was found along the minor axis (). Correcting for an inclination (), the deprojected expansion velocity of the ring is found to be 15 km s-1, with the northern side receding and the southern one approaching us with respect to the core. Its kinematical age is yrs, where is the distance in kpc. The systemic velocity of He~2-428, as computed from the symmetry of the velocity field of the ring, is km s-1 in the frame of the Local Standard of Rest. The lobes show hints of expansion velocities larger by km s-1 than those in the ring, as usually found in bipolar PNe, but the signal is faint and no detailed spatiokinematical modeling was possible.
In the core of He~2-428, H is found to have a relatively broad, double-peaked and asymmetrical profile. The full-width at zero intensity of the lines is 137 km s-1. This profile might reflect a complex velocity field in the unresolved circumstellar nebula, but its double peak, if not the asymmetry, could be the consequence of transfer effects in a static stellar envelope (Magnan & de Laverny mag97 (1997)).
The expansion velocities of the rings of He~2-428 and A~79 are low when compared with the usual expansion velocities of bipolar PNe, which go up to several hundred km s-1 (Corradi & Schwarz CS95 (1995)). However, these high velocities are found in the polar directions of bipolar PNe, whereas the equatorial velocities of these objects are generally much lower (e.g. Corradi & Schwarz CS93 (1993)), and similar to the velocities found for A~79 and He~2-428.
7 Discussion
The distances to A~79 and He~2-428 have been derived assuming that their measured systemic velocities reflect their participation in the general circular rotation around the Galactic centre. This is expected to be a good assumption for most bipolar PNe, since many of the characteristics of these objects relate them to the Galactic young disc population (Corradi & Schwarz CS95 (1995)), but it could fail for He~2-428 if – as its low abundances may imply – this nebula is related to an older population.
For a standard Galactic rotation curve (cf. Corradi & Schwarz CS95 (1995)), the distance to A~79 is found to be 52 kpc, with the error taking into account the uncertainty in its derived systemic velocity and the dispersion in the velocity ellipsoids at a given location in the Galaxy. An independent estimate of the distance to A~79 can be obtained assuming that its central star belongs to the nebula. We have performed synthetic photometry on our low-resolution spectrum of this star to derive its magnitude. Correcting for a light loss of 50% due to the narrow slit width, we derive mag. Assuming that the star is not a supergiant and correcting the spectrum for a reddening mag (each value obtained from the comparison of the observed spectrum with the spectra given by Jacoby et al. (jac84 (1984)) for stars of type F0 V, F0 IV, F0 III, F3 V or A9 V) we obtain . These values, when compared with the absolute magnitudes expected for the corresponding spectral types (Schmidt-Kaler Sch82 (1982)) give a distance range 2.7–4.5 kpc, which is consistent with our distance estimate for A~79 given above and thus provides marginal evidence for the association of the star with the nebula. With a distance of 3–5 kpc, the age of the nebular ring of A~79 would be 13 000–21 500 yrs, its radius 0.17–0.28 pc, and the total size of the nebula 1.2–2.0 pc. Previous distance determinations for this object give 1.8–4.5 kpc (Zhang zh95 (1995) and references therein).
Assuming that the systemic velocity of He~2-428 is also due to its circular rotation around the Galactic centre, we find a distance between 4 and 8 kpc. For this distance range, the kinematical age of the ring would be 8 000–16 000 yrs, its radius 0.12–0.24 pc and the total size of the nebula, including what is observed of the faint lobes, 1–2 pc. The possibility that He~2-428 is a type III PN (see Sect. 5), a class with peculiar velocities of km s-1 (Costa et al. cos96 (1996)), casts some doubts on the derived parameters. However, previous distance determinations for this object, based on independent methods, give a distance of 7.1–10.0 kpc (Zhang zh95 (1995) and references therein); the lower limit is consistent with our derived distance range and the upper limit implies negligible changes in the age and size derived for the nebula.
The ages derived for A~79 and He~2-428, yrs, imply that they are evolved PNe. At such ages, the stellar remnants are expected to have evolved to high temperatures and then to low luminosities in their post-AGB evolution, unless they have low masses. The large and abundances of A~79 suggest a high-mass progenitor (cf. Corradi & Schwarz CS95 (1995)), but assuming that the star at its centre belongs to the system, its relative brightness and spectral type (F0) do not match those of an aged post-AGB nucleus. In the case of He~2-428, the central star is hidden within a compact gaseous envelope, partly neutral with very high densities ( cm-3 in the Ca ii emitting region) and partly ionized with lower but still notable densities ( from to cm-3, see Sect. 4.2). The presence of this dense circumstellar envelope is clearly inconsistent with a post-AGB star 104 yrs after the ejection of the PN.
It has been proposed that the nuclei of proto-PNe and young PNe with anomalous spectral types, unable to produce the ionization observed in their nebulae, are rapidly evolving single stars that experience rapid increases of their temperature (up to a level at which the surrounding nebula gets ionized) following sporadic post-AGB mass loss episodes (see e.g. Bobrowsky et al. bob98 (1998)). However, this cannot be the case for A~79 or He~2-428 because this scenario is expected to apply to the early phases of the post-AGB evolution, whereas these objects have quite old nebulae.
The simplest explanation of these observations is then that the central stars of both He~2-428 and A~79 are binaries. In the former, the nebular core would be produced by mass transfer effects in an interacting binary system, leading to the formation of a dense circumbinary nebula and possibly an accretion disc (e.g. Morris mor87 (1987), Soker & Rappaport sok01 (2001)). In fact, He~2-428 might be similar to the symbiotic binaries R~Aqr and V417~Cen (Solf & Ulrich So85 (1985), van Winckel et al. van94 (1994)), which in addition of having a dense circumbinary core do also have bipolar/ring nebulae as He~2-428 (the similarity with the nebula of V417~Cen is especially striking). This would imply the presence in He~2-428 of a cool star with a strong wind, which could explain the red excess found in the spectrum (see Sect. 4.2).
As for A~79, the absence of nebular emission from the core suggests that no strong winds and mass transfer/exchange between the two stellar components are now present (this is expected for a system composed of an F star plus an aged post-AGB companion providing the ionization of the nebula). A similar case might be NGC~2346, which is known to have a binary central star (Feibelman & Aller fei83 (1983)). Note that the presence of a binary system would also offer a natural explanation for the collimation of the large bipolar nebulae of He~2-428 and A~79 (Soker & Rappaport sok01 (2001)).
We have no constraints on the age of the nebula in M~1-91 and we cannot therefore exclude that it is very young and fits the single-star scenario above. However, the properties of its sibling M~2-9 also point to the presence of a binary system to produce the variety of its outflows (Doyle et al. doy00 (2000); Livio & Soker liv01 (2001)). The similarity between M~1-91 and M~2-9 is not limited to the overall morphology. The available distances for M~1-91, of 7.0 or 7.8 kpc (Acker et al. ack92 (1992)), imply a height over the Galactic plane pc, to be compared with pc for M~2-9 and a mean pc for a sample of 35 bipolar PNe (Corradi & Schwarz CS95 (1995)). The chemical compositions of M~1-91 and M~2-9 are also similar, both at the lower limit or below the abundance range spanned by other bipolar PNe, as can be seen in Table 8, where the abundances shown for M~2-9 have been derived from the line intensities given by Barker (bar78 (1978)) and the same atomic data and ionization correction factors used for the other objects (see also Corradi & Schwarz 1995).
Finally, note that the departure from axisymmetry observed in the lobes of He~2-428 and A~79 (see Fig. 1), as well as in the symbiotic nebula V417~Cen (van Winckel et al. van94 (1994)), are all very similar to each other. This suggests that the asymmetry is not just due to irregular mass loss (e.g. caused by local mass loss events on the progenitor surface). A binary system (especially with an eccentric orbit) would also offer an explanation for the formation of such asymmetries (Soker & Rappaport sok01 (2001)).
8 Summary and conclusions
We have presented a spectroscopical study of the bipolar PNe A~79, He~2-428 and M~1-91, with the following results:
-
•
He~2-428 and M~1-91 have high density (from to cm-3) unresolved nebular cores that indicate that strong mass loss/exchange phenomena are occurring close to their central stars;
-
•
an additional region with densities larger than cm-3 is revealed in the core of He~2-428 by the presence of the Ca ii infrared triplet in emission, possibly originating in an (accretion?) disk;
-
•
an F0 star is found at the symmetry centre of the nebula of A~79. Its reddening and distance are consistent with the star being physically associated with the system, but radial velocity measurements of the stellar features would be needed to confirm this association;
-
•
the continuum emission and the absorption lines in the core of He~2-428 can be reproduced with a hot star and an additional continuum component, which is probably due to a late-type stellar companion;
-
•
while A~79 is overabundant in and , He~2-428 and M~1-91 have abundance ratios one order of magnitude lower, but still within the range spanned by bipolar PNe;
-
•
He~2-428 shows rather low abundances of all elements relative to (excluding ), which suggests that it has arisen from a low-mass progenitor. This conclusion is strengthened by the absence of 2 emission in the nebula (Guerrero et al. gue00 (2000));
-
•
the nebulae of A~79 and He~2-428 are composed of tilted equatorial rings expanding at a velocity of 15 km s-1, from which faint and irregular lobes depart. The nebulae are evolved, with ages 104 yrs.
The associations of these old nebulae with a dense nebular core (He~2-428) or with a central star with F0 spectral type (A~79) are interpreted as evidence for the binarity of their nuclei. In the literature, another dozen of bipolar PNe are known to possess very dense nebular cores or central stars with anomalous spectral types (see Corradi cor95 (1995)). They provide prime targets for future observational studies, by means of radial velocity monitoring or IR and UV imaging and photometric searches for companions, aimed at testing the idea that all bipolar PNe contain binary systems.
Acknowledgements.
We thank M. Guerrero for taking the INT spectra of He 2-428 and M 1-91 during service time. We also thank D. Mayya for revising the English text and D. Mayya, J. Mikolajewska and D. Pollacco for useful comments and discussions. We thank the referee, R. Tylenda, for his suggestions, which have helped to improve this paper. This research has made use of NASA’s Astrophysics Data System Bibliographic Services and the SIMBAD database, operated at CDS, Strasbourg, France. A grant of the Spanish DGES PB97–1435–C02–01 provided partial support for this work.References
- (1) Acker, A., Ochsenbein, F., Stenholm, B., Tylenda, R., Marcout, J., & Schohn, C. 1992, ‘Strasbourg - ESO Catalogue of Galactic Planetary Nebulae’, Garching: European Southern Observatory
- (2) Balick, B. 1987, AJ, 94, 671
- (3) Barker, T. 1978, ApJ, 219, 914
- (4) Bautista, M. A., & Pradhan, A. K. 1996, A&AS, 115, 551
- (5) Benjamin, R. A., Skillman, E. D., & Smits, D. P. 1999, ApJ, 514, 307
- (6) Blöcker, T. 1995, A&A, 297, 727
- (7) Bobrowsky, M., Sahu, K. C., Parthasarathy, M., & Garcia-Lario, P. 1998, Nature 392, 469
- (8) Calvet, N., & Cohen, M. 1978, MNRAS, 182, 687
- (9) Cardelli, J. A., Clayton, G. C., & Mathis, J. S. 1989, ApJ, 345, 245
- (10) Chevalier, R. A., & Luo, D. 1994, ApJ, 421, 225
- (11) Cieslinski, D., Steiner, J. E., Elizalde, F., & Pereira, M. G. 1997, A&AS, 124, 57
- (12) Corradi, R. L. M. 1995, MNRAS, 276, 521
- (13) Corradi, R. L. M., & Schwarz, H. E. 1993, A&A, 269, 462
- (14) Corradi, R. L. M., & Schwarz, H. E. 1995, A&A, 293, 871
- (15) Costa, R. D. D., Chiappini, C., Maciel, W. J., & Freitas Pacheco, J. A. de, 1996, A&AS, 116, 249
- (16) Doyle, S., Balick, B., Corradi, R. L. M., & Schwarz, H. E. 2000, AJ, 119, 1339
- (17) Drake, S. A., & Ulrich, R. K. 1980, ApJS, 42, 351
- (18) Esteban, C., Peimbert, M., Torres-Peimbert, S., García-Rojas, J., & Rodríguez, M. 1999, ApJS, 120, 113
- (19) Feibelman, W. A., & Aller, L. H. 1983, ApJ, 270, 15
- (20) Ferland, G. J, & Persson, S. E. 1989, ApJ, 347, 656
- (21) Froese Fischer, C., & Rubin, R. H. 1998, J. Phys. B: At. Mol. Opt. Phys., 31, 1657
- (22) García-Lario, P., Riera, A., & Manchado, A. 1999, ApJ, 526, 854
- (23) Garstang, R. H. 1978, MNRAS, 118, 572
- (24) Goodrich, R. W. 1991, ApJ, 366, 163
- (25) Guerrero, M. A., Villaver, E., Manchado, A., García-Lario, P., & Prada, F. 2000, ApJS, 127, 125
- (26) Hamann, F., DePoy, D. L., Johansson, S., & Elias, J. 1994, ApJ, 422, 626
- (27) Howard, J. W., Henry, R. B. C., & McCartney, S. 1997, MNRAS, 284, 465
- (28) Hyung, S., Aller, L. H., & Feibelman, W. A. 1994, ApJS, 93, 465
- (29) Icke, V., Preston, H. L., & Balick, B. 1989, AJ, 97, 462
- (30) Jacoby, G. H., Hunter, D. A., & Christian, C. A. 1984, ApJS, 56, 257
- (31) Jenniskens, P. 1994, A&A, 284, 227
- (32) Kastner, J. H., Soker, N., & Rappaport, S. 2000, Editors of the book ‘Asymmetrical planetary nebulae II: from origins to microstructures’, ASP Conference Series, Vol. 199
- (33) Kingsburgh, R. L., & Barlow, M. J. 1994, MNRAS, 271, 257
- (34) Livio, M, & Soker, N. 2001, ApJ, 552, 685
- (35) Maciel, W. J., Freitas Pacheco, J. A. de, & Codina-Landaberry, S. J. 1990, A&A, 239, 301
- (36) Magnan, C., & de Laverny, P. 1997, MNRAS, 286, 920
- (37) McKenna, F. C., Keenan, F. P., Hambly, N. C., et al. 1997, ApJ, 109, 225
- (38) Moore, C. E. 1945, A Multiplet Table of Astrophysical Interest (rev. ed). Princeton: Princeton Univ. Obs.
- (39) Morris, M. 1987, PASP, 99, 115
- (40) Osterbrock, D. E. 1989, Astrophysics of Gaseous Nebulae and Active Galactic Nuclei. Mill Valley: Univ. Science Books
- (41) Osterbrock, D. E., Tran, H. D., & Veilleux, S. 1992, ApJ, 389, 305
- (42) Peimbert, M. 1978, in Planetary nebulae, Y. Terzian ed., IAU Symp. 76, Reidel, Dordrecht, p. 215
- (43) Perinotto, M., & Corradi, R. L. M. 1998, A&A, 332, 721
- (44) Persson, S. E. 1988a, PASP, 100, 710
- (45) Persson, S. E. 1988b, ApJ, 330, 751
- (46) Phillips, J. P. 2001, MNRAS, in press
- (47) Pottasch, S. R., Beintema, D. A., & Feibelman, W. A. 2000, A&A, 363, 767
- (48) Quinet, P. 1996, A&AS, 116, 573
- (49) Rauch, T. 1999, A&AS, 135, 487
- (50) Rodríguez, M. 1999, A&A, 351, 1075
- (51) Sahai, R. 2000, in Asymmetrical planetary nebulae II: from origins to microstructures, J. H. Kastner, N. Soker, & S. Rappaport eds., ASP Conference Series, Vol. 199, p. 209
- (52) Schimdt-Kaler, Th. 1982, Numerical Data and Functional Relationships in Science and Technology/Landolt-Boörstein, Springer Verlag, Berlin-Heidelberg
- (53) Solf, J., & Ulrich, H. 1985, A&A, 148, 274
- (54) Soker, N., & Rappaport, S. 2000, ApJ, 538, 241
- (55) Soker, N., & Rappaport, S. 2001, ApJ, in press
- (56) Storey, P. J., & Hummer, D. G. 1995, MNRAS, 272, 41
- (57) Swings, J. P. 1973, A&A, 26, 443
- (58) van Winckel, H., Schwarz, H. E., Duerbeck, H. W., & Fuhrmann, B. 1994, A&A, 285, 241
- (59) Zhang, C. Y. 1995, ApJS, 98, 659
- (60) Zhang, H. L. 1996, A&AS, 119, 523
- (61) Zhang, H. L., & Pradhan, A. K. 1997, A&AS, 126, 373
- (62) Zuckerman, B., & Gatley, I. 1988, ApJ, 324, 501