Abstract
Spectra of early-type stars in the disk of the Milky Way recorded by FUSE reveal absorption features from interstellar O VI, a tracer of collisionally ionized gases at temperatures near 300,000 K. (Hotter material is better sensed by its diffuse x-ray emission.) The FUSE survey indicates that hot gas in the plane of the Galaxy yields an average density , a value consistent with earlier results from the Copernicus satellite, but at great distances there is a large dispersion in the measurements from one line of sight to another. This dispersion indicates that O VI absorbing regions probably have a broad distribution of sizes, perhaps giving a power-law behavior for column densities. Comparisons of O VI with other Li-like ions should give some guidance on the nature and origin of the O VI-absorbing regions, but poor correspondences in the velocity profile shapes will complicate the interpretations.
The Hot Phase in the Galactic Disk
1Princeton University Observatory, Princeton, NJ 08544-1001, USA
2Dept. of Physics & Astronomy, Johns Hopkins University,
Baltimore, MD 21218-2686, USA
1 Principal Ways to Detect Hot Gas
An important achievement of space astronomy has been the discovery of a hot phase of the interstellar medium, confirming an early prediction by Spitzer [1] that this phase may be pervasive – a conclusion based on the need to explain the confinement of cool clouds in the Galactic halo. We now know that highly ionized gases spanning the temperature range from to K are indeed an important constituent of the ISM, in both the plane and halo of the Galaxy.
There are three fundamental ways to detect this hot gas:
-
1.
Absorption by highly ionized atoms in the UV spectra of background sources (stars for Galactic disk gas, quasars or AGN for the Galactic halo or IGM)
-
2.
Emision of soft x-rays over broad energy bands, with the radiation coming from collisionally excited levels, free-free emission, or recombination
-
3.
Emission of discrete UV lines from collisionally excited levels
Most of the findings on the hot phase have come from the phenomena 1 and 2 above; item 3 in this list is technically difficult to observe, and so far the results have been rather primitive and limited in scope.
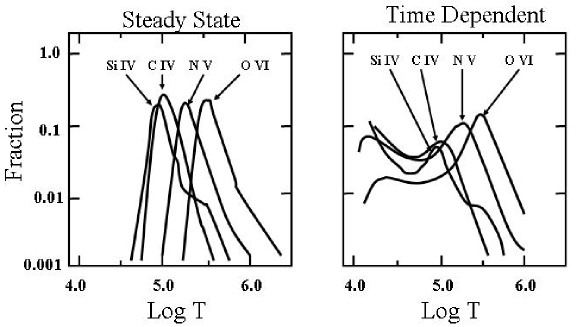
The ions Si IV, C IV, N V and O VI have strong transitions from their ground states in the ultraviolet, and they are the most suitable species for revealing the presence of hot gas through their absorption features. Figure 1 shows the abundances of these ions relative to the total abundances of the respective elements for different plasma temperatures [2]. In collisional ionization equilibrium, the ion fraction peaks are well confined to narrow temperature ranges (left-hand panel of the figure). For gas that is cooling radiatively, the cooling time is shorter than the recombination times and thus the ion fraction peaks are strung out toward lower temperatures (right-hand panel). This property, plus the chance that photoionizing fluxes near hot stars could produce measurable amounts of Si IV and C IV [3], indicates that the presence of these species does not unequivocally indicate the existence of gas with K.
The most useful ion to observe is O VI, which has a strong resonance doublet at 1031.9, 1037.6. The ionization potential of is 114 eV, which is more energetic than most of the photons emitted by the hottest stars, except for hydrogen-rich white dwarfs [4]. Thus, under most circumstances O VI is unlikely to arise from photoionization.
Observations of O VI and the soft x-ray background have provided our most detailed look at the character of the hot gas and its distribution in space. By chance, these two research industries started simultaneously. As reported in a single issue of ApJ Letters in 1974, investigators of the soft x-ray background [5] and UV astronomers [6,7] independently arrived at the conclusion that their respective results supported the existence of a significant hot phase for the ISM in the Galactic disk. Several years later Jenkins [8] published his survey of O VI absorption toward 72 stars at distances up to about 2 kpc from the Sun. A detailed map of the x-ray sky at several energies has now emerged from an extensive survey of diffuse emission using Rosat [9]. The O VI and x-ray samples sense the hot gas in very different ways (as outlined in Table 1 below), so the two efforts complement each other. A sensitive spectrograph on the ORFEUS mission extended our reach for detecting O VI absorption to stars in the Galactic halo [10,11], and this research was followed up by a more extensive survey of the halo using FUSE [12] (see also an article by Savage et al. in this volume). In the pre-FUSE era, the only report on UV line emission from hot gas (outside of supernova remnants) came from Martin & Bowyer [13] (for recent FUSE results, see the article by Shelton in this volume).
| Table 1. General Properties, Strengths/Weaknesses of Different Observations | ||
|---|---|---|
| Soft x-ray emission | O VI absorption | |
| Quantity measured | ||
| Characteristic | ||
| temperatures | ||
| Effect of (low | Energy-dependent | Target’s overall UV |
| temperature) ISM | attenuation by | brightness attenuated by |
| foreground or | dust, otherwise no effect | |
| interspersed gas | ||
| Available sampling | Map whole sky, path | Only sample toward stars, |
| length indefinite | path length definite (except | |
| for extragalactic targets) | ||
| Radial velocities | Not measurable | Can measure |
| and their dispersion | centroids and widths | |
2 A New Survey of O VI in the Galactic Disk
Even though the results summarized above gave important insights on the hot gas, nagging problems remained. The x-ray observers arrived at the conclusion that the Sun is immersed in a large volume, extending out to about 100 pc, containing mostly hot gas. How much are the conclusions about the general nature of the gas from the early O VI survey skewed by this ever-present contribution [14]? Does the average density of O VI change if we look to greater distances? To answer these (and other) questions, the FUSE team undertook a survey of about 150 stars in the Galactic plane. Preliminary conclusions from this new survey will follow.
The interstellar medium is heated by interstellar shocks. In a region behind a shock front, before the gas has had a chance to cool, the temperature is given by the formula
| (1) |
where is the shock velocity in units of ( is the mean particle mass and is the Boltzmann constant). We recall from Fig. 1 that O VI reaches its maximum concentration at , hence a shock having a velocity of order is needed to heat the gas to a sufficient temperature to produce O VI. The FUSE observation of HD 75309 behind the Vela supernova remnant shows a very strong O VI feature at about (with a plausible projection factor, this could well represent a shock with ), and evidence for high velocity O VI has been seen toward Vela in an earlier study using Copernicus [15]. However, for other directions in the sky, the O VI features are within a few tens of of either the local standard of rest or the expected velocity of the medium near the target star. A typical width of such a feature is about (FWHM, after correcting for instrumental smearing), which is not much larger than the expected thermal Doppler broadening width (FWHM) of at K. Thus, any explanation for the origin of the O VI material must acknowledge the fact that the gas has somehow been stabilized in some fashion, or that what we see is a secondary phenomenon that is kinematically coupled to the low-temperature ISM.
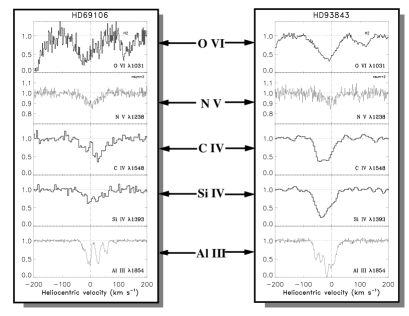
It is possible that most of the hot gas in the disk of the Galaxy is not visible in O VI, either because it is too hot (i.e., K) or has such a large velocity dispersion that the O VI absorption is not recognizable because the features are lost in the undulating continuum of the target star. This may explain why there seems to be not enough O VI compared to the soft x-ray emission, unless the filling factor of the hot gas is extraordinarily small and the thermal pressures large [16] (recall from Table 1 that , x-rays ). Perhaps the O VI profiles arise from conductive interfaces between cool clouds and a much hotter medium [17] or in turbulent mixing layers on the surfaces of clouds that are moving with respect to their surroundings [18]. One way to resolve the question is to compare O VI to the other highly ionized species (see Fig. 1) and then determine which of the theoretical models show the best consistency with the observations [19]. Unfortunately, this might not be such an easy task because the velocity profiles of the different species do not match each other very well, as is demonstrated for two cases in Fig. 2. This nonconformity indicates that simple comparisons of total column densities for different ions will not be appropriate.

We turn next to the information conveyed by the column densities of O VI and the respective distances to the targets. An important theme in the interpretation of the Copernicus survey by Jenkins [20] was that if O VI clouds were of uniform size and distributed at random, their number per unit volume could be estimated by the magnitudes of fluctuations in the O VI column per unit distance caused by chance encounters. An important test of that picture is to see if the relative magnitudes of these fluctuations decrease at greater distances. The points in Fig. 3 indicate that this is not happening. We are forced to discredit the idea that the O VI-bearing regions consist of uniform packets – instead there is probably a broad power-law type distribution in sizes. As we go to greater distances, very large O VI regions begin to enter the picture and cause fluctuations that start to overwhelm the effects of smaller regions seen over short distances.
Finally, we address the question about the overall filling factor of the O VI regions. Over a particular sight-line distance , random interceptions of O VI regions occupying a relative volume is equivalent to viewing a single region of thickness . The thermal pressure of that region (divided by the Boltzmann constant ) is given by
| (2) |
where we adopt reasonable numbers for the last four terms: the ion fraction (but it could be larger if is very different from K), the ratio of hydrogen to oxygen equals the cosmic abundance ratio 3100, and the ratio of all particles to protons . If we adopt the median value (see Fig. 3) and solve for in Eq. 2, we obtain if K and K.
Acknowledgements. The new O VI results were obtained for the Guaranteed Time Team by the NASA-CNES FUSE mission operated by Johns Hopkins University. Financial support to US participants has been provided by NASA contract NAS5-32985 and support for writing this paper came from Contract 2440-60014 to Princeton University.
References
- [1] Spitzer, L. 1956, ApJ 124, 20
- [2] Shapiro, P. R., & Moore, R. T. 1976, ApJ 207, 460
- [3] Cowie, L. L., Taylor, W., & York, D. G. 1981, ApJ 248, 528
- [4] Dupree, A. K., & Raymond, J. C. 1983, ApJ 275, L71
- [5] Williamson, F. O., Sanders, W. T., Kraushaar, W. L., McCammon, D., Borken, R., & Bunner, A. N. 1974, ApJ 193, L133
- [6] Jenkins, E. B., & Meloy, D. A. 1974, ApJ 193, L121
- [7] York, D. G. 1974, ApJ 193, L127
- [8] Jenkins, E. B. 1978, ApJ 219, 845
- [9] Snowden, S. L., Egger, R., Freyberg, M. J., McCammon, D., Plucinsky, P. P., Sanders, W. T., Schmitt, J. H. M. M., Trümper, J., & Voges, W. 1997, ApJ 485, 125
- [10] Hurwitz, M., Bowyer, S., Kudritzki, R. P., & Lennon, D. J. 1995, ApJ 450, 149
- [11] Hurwitz, M., & Bowyer, S. 1996, ApJ 465, 296
- [12] Savage, B. D., Sembach, K. R., Jenkins, E. B., Shull, J. M., York, D. G., Sonneborn, G., Moos, H. W., Friedman, S. D., Green, J. C., Oegerle, W. R., Blair, W. P., Kruk, J. W., & Murphy, E. M. 2000, ApJ 538, L27
- [13] Martin, C., & Bowyer, S. 1990, ApJ 350, 242
- [14] Shelton, R. L., & Cox, D. P. 1994, ApJ 434, 599
- [15] Jenkins, E. B., Silk, J., & Wallerstein, G. 1976, ApJ Suppl. 32, 681
- [16] Shapiro, P. R., & Field, G. B. 1976, ApJ 205, 762
- [17] Cowie, L. L., Jenkins, E. B., Songaila, A., & York, D. G. 1979, ApJ 232, 467
- [18] Slavin, J. D., Shull, J. M., & Begelman, M. C. 1993, ApJ 407, 83
- [19] Spitzer, L. 1996, ApJ 458, L29
- [20] Jenkins, E. B. 1978, ApJ 220, 107