Abstract
It is generally recognized that the interstellar medium has a vast range of densities and temperatures. While these two properties are usually anticorrelated with each other, there are nevertheless variations in their product, , the thermal gas pressure (divided by the Boltzmann constant ). A study of these variations and their kinematical relationships can help to mold our concepts of interstellar gas dynamics and give us insights on secondary effects that might arise from turbulence.
In neutral gas, the relative populations of neutral carbon atoms in the excited fine-structure states can give a direct measure of a local thermal pressure. A picture of the distribution function for thermal pressures in H I regions is now arising from a survey of interstellar C I absorption features in the UV spectra of 21 early-type stars, observed with a wavelength resolving power of 200,000 by the STIS instrument on the Hubble Space Telescope. Most of the gas is within the range K, but there is also evidence for some of the material being at much higher pressures, i.e., K. While the fraction of gas at these elevated pressures is quite small, it seems nearly ubiquitous. This phenomenon may arise from small-scale, short-lived density enhancements that are produced by converging flows of material in supersonic turbulence.
The Distribution of Thermal Pressures
in the Interstellar Medium
1Princeton University Observatory, Princeton, NJ 08544-1001, USA
1 Background
Constituents of the interstellar medium are viewed in projection, and thus we measure the integral of a density (or square of the density) along a finite path, or one of indefinite length, depending on the character of the observation. To obtain explicit indications of local particle densities in individual regions, we must examine ratios of certain constituents, such as the ionized and neutral forms of atoms, H2 rotational populations, and atomic excited fine-structure excitations. We concentrate here on the last of these three diagnostics. To study fine-structure level populations, one must observe absorption lines in the ultraviolet. The best prospects are from transitions arising from the singly-charged ions of N, Si and C or the neutral forms of O and C. (For a comprehensive bibliography on collision rate constants, see [1]). C I is a good probe of conditions in H I regions, and it is relatively easy to excite by collisions. However since carbon is mostly singly ionized, its neutral form emphasizes regions where either the photo-ionization rate is reduced or electron densities are high.
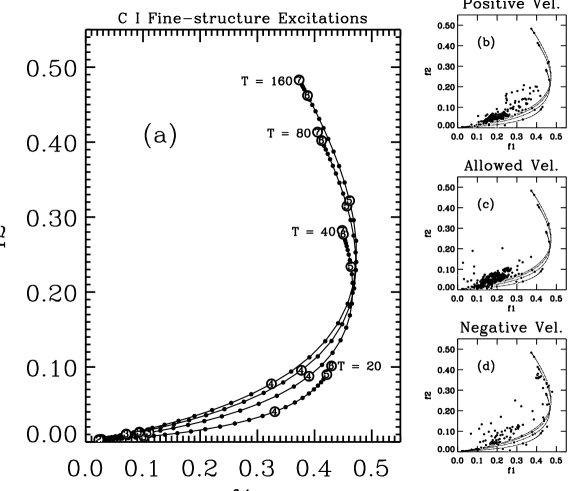
The ground electronic state of C I is split into three levels, a zero-energy fine-structure level, , and two excited levels, and with thermal excitation energies K and 62.4 K. Following a usual convention, we refer to C I in these states as C I, C I∗, and C I∗∗, respectively. A good way to express the observed population ratios is through two terms, and , where . These quantities have the useful property that any superposition of contributions from different regions, ones that are not resolved by shifts in Doppler velocity, create a net combination of and that is at the C I-weighted “center of mass” of points that could be attributed to individual regions in a diagram of vs. . This is an important property of this representation that we will use later in this paper. The tracks of and for homogeneous (pure atomic hydrogen) regions at selected temperatures and varying thermal pressures, , is shown in panel of Fig. 1.
2 High-resolution survey of C I using STIS
To study in detail the absorption features of C I, we observed 21 early-type stars with the Space Telescope Imaging Spectrograph (STIS) on HST. The E140H grating and a very narrow entrance slit (0.03 arc-sec wide) allowed us to obtain the highest resolution possible ( or ) [2]. To maximize our observing efficiency, we selected mostly stars within the Continuous Viewing Zone (CVZ) of HST, and this meant that most of our stars in the Galactic plane had longitudes clustered near or 300o.
Considering the fact that nearly all lines of sight have multiple velocity components spread over tens of , absorption features from each transition within a multiplet usually overlap each other. To unravel these confusing blends, we took advantage of the fact that different multiplets have different arrangements of lines, so by observing many of them we could solve for the unique column density vs. velocity profiles for C I, C I∗, and C I∗∗ that gave the best agreement with the observations. We accomplished this by defining a system of 300 simultaneous linear equations (for the apparent optical depths of three species for 100 velocity channels) that would solve for the minimum over 9 different multiplets.
The results of the survey are shown in the small panels of Fig. 1. Each dot in one of the panels represents of C I. The outcomes are segregated according to where the radial velocity is in relation to an expected “allowed” velocity range spanned by and the computed velocity for differential Galactic rotation at the position of the target star. Results obtained above and below this range represent gas with peculiar motions, while gas within the range represents mostly quiescent material (and some disturbed material moving transverse to the line of sight). Differences in the distributions of the dots over the different panels clearly indicate the importance of kinematics for the distributions of and . In particular, nearly all of the points with (representing K) arise from gas outside the allowed velocity bin. The points in panel (d) representing K (with ) all come from an isolated, negative velocity component in front of Cep and probably represent gas compressed by the stellar wind from the star (and possibly others in its association).
It is important to note that most of the C I measurements do not fall on the tracks, but rather just above them. Adopting the “center of mass” interpretation discussed earlier, we explain this outcome in terms of the low pressure gas (in the range K) being accompanied nearly always by a small amount of much higher pressure material at K. This seems to happen for all three categories of velocity. In the absence of this small high-pressure contribution, we obtained the fractions at different pressures given in Table 1. The median thermal pressure for the entire sample was K for K.
| Table 1. Distribution of Pressures | ||||
|---|---|---|---|---|
| K) | ||||
| C I fraction | 0.028 | 0.650 | 0.285 | 0.037 |
3 Possible Origins for the Very High Pressure Gas
There is considerable evidence that supports the existence of gas concentrations that have small angular scales (see the article by Lauroesch, this volume). Heiles [3] argues that these structures are cold and probably represent sheets of gas seen edge-on. However, the position of the track shown in Fig. 1 indicates that low-temperature gas cannot be responsible for raising the points above the tracks. Instead, the high-pressure material has K. One possible origin is the existence of thin, compressed zones at the outer edges of clouds that are moving through an intercloud medium. These zones might be pressurized by the Bernoulli effect and heated by the dissipation of waves arising from the Kelvin-Helmholtz instabilities, and they might explain the production of CH+ in the interstellar medium [4].
Over recent years, there has been substantial activity in modeling interstellar turbulence and its influences on the physical state of the medium [5]. In a medium dominated by supersonic turbulence, the small amounts of high-pressure C I could arise from short-lived sheets of gas compressed by the inertial forces of colliding gas flows. We argue that the time scales for this compression must be much shorter than the time the gas could reach thermal equilibrium by various radiative processes, otherwise it would cool too much. Put differently, the barytropic index must be intermediate between 0.72 for thermal equilibrium [6] and for adiabatic compression. This could happen if the compressed zones had characteristic thicknesses pc. The compression time scales are about 4 orders of magnitude shorter than the time needed to form appreciable amounts of H2, thereby alleviating objections stated by Heiles [3] on the overproduction of molecules.
Acknowledgements. This research was supported by NASA Grant NAS5-30110 to Princeton University and is based on observations with the NASA/ESA Hubble Space Telescope obtained at the Space Telescope Science Institute, which is operated by the Association of Universities for Research in Astronomy, Incorporated, under NASA contract NAS5-26555. A detailed presentation of this research appears in [2].
References
- [1] Keenan, F. P. 1993, in UV and X-ray Spectroscopy of Laboratory and Astrophysical Plasmas, ed. E. H. Silver & S. M. Kahn (Cambridge: Cambridge U. Press), p. 44
- [2] Jenkins, E. B., & Tripp, T. M. 2001, astro-ph/0107177; to appear later in ApJS
- [3] Heiles, C. 1997, ApJ 481, 193
- [4] Nguyen, T. K., Hartquist, T. W., & Williams, D. A. 2001, A&A 366, 662
- [5] Franco, J., & Carramiñana, A. 1999, Interstellar Turbulence (Cambridge: Cambridge U. Press)
- [6] Wolfire, M. G., Hollenbach, D., McKee, C. F., Tielens, A. G. G. M., & Bakes, E. L. O. 1995, ApJ 443, 152