Population Synthesis in the Blue I. Synthesis of the Integrated Spectrum of 47 Tucanae from its Color-Magnitude Diagram
Abstract
We perform an empirical synthesis of the blue integrated spectrum of the metal-rich globular cluster 47 Tucanae, based directly on the color-magnitude diagram of the cluster coupled to a moderately high-resolution spectral library. Freed from any significant dependence on theory, we are able to perform a fundamental test of the adequacy of the spectral library and its associated stellar parameters. Excellent fits are achieved for almost all absorption-line indices studied, provided the computations are corrected for two limitations of the spectral library, namely, the lack of a representative set of metal-poor giants and the absence of CN-strong stars. The latter effect is corrected by means of spectrum synthesis from model photospheres, considering the abundance pattern of CN-strong and CN-normal stars. We also need to perform a slight correction of the metallicity of the cluster (by –0.05 dex in relation to the standard value [Fe/H]=–0.7) in order to match the metal-line index measurements in the cluster spectrum. After these relatively small adjustments, the overall spectral agreement is good. Good fits are achieved for , , , , Ca4227 and Fe4383, and only is overpredicted. Thus, ages inferred from are slightly older than the ages based on the other Balmer lines, by 3 Gyrs. The success of this exercise suggests that previous failures to synthesize the spectrum of 47 Tuc must have arisen from inadequacies in the theoretical evolutionary isochrones and/or luminosity functions. Such a possibility is considered in a companion paper.
1 Introduction
The advent of 8-10m class telescopes and high-throughput spectrographs is bringing about a boost of high quality spectroscopic data on distant galaxies. In particular, blue absorption-line spectra of galaxies with redshifts as high as 1.0 can now be obtained with moderately high resolution and S/N, with relatively low integration times. From such data it is possible to infer the luminosity-weighted ages and metallicities of the stellar populations of distant galaxies, in order to establish constraints on cosmological scenarios (see, for instance, Kelson et al. 2001). However, such analyses are crucially dependent on the availability of reliable high-resolution model integrated spectra of stellar populations in the blue and UV spectral regions.
This is the first of a series of papers in which we will present a new set of models for population synthesis in the blue/optical region. The ultimate goal of this work is to estimate luminosity-weighted ages and metal abundances of galaxies at intermediate-to-high redshifts, as part of the DEEP Survey (Koo 1998). The useful spectral region for the study of stellar populations of distant galaxies in the DEEP project is the restframe interval 3800–4500 Å. Consequently, the emphasis of this paper is on understanding the behavior of absorption-line indices in the blue. This interval represents a compromise between the green-red, which has well understood and calibrated spectral indices but is too far to the red for high- work, and the UV, which is optimal for high but still lacks comprehensive empirical spectral libraries and reliable calibrations between spectral indices and stellar parameters.
In part because of the difficulties associated with the crowding of atomic and molecular lines, the use of absorption lines in blue population synthesis work is less highly developed than the use of lines at redder wavelengths. Early work was pioneered by Rose (1985, 1994), who defined a number of line and pseudocontinuum ratios that are sensitive to age and metallicity. Only recently has the behavior of those indices as a function of age and metallicity on the basis of stellar population models been presented for the first time (Vazdekis 1999). The Lick index system (Worthey et al. 1994) technically extends to wavelengths as blue as 4100 Å. However, the indices bluer than 4500 Å have been far less explored in galaxy work than indices such as , and . The same can be said about recent extensions of the Lick system to include higher-order Balmer lines as age indicators (Jones & Worthey 1995, Worthey & Ottaviani 1997). More recently, Vazdekis & Arimoto (1999) proposed a new definition of the index which is very insensitive to metallicity, and thus considerably improves the separation between age and metallicity effects. However, it too has so far been studied in very few objects. Another important issue insufficiently addressed in the literature is the influence of CN and CH lines on the measurement of line indices in the blue, which may be very important in view of the fact that giant ellipticals may have nonsolar [C/Fe] (Trager et al. 1998). Therefore it is fair to say that our understanding of blue absorption line indices as a function of both stellar and stellar population parameters lags behind our understanding of their redder counterparts.
This paper takes a closer look at the blue region using a time-tested technique: the comparison of high-resolution model spectra with the observations of a well studied globular cluster (GC). The first test to which every population synthesis model must be submitted is comparison of its predictions to the integrated spectra and colors of GCs. We chose 47 Tucanae as the template for our study because it is among the best studied Galactic GCs, being bright and nearby and located at a high Galactic latitude where reddening is very low. It is also among the most metal-rich GCs, with [Fe/H]=–0.7 (Carretta & Gratton 1997), thus being a reasonably good match to the main characteristics of elliptical galaxies, which are the ultimate targets of our study.
Reproducing the blue integrated spectrum of 47 Tuc is also interesting in view of recent attempts to infer the cluster’s spectroscopic age. Gibson et al. (1999) employed stellar population synthesis models by Jones & Worthey (1995) to infer the spectroscopic age of the cluster on the basis of the equivalent width of . They found an exceedingly high age of more than 20 Gyrs, which is in stark disagreement with the values derived from CMD-fitting techniques (10-14 Gyrs, see Richer et al. 1996, Salaris & Weiss 1998, Liu & Chaboyer 2000). Similar results were found by Rose (1994) and Jones (1999). More recently, Vazdekis et al. (2001) showed that part of the problem is due to the fact that the theoretical isochrones adopted in previous work did not take into account important effects such as -enhancement and He-diffusion. However, even with this correction a discrepancy of 4 Gyrs is still found between their spectroscopic age and the one derived from CMD-fitting. By looking at Figures 4 and 5 of Vazdekis et al., it can be seen that, while the EW of is fitted with a 14 Gyr model, the isochrone providing the best match to the cluster’s CMD has an age of only 10 Gyrs. It has even been suggested that the problem is more general, because similar discrepancies were found by Cohen, Blakeslee & Rhyzov (1998) when comparing model predictions for with observations of other metal-rich Galactic GCs besides 47 Tuc.
In this and a companion paper (Schiavon et al. 2001, hereafter Paper II), we take a new look at the discrepancy between spectroscopic and CMD-based ages, on the basis of new models and a new approach. In this first paper, the integrated spectrum of 47 Tuc is synthesized directly from its color-magnitude diagram, without any input from theoretical isochrones. Thus we are able to isolate and study effects which are due purely to the characteristics of the spectral library. Hence real physical problems in the evolutionary tracks and isochrones are separated from limitations in the spectral library. A similar approach has been followed before by de Souza, Barbuy & dos Anjos (1993), Santos et al. (1995) and Schiavon & Barbuy (1999), for the synthesis of integrated spectra of early-type galaxies and the red integrated spectrum of a metal-rich GC in the Galactic Bulge, but it has never been applied before to the blue integrated spectrum of 47 Tuc.
Another important issue is the effect of non-solar abundance ratios on line indices. Specifically, empirical stellar libraries are generally based on observations of stars from the solar neighborhood, whose detailed abundance pattern may differ from that in other galaxies or even in Galactic GCs. This is a matter of concern, since nearly all absorption features in the integrated spectra of galaxies are due to a blend of tens of lines from elements whose nucleosynthetic histories may be very different. The problem is worse at blue wavelengths, where the crowding of atomic and molecular lines is more severe than in the red. Moreover, while the effect of non-solar abundance ratios on redder indices has been estimated on the basis of spectrum synthesis from model photospheres (Barbuy, Erdelyi-Mendes & Milone 1992, Tripicco & Bell 1995), no such study has ever been performed on blue absorption line indices.
Again, 47 Tuc is a good template to be used in a study of abundance ratio issues. It has been known for about three decades that the stars in 47 Tuc and other GCs are characterized by a bimodal distribution in abundance pattern: roughly half the stars are exceptionally N-enriched while being mildly C-depleted, as opposed to the remaining stars, with normal abundance ratios. As a result, the stars with anomalous abundance ratios have stronger CN-band strengths and weaker CH-band strengths compared to the normal cluster stars, and also to field stars of the same , luminosity and mass. There still is no unanimous explanation for this phenomenon, especially in view of the fact that the bimodality extends down to stars below the turn-off (see Cannon et al. 1998; Cohen, Behr & Briley 2001 and references therein), so that mixing cannot be responsible for the effect. Anomalous CNO abundance ratios is a very important issue for population synthesis in the blue, given that the spectral restframe interval 3800-4500 Å is plagued by thousands of lines due to CN and CH. Indeed these lines are found in close proximity to the and indices, and it is possible that they might have disturbed previous spectroscopic ages, an issue we will examine in some detail. In this paper, we study the abundance anomaly from a spectrum synthesis standpoint, by computing stellar synthetic spectra with different abundance ratios, based on modern model atmospheres and comprehensive atomic and molecular line lists (Castilho 1999). On the basis of such computations, we estimate the effect of C,N abundance variations on key line indices. The corrections derived in this paper are then applied in Paper II to computations of model spectra based on theoretical isochrones, based upon which we determine the spectroscopic age of 47 Tuc.
The paper is laid out as follows: in Section 2, we describe the spectral library employed in our models and briefly present the determination of the fundamental parameters of the library stars. In Section 3, we present a concise discussion of the behavior of important spectral indices as a function of stellar parameters. In Section 4 the procedure to compute integrated model spectra is described. In Section 5 model predictions are compared to the observations of 47 Tuc. Our conclusions are summarized in Section 6. In Appendix A we describe our synthetic spectrum computations and study the effect of C,N abundance variations on blue line indices.
2 Spectral Library
The adequacy of a spectral library for population synthesis in the blue depends importantly on spectral resolution. High resolution is needed to disentangle the contribution of different lines to the broad features observed in -smoothed integrated spectra of galaxies. This is specially relevant in the blue spectral region, which is characterized by the crowding of hundreds of thousands of lines. The spectral library that best meets our needs is the one by Jones (1999). It is relatively comprehensive, containing 624 stars with spectral types ranging between O and M, all luminosity classes and metallicities within the interval -2.5+0.3. The resolution is moderately high (1.8 Å, FWHM), and it is flux calibrated and has high S/N. A more detailed description can be found in Jones (1999) and Vazdekis (1999). The spectra were collected by Lewis Jones using the Coudé-feed spectrograph at KPNO in two wavelength intervals: 3820–4510 Å and 4780–5470 Å.
2.1 Atmospheric Parameters of Library Stars
In what follows, we provide a description of the determination of the atmospheric parameters of the stars from the library. A more complete discussion of our method and the full list of stellar parameters will be presented elsewhere (Schiavon 2002, in preparation).
The fundamental stellar parameters we need to determine for each library star are , metallicity and surface gravity (). The highest possible accuracy is required for and metallicity. The accuracy requirement on is lower because of the relatively lower influence of this parameter on stellar spectra.
Most of the stars from the Jones library have been the subject of detailed abundance analyses in the past, and their atmospheric parameters can be found in the Cayrel de Strobel et al. (1997) catalog of [Fe/H] determinations. However, the stellar parameters listed in this catalog are very heterogeneous. They were determined using a variety of methods, based on data of varying quality and employing different sets of model atmospheres. As a consequence, the different sets of stellar parameters are often in significant disagreement (see discussion in Soubiran, Katz & Cayrel 1998). Having a homogeneous set of stellar parameters is of great importance for our purposes, so we decided to determine our own set of stellar parameters for all stars in the library in a consistent fashion.
Besides homogeneity, absence of any important systematic effect in the stellar parameters is another key requirement. The best way to check for such effects is by comparing our stellar parameters with other sets and also by verifying that they are consistent with empirical color (,[Fe/H]) calibrations from the literature. Such checks are also important for deciding which is the most appropriate and consistent vs. calibration to adopt when transforming 47 Tuc’s observed CMD to the (,) plane.
The determination of the atmospheric parameters of the library stars followed different procedures for giants and dwarfs. For dwarfs, the parameters were derived from Strömgren photometry together with up-to-date calibrations from the literature. For giants, they are based on spectral line indices, whose dependence on stellar parameters were determined by ourselves. The procedures are described in the next two subsections. The stellar colors were dereddened as follows: for roughly one third of the library stars, values were taken from Neckel et al. (1980), Savage et al. (1985), Carney et al. (1994), Blackwell & Linas-Gray (1994), Alonso, Arribas & Marínez-Roger (1996) and Beers et al. (1999). For the stars lacking previous reddening determinations, these values were determined from their Galactic coordinates and parallaxes by adopting the extinction model by Arenou, Grenon & Gómez (1992), as implemented in a FORTRAN code by Hakkila et al. (1997). Arenou et al.’s extinction model was obtained by fitting smooth functions to extinctions and distances of over 40000 stars. The agreement between s so determined with the values collected from the literature is good, within 0.03 mag. Adopting another model for interstelar extinction, like the one by Chen et al. (1999), which incorporates the more recent, higher-resolution extinction maps by Schlegel, Finkbeiner & Davis (1998), results in systematic, but minor changes in the final stellar parameters of dwarf stars ( 50K in Teff and 0.03 dex in [Fe/H]). As we show in Paper II, this has a minor effect on model predictions (see Table 2 of Paper II). A more detailed discussion is deferred to a future paper (Schiavon 2002, in preparation). We also compiled s for all the library stars from the SIMBAD database, correcting them for reddening in the same way.
2.1.1 Dwarfs
Metallicities and s for the dwarfs were determined from Strömgren photometry. We chose to adopt Strömgren photometry because of the availability of such data for most of the library dwarfs, and also because reliable calibrations of Strömgren indices as functions of and [Fe/H] exist in the literature.
Effective temperatures and metallicities of the dwarf stars were estimated from their Strömgren , , and indices. For cool stars (), we adopted the color vs. temperature calibrations of Alonso, et al. (1996) and Schuster & Nissen (1989). For hotter stars, we adopted the calibrations of Smalley & Dworetsky (1993) and the standard sequence from Perry, Olsen & Crawford (1987). Strömgren photometry was available for the vast majority (90%) of our sample in the catalog of Hauck and Mermilliod (1998). These stars were used to build relations between photometric indices and spectral features selected according to their sensitivity to a given stellar parameter. The relations were then used to estimate the Strömgren indices of the remaining library stars. Surface gravities were inferred from the absolute magnitudes (all relying on Hipparcos parallaxes) and s in the classical way, adopting bolometric corrections derived from stellar s and [Fe/H]s through the calibrations of Alonso, Arribas & Marínez-Roger (1995). Masses were interpolated in the 5 Gyr isochrones of Girardi et al. (2000) for a given and metallicity.
The above procedure was applied to all dwarfs inside the range 4500 7000 K, which is the interval inside which the above calibrations are valid. For cooler and hotter stars, we selected the most recent stellar parameter determinations listed in the catalog of Cayrel de Strobel et al. (1997).
As a check on our and metallicity scales, we compare our values to determinations by Edvardsson et al. (1993) for stars in common with our library. The comparison between the two sets of s is shown in Figure 1. In this figure, the approximate of the turn-off stars in 47 Tuc is indicated. For clarity, the comparison between the two sets of s is restricted to stars with [Fe/H]–0.4, which are the ones that enter the synthesis of the integrated spectrum of 47 Tuc. We discuss the determination of stellar parameters of more metal-rich stars in our forthcoming paper (Schiavon 2002, in preparation). The agreement between the two sets of s is generally good. However, there are slight disagreements: for stars cooler than 6200 K, our s are lower by as much as 35 K, and for hotter stars they may be hotter by 60 K. The latter mismatch is hard to assess since there are only 5 stars in common with Edvardsson et al. with 6200 K. It is also less important for the purposes of this paper, given that the turn-off of 47 Tuc is located at lower s, as indicated in Figure 1. It is also important to note that no such mismatch is seen when the above comparison is done for more metal-rich stars. It is difficult to assess the reason for the differences seen for the more metal-poor stars. Like ours, Edvardsson et al.’s s are inferred from Strömgen photometry. Since our determinations rely on the latest calibrations, we do not correct our values. In fact, the effect of these uncertainties in the and metallicity scales of dwarf stars on our predicted line strengths is very small as compared with other more important effects (see discussion in Section 5.4 and in Paper II).
In Figure 2 we compare our values for [Fe/H] with those from Edvardsson et al. Except for the most metal-rich stars ([Fe/H]0), for which our values are on average lower by 0.1 dex, the two datasets compare very well. Most importantly for the purposes of this paper, the agreement is very good around the metallicity of 47 Tuc (). This is reassuring, given that the two sets of [Fe/H]s are reasonably independent, Edvardsson et al.’s values being based on classical detailed abundance analyses of high resolution spectra.
As a further check on our parameters, we display in Figure 3 the metal-poor dwarfs from the library in the plane, overlaid by the calibration from Alonso et al. (1996) for [Fe/H]=–0.7. From this figure, it can be seen that our s are in good agreement with the calibration from Alonso et al. except for K dwarfs with 0.65, where our s seem to be slightly too high (100 K). Unfortunately, there are too few K dwarfs in our library to allow for a more reliable assessment of this effect. Again, for our purposes in this work, it is important to notice that in the region of the turn-off of 47 Tuc (indicated in the figure), the agreement between our data and Alonso et al.’s calibration is satisfactory. The discrepancy in the K dwarf regime is of minor importance because these stars are responsible for a very small contribution to the blue integrated light of the cluster (see discussion in Section 5.5).
Figure 3 is of particular relevance for yet another reason: in our procedure to compute the integrated spectrum from the CMD of the cluster, we first transform the colors and absolute magnitudes coming from the CMD into and , on the basis of which the library stars that enter the synthesis are selected. Therefore, consistency demands that we adopt a calibration of for 47 Tuc that is in agreement with the s and dereddened s of the library stars. The agreement seen in Figure 3 suggests that, at least for the dwarfs, we can adopt Alonso et al.’s calibration for 47 Tuc without incurring any important inconsistency.
2.1.2 Giants
A different approach had to be followed to determine the stellar parameters of our library giants. Although accurate temperatures can be inferred from reliable calibrations of metallicity-insensitive colors such as (Alonso Arribas & Martínez-Roger 1999), it is not possible to do the same for metallicities of giant stars. For this reason, our s and metallicities for giants rely on measurements of absorption features in the spectral library and calibrations of those features against stellar parameters, built specially for our purpose. Surface gravities are estimated from isochrones, using an assumed mass and an estimated , absolute magnitude and bolometric correction.
The starting point of our method is to select stars in the library with the most reliable stellar parameter determinations from the literature. For that purpose, we culled stars from the library in common with the works of Alonso et al. (1999), Soubiran et al. (1998), Luck & Challener (1995) and McWilliam (1990). From Alonso et al. we took only s, since their [Fe/H]s come from Cayrel de Strobel et al.’s catalog. Using stars in common to these four data sets, we adjusted all s and [Fe/H]s to the scales of Soubiran et al., because they are based on a very comprehensive data set and have the most stars in common with our library. The stellar parameters in the Soubiran et al.’s work are based on determinations collected from the literature, among which those that best match their observed high-resolution spectra are selected. The average offsets applied were of the order of 70 K in and 0.1 dex in [Fe/H]. With this procedure, we were able to gather a set of 254 “template” giants with and [Fe/H] on the scales of Soubiran et al. These were the basis on which a calibration of spectral features against stellar parameters was built.
The next step was to select those spectral features that are the best indicators of and [Fe/H]. By studying the behavior of a set of Balmer and Fe line equivalent widths and line depth ratios as a function of those parameters, we finally selected and the average of the indices Fe4383, Fe5270 and Fe5335 (henceforth ) as the best pair to determine and [Fe/H]. is predominantly sensitive to , but it is also influenced by metallicity, being stronger in the spectra of more metal rich giants (cf. Figure 6 below). The dependence on metallicity is due to contamination by metal lines in the index passband. On the other hand, is strongly sensitive to both and [Fe/H].
The pseudocontinua and bandpasses used for , Fe4383, Fe5270 and Fe5335 were those given by Worthey et al. (1994). The indices were measured in the spectra of the template giants from the library, after convolving the spectra to a velocity dispersion of km s-1, in order to bring them to the same system as the observations of 47 Tuc used in this work. It is important to stress that, even though the passband definitions of Worthey et al. were adopted, our measurements are not on the Lick-IDS system since the spectra are not convolved to the much lower resolution of Lick-IDS spectra. In this way, we take full advantage of the higher resolution of our library spectra.
We performed a one-error least-squares regression to the functions [Fe/H](,) and (,,[Fe/H]). Satisfactory fits were found to polynomials of the form
| (1) |
and
| (2) |
The coefficients of the fits are listed in Table 1. One- errors in and [Fe/H] are 80 K and 0.1 dex respectively.
Surface gravities of the giants were determined in the same way as for the dwarfs, inferring absolute magnitudes from Hipparcos parallaxes, adopting 1 M⊙ for all stars, and computing bolometric corrections from the calibration by Alonso et al. (1999).
By construction, our and metallicity scales for giants are consistent with those of Soubiran et al. (1998). Thus we provide here only a comparison of our values for the metal-poor giants with the calibration by Alonso et al. (1999), keeping in mind that differences between Soubiran et al. and the works of Luck & Challener (1995) and McWilliam (1990) amount to up to 70 K and 0.1 dex in and [Fe/H] respectively. This is shown in Figure 4, where we compare library giants of –0.4 with Alonso et al.’s calibration for [Fe/H]=–0.4 (solid line). The lack of a sufficient number of giants in the library with –0.5 prevents us from making this test for lower metallicities. From this figure, it can be seen that a reasonably good agreement is achieved. However, there is a slight discrepancy in the sense that Alonso et al.’s calibration seems to provide s slightly hotter ( 50–100 K) than our values for stars bluer than 1.
It is difficult to figure out the source of the differences apparent in Figure 4. As mentioned before, the procedure we follow to synthesize the integrated spectrum of 47 Tuc from the CMD involves converting colors and absolute magnitudes into s and s. For this purpose, a vs. transformation is necessary for the dwarfs and giants separately. It is clear that we would be introducing systematic effects in our computations if we adopted Alonso et al.’s calibration for the giants, because it is inconsistent with the relation built into our spectral library. We therefore derived our own (,[Fe/H]) relation, based on our and [Fe/H]-scales and the dereddened colors of the library giants. By using this new calibration, the derived s and s for 47 Tuc stars will be fully consistent with the library and [Fe/H]-scales derived in this section. Thus, we fitted to our data a polynomial of the form
| (3) |
where =5040/. The coefficients of this polynomial fit are shown in Table 2, and the interval of its applicability is 0.81.2, –0.7+0.2. The 1- error in is 66 K. The polynomial is overlaid on the data in Figure 4 (dotted line), where it can be seen that adoption of our calibration versus Alonso et al.’s may lead to a difference of up to 100 K at =0.8. The effect of uncertainties in the and metallicity-scales on our predictions is discussed in Section 5.4 and Paper II. The paucity of hot metal-poor giants in our library limits the applicability of this relationship to 5000 K. This is not very important because the vast majority of the giants in 47 Tuc are cooler than 5000 K. For the few HB stars with 5000 K, we adopted Alonso et al.’s scale, for the corresponding interval, with a zero-point correction of 100 K in order to guarantee a smooth transition between the two calibrations around 0.8. This is shown as the short solid line in Figure 4.
2.1.3 Final parameters
The last step in our procedure was to plot the Balmer line strengths of all stars (dwarfs and giants separately) versus for different metallicities, removing from the library all stars that were very deviant from the general trends. In this way we made sure that our predictions of Balmer line intensities are free of the influence of stars with very unusual Balmer line equivalent widths for their atmospheric parameters. The final pruned library is comprised of 564 stars: 353 giants and 211 dwarfs.
Figure 5 shows the distribution of the finalized library stars in the (, [Fe/H]), (, ) and (, [Fe/H]) planes. From the plots, it can be seen that the spectral library covers large portions of the stellar parameter space well. However, even though this is among the largest of the empirical spectral libraries so far employed in stellar population synthesis, it has important limitations. In particular, the library is sparse in two regions: for dwarfs hotter than 7000 K and for metal-poor giants (–0.5). The first limitation may introduce artificial discontinuities in the behavior of line indices as a function of age, but it only affects models of stellar populations younger than 4 Gyrs (at solar metallicity) and therefore is not important for the analysis carried out in this paper. The second limitation is of great concern for this paper, since the metallicity of 47 Tuc ([Fe/H]=–0.7) is within the range where the spectral library is not very dense, particularly for giants. We come back to this issue below.
3 Line indices as a Function of Stellar Parameters
Before starting our discussion of the integrated spectrum of 47 Tuc, it is of interest to first review the dependence of absorption line indices of individual stars as a function of stellar parameters, as this will help us to better understand the behavior of our models as a function of model inputs. Definitions of the line indices studied can be found in Worthey et al. (1994) in most cases, except for , defined by Worthey & Ottaviani (1997), , defined by Worthey & Jones (1995) and , defined by Vazdekis et al. (2001).
Even though the high-resolution of both the observed spectrum of 47 Tuc and the spectral library used in our model construction allows us to explore narrow-band indices like Ca4227HR and (Worthey & Jones 1995), we will refrain from adopting them. These indices have extremely narrow passband and pseudocontinuum windows, which makes them especially sensitive to errors in -values, when computing synthetic stellar spectra. Because we adopt spectrum synthesis in order to correct our model predictions for the effect of abnormal C,N abundances in 47 Tuc stars (see Section 5.3 and the Appendix), we concentrate our discussion for the rest of this paper on wider-band indices like and Lick Ca4227, for which such corrections are far more robust. Moreover, as the ultimate goal of this work is to calibrate models to be applied to the analysis of -smoothed spectra of elliptical galaxies, it is more sensible that we concentrate our efforts on wide-band indices.
The size and breadth of our spectral library make it easy to gauge the effect of and metallicity on line index strength. The same does not apply to , however, because library dwarfs and giants are in common only within a very narrow interval. Therefore, all comments below about the dependence of line indices on are restricted to the interval 4600 5500 K.
The indices of most importance to us are plotted against in Figures 6 to 9. Dwarfs are represented by triangles and giants by circles. Metallicities are color-coded, as shown in the upper panel of Figure 6. For all indices, is the prime parameter influencing index strength. The second most important parameter is [Fe/H] in the case of and Fe4383, and in the case of and Ca4227. For and , [Fe/H] and seem to have approximately the same impact on line strength. appears to be the only index which is virtually insensitive to . We comment below on the features particular to each of these groups.
Balmer lines: all Balmer line indices are strongly sensitive to , being stronger in the spectra of hotter stars because of increasing excitation. They are also mildly sensitive to , being stronger in the spectra of giants at cool temperatures. This is because of the decrease of continuum opacity (mostly due to H-) as electron pressure decreases. Below 4000 K, increases for lower s because of the presence of a strong TiO bandhead ( 4851 Å) within the passband of the index. and undergo similar (but less drastic) upturns below 4500 K, because at low s the indices are dominated by contaminating metal lines, which get stronger for decreasing . All Balmer line indices are sensitive to [Fe/H]. Both and become stronger for higher [Fe/H] because of the presence of metal lines in the index passband. The opposite trend is seen in , for which the contamination is more important in the pseudocontinuum windows. In all cases, the effect is more important for giants than for dwarfs. Note that the dynamic range of both indices is considerably lower than that of the two other Balmer lines. This is because of the placement of the continuum passbands very close to the line core, which artificially reduces the EW when is very strong, and the inclusion of strong metal lines in the index passband, which offset the decline of at low . and behave similarly to one another as a function of stellar parameters, even though they are defined and measured in very different ways.
and Fe4383: is the average of Fe5270 and Fe5335. The behavior of the two latter indices as a function of stellar parameters is essentially the same (Tripicco & Bell 1995), so that the discussion of applies to both Fe5270 and Fe5335. All these indices are very sensitive to [Fe/H], in both giants and dwarfs: their response to [Fe/H] is almost as strong as their response to . Both indices are sensitive to gravity, being stronger for higher gravities.
and Ca4227: the -sensitivity of both indices is very similar to the Fe indices. The most outstanding feature of these indices is their strong response to . They are almost as sensitive to as they are to . The dependence on is due to the effect of gas pressure on the damping wings: the higher the surface gravity, the deeper the wings, and thus the index is stronger. Ca4227 is mildly sensitive to [Fe/H] in both giants and dwarfs. is also mildly sensitive to [Fe/H] in dwarfs, but displays a remarkable insensitivity to this parameter in the case of giants. This result is in agreement with the results of Tripicco & Bell (1995), who showed that this index is predominantly sensitive to . Unfortunately, we lack this datum for the vast majority of the library giants. This is a major shortcoming of all empirical spectral libraries. In the case of the dwarfs, the mild sensitivity to [Fe/H] can be explained by the fact that for –0.8 Fe and Mg abundances vary in lockstep in disk stars (Edvardsson et al. 1993).
4 Computing the Integrated Spectrum
This section describes our procedures to compute model integrated spectra. Two different procedures are followed: computation directly from the the cluster’s CMD (CMD-based) and those based on the theoretical isochrones (isochrone-based). The latter are the basis for our discussion in Paper II.
Figure 10 shows the CMD of 47 Tuc out to a radius of 30”, kindly provided by P. Guhathakurta (see Howell, Guhathakurta & Gilliland 2000). This CMD was obtained with the Hubble Space Telescope and is complete down to V=18.5 (1 mag below turn-off). The CMD of Figure 10 is the starting point for our CMD-based computation of the integrated spectrum of the cluster.
The computations can take at least two different routes: we can sum up an integrated spectrum by selecting stars in the spectral library to match each star in the CMD based on its atmospheric parameters, or we can sum up particular spectral indices, based on fits to the strengths of various spectral indiceas as a function of the stellar parameters corresponding to each point of the CMD. The two methods should yield exactly the same line index measurements. For this to occur, the fitting functions must represent correctly the variation of the spectral indices as a function of stellar parameters, and the spectral library must sample adequately all the points in the (, ) plane. Computation of the integrated spectrum is more straightforward and also yields the entire spectrum, which allows a (very helpful) visual comparison with the observations. However, it is not reliable if the relevant stars are underrepresented. Integrated spectral indices are to be preferred in that case, as fitting functions more easily extrapolate and interpolate over missing stars. In the present case, we have noted that the spectral library lacks giants that are metal-poor enough to match 47 Tuc. However we demonstrate in Section 5 that biases in the computations due to sparseness of the spectral library are not severe and can be readily corrected.
4.1 CMD-based Integrated Spectrum
As a first step, we computed a fiducial for the cluster by averaging ’s in steps of 0.05 mag in V. Blue stragglers were averaged in coarser steps of 0.2 mag. On the horizontal branch, we averaged V magnitudes in steps of 0.02 mag in . The number of stars entering the average for a given fiducial point is a key quantity for the computation of the integrated spectrum ( in Eq. 7 below). Computing the integrated spectrum from the full CMD on a star-by-star basis or from the fiducial yielded exactly the same spectrum and color. Next, we derived dereddened absolute magnitudes and colors adopting =0.04 and =13.33 (Hesser et al. 1987). The fiducial of 47 Tuc in the CMD was then transformed to the (, ) plane, adopting the following set of calibrations: for the dwarfs, we converted into adopting the calibration by Alonso et al. (1996) for [Fe/H]=–0.7. This calibration is a good match to the s and of the library dwarfs, as shown in Figure 3. Surface gravities were determined from bolometric magnitudes, masses and s, by taking the bolometric corrections given by Alonso et al. (1995) and a mass interpolated in the isochrone by Salaris and collaborators (see description below) for 11 Gyr and [Fe/H]=–0.7. For the giants, s were determined from our own calibration given in Eq.(3) for [Fe/H]=–0.7, and s were determined in the same way as for the dwarfs, adopting the bolometric corrections by Alonso et al. (1999) and a mass of 0.85 M⊙. The latter has been chosen to be consistent with the predictions of Salaris models for the metallicity and age of 47 Tuc (see Paper II). The choice of mass has a minor impact on the uncertainty of surface gravities: a 0.1 M⊙ variation in mass (which corresponds to a 4 Gyr change in age, for fixed metallicity, according to Salaris isochrones) translates into roughly a 0.05 dex change in .
The computation of the integrated spectrum proceeds as follows. At each point of the fiducial, stars from the spectral library are identified that match most closely the (, ) pair of the fiducial for a metallicity as close as possible to [Fe/H]=–0.7. This is done by first searching for stars inside a given limit tolerance on regardless of [Fe/H] or . The stars so selected are then submitted to a tolerance criterion in [Fe/H], and the surviving set is, in the end, selected for their surface gravities. In each of the iterations, if no star is found in the library inside the tolerance of each parameter, the latter is enlarged until at least one star is found which matches the desired set of parameters. If the tolerance in exceeds 100 K, the routine searches for other stars with parameters selected so that the average of the selected stars is closer to the desired value. The initial tolerance limits in , and [Fe/H] are 20 K, 0.1 dex and 0.05 dex respectively. The tolerance limit in never exceeds 250 K. In , the tolerance limits end up being more generous in regions of the CMD that are more sparsely populated by the stellar library, such as K dwarfs, subgiants and M giants. The same applies for the metallicities of K dwarfs and M giants.
The stellar spectrum for the point of the fiducial is given by
| (4) |
where is the number of library stars selected per fiducial point, is the spectrum of the star and is the distance between the star and the fiducial point in stellar parameter space, given by:
| (5) |
The quantity is a normalization factor given by
| (6) |
As a check on the final parameters for each fiducial point, we show in Figure 11 a comparison between the actual fiducial parameters and the average parameters of the library stars adopted at each point. From this figure, it can be seen that the final average s are in close correspondence with the s required by the fiducials. In and [Fe/H], because of the limitations of the library just discussed, more important differences, of the order of 0.5 dex are found. However, this is not critical in most cases, first because is the leading parameter in shaping the stellar spectrum, and second, because the discrepancies in and [Fe/H] occur in areas of the CMD with very low contribution to the integrated light (see discussion in Section 5.5). The most important discrepancy is in fact of smaller size, namely, that most of the fiducial points of giants with s between 4000 and 5200 K are represented by stars with –0.6, rather than –0.7. This slight mismatch is due to the paucity of metal-poor giants in the library, which forces our routine to adopt higher-metallicity stars along the giant branch. The impact of this effect on our computations will be discussed in Section 5.1.
The next step in the procedure is to add up the spectra along the fiducial so as to produce the final integrated model spectrum. The latter is given by
| (7) |
where is the number of fiducial points, is given by equations (4) and (5), and is equal to of the fiducial point in case of the blue spectra and an interpolation between and for the red region. For fiducial points brighter than the completeness limit of the CMD (), is given by
| (8) |
where is the number of stars in the fiducial point, is the total number of stars in the CMD which are brighter than the completeness limit, and is the corresponding value for a power-law IMF, integrated between masses and , which is the initial mass of the most evolved stars still visible in the cluster. The latter two mass values are taken from the isochrone of Salaris and collaborators (described below) for an age of 11 Gyrs and [Fe/H]=–0.7. Below the completeness limit, the fiducial is replaced by the isochrone of Girardi et al. (2000) for 10 Gyrs and [Fe/H]=–0.7, and is given by a power-law IMF, with exponent (where corresponds to the Salpeter IMF).
Mass segregation is extreme in the core of 47 Tuc. Howell et al. (2001) found a slope of for the stellar mass function within the cluster core radius. As our integrated spectrum samples only the inner 30 arcsec of the cluster, we adopt this severely dwarf-depleted mass function below the completeness level of our CMD. Because the stellar library does not contain enough cool dwarfs, the isochrone has to be truncated at M⊙. We adopted fitting functions to estimate the effects of including the lower part of the main sequence (down to 0.1 M⊙) in the computations. As a result, we found that line indices change by less than 1 % when stars of lower masses are considered, so that the lower main sequence can be safely neglected. The integrated remains likewise unchanged.
5 Results
The comparison of the model predictions with the observations will be presented as follows: we first compare the full CMD-based model spectrum with the observations. In the absence of any important reliance on theoretical isochrones, this test reveals any limitations of the spectral library adopted in the synthesis. We then investigate limitations of two kinds: the afore-mentioned paucity of library stars on the metal-poor giant branch, and the absence of library stars with the abnormal C,N abundance ratios that characterize half of the stars in 47 Tuc and other GCs. These effects are investigated using line indices and fitting functions. The latter requires a spectrum synthesis approach (from model photospheres), whose details are presented in the Appendix.
The observed spectra of 47 Tuc used in this work come from two different sources. An integrated spectrum was obtained in the interval 3440–4780 Å with a resolution of 2.6 Å (FWHM) at the 1.5 m telescope at CTIO (for further details, see Leonardi (2001) in preparation). The second spectrum was kindly provided by S. Covino and covers a much larger spectral region, 3690–7570 Å, but with somewhat lower S/N and resolution (3.4 Å). It was obtained with the 1.52 m telescope at ESO (see Covino, Galletti & Pasinetti 1995). Both spectra were obtained from drift scans inside the core radius of the cluster, which is 22 arcsec (Trager, Djorgovski & King 1993). Thus the spectra sample approximately the same stellar population as represented by the CMD of Figure 10, which was obtained from a region within 30 arcsec of the cluster center.
5.1 CMD-based vs. Observed Spectra: Pseudocontinuum Slope
Figure 12 shows the comparison between the integrated spectra of 47 Tuc and the CMD-based model spectra. The blue and red integrated spectra are normalized at pseudocontinua points at 4365 Å and 5358 Å respectively. The overall match is not exact. First, the model spectrum is redder than the observed one. This difference is more severe in the blue spectrum, amounting to about 9% at 400 Å from the normalization point. In the red this difference amounts to only 3% at the same distance from the normalization point. The differences are an order of magnitude larger than what can be accounted for by dereddening errors. Furthermore, the absorption lines are in general slightly too strong in the model spectra, the effect again being bigger in the blue.
We suggest that the discrepancy in the slope of the pseudocontinuum is mostly due to flux calibration uncertainties in the observed 47 Tuc spectra. In support of our suggestion, we compare in Table 3 our predictions for the observed of 47 Tuc. The observed dereddened integrated color within an aperture of 1 arcmin was taken from Chun & Freeman (1979). In this table, corresponds to the summation of the colors of all the stars in the CMD, plus the extension with the Salaris isochrone below the completeness limit, assuming a Salpeter IMF; corresponds to the integrated color obtained by summing the average color of the library stars entering the synthesis for each fiducial point. As expected, agrees perfectly with the observations. We also find that is in close agreement with the observations. The slight mismatch ( 0.1 dex) between the metallicity of the cluster and the metallicity of the giant stars employed in the synthesis (Figure 11) accounts for less than 15% of the pseudocontinuum slope differences reported above. The excellent agreement between the observed and shows that the stars employed in the synthesis have the right overall color.
Since we are able to reproduce to high accuracy the integrated color of the cluster using the colors of the library stars, and given that the flux calibration of the spectral library is said to be free from any systematic errors (see Vazdekis 1999 for a discussion), we conclude that the mismatch between the spectrophotometric observations of 47 Tuc and our model pseudocontinuum slope must be due to some error in the flux calibrations of the observed 47 Tuc spectra. If so, the error is not serious and we consider it no further.
5.2 CMD-based vs. Observed Spectra: Absorption Lines
In this section, we discuss the line indices presented in Section 3. As discussed in that section, the and indices behave in virtually the same way as a function of stellar parameters, so that the results described in this section apply to both indices. However, as discussed in Section 3, the correction to the effect of anomalous C,N abundances on , is very uncertain (see also Section 5.3 and Appendix), so that we will focus our discussion on . Moreover, the latter is very relevant to our purposes because the study of Vazdekis et al. (2001) on the spectroscopic age of 47 Tuc relies heavily on this index.
Besides the overall disagreement in pseudocontinuum slope, line indices are systematically overestimated in the model spectra. This can be seen by careful assessment of individual features in Figure 12, but can be better appraised in Figures 13 and 14, where the models and observations are compared in a number of Balmer line metal-line plots. In all these plots, the filled pentagons with the error bars represent the observed 47 Tuc indices, while the open circles represent the indices in the CMD-based model spectra. Indices were measured in model spectra, rebinned and convolved to the dispersion and resolution of the two sets of observed spectra. The measurements in both observed and model spectra are listed in Table 4. For the red observed spectrum, errorbars are taken from Covino et al. (1995), and for the blue, they are estimated from the observations by considering only the error in the wavelength scale, given the extremely high S/N of this spectrum.
The results from these comparisons can be summarized as follows:
1) and are well matched by the CMD-based model whereas the model overpredicts by more than 1 ;
2) Among the metal-line indices, is well matched by the model, is roughly matched, but Fe4383 and Ca4227 are overpredicted, especially the latter. The differences are greater in the blue indices, and this trend is confirmed by visual inspection of other lines (Figure 12).
Only three basic ingredients enter the CMD-based synthesis: an assumed metallicity for 47 Tuc, the spectral library and its stellar parameters, and the adoption of an isochrone with a Salpeter IMF to account for lower main sequence stars below the completeness limit of the input CMD. Since the faint lower main sequence stars have a negligible impact on the line index predictions, even for wide variations of the power-law IMF exponent, the first two ingredients are the key ones, and we explore them further.
In Section 4 we pointed out that the average metallicity of giants employed in the synthesis of the integrated spectrum is higher by 0.1 dex than the estimated metallicity of 47 Tuc ([Fe/H]=–0.7). This is due to the paucity of metal-poor giants in the spectral library adopted. In order to estimate the impact of this error, we calculate the effect of decreasing the average metallicity of the input giants by 0.1 dex, by using line-index fitting functions. This is a good way of estimating changes in model predictions due to fine-tuning of input parameters because fitting functions smooth over the effects of sparseness of the spectral library in certain regions of stellar parameter space. The fitting functions adopted were those of Worthey et al. (1994) for Fe4383, Ca4227, , and , Schiavon (2002, in preparation) for and , and Concannon (2001, private communication) for . We note that the fitting functions of Worthey and collaborators are built for an EW system that is different from ours, which is based on much higher-resolution spectra. For this reason, the use of those fitting functions will be kept strictly differential, in a percentage sense
Our procedure was to vary the input metallicity of giant stars by –0.1 dex and then infer the percentage change in each line index. The latter was then applied to the model predictions. The results are displayed as the dotted arrows in Figures 13 and 14. The direction of the arrows can be easily verified from the discussion in Section 3. Basically, all corrections are small. , and all metal-line indices become stronger for more metal-rich giants. Thus, correcting for the effect of too metal-rich giants in the library decreases these indices. The opposite happens to because it is the only index that becomes weaker in the spectra of more metal-rich giants. After correcting for these effects, the agreement of model predictions with observations is slightly worse in the case of and , although formal agreement for is preserved, and for the agreement is actually improved. The changes to metal lines are generally in the right direction but not large enough to remove all discrepancies.
The next possible source of error is the metallicity of 47 Tuc itself. The value adopted so far has been taken from Carretta & Gratton (1997), and it relies on a detailed abundance analysis of high resolution spectra of cluster stars. The uncertainty in [Fe/H] quoted by those authors is 0.1 dex. Thus, it is worth testing the sensitivity of our predictions to a slight decrease in the assumed [Fe/H] of 47 Tuc. The procedure in this case is a bit trickier, since the effect of the metallicity on the s (which are inferred from stellar colors) also needs to be taken into account. For a given , the inferred is slightly lower, because of the blueing effect of a lower metallicity. We infer new sets of stellar parameters from colors and absolute magnitudes by using the same calibrations as those described in Section 4, for the slightly lower metallicity [Fe/H]=–0.75. The new values are then input into the fitting functions to obtain new percentage changes in the line indices.
The results are displayed in Figures 13 and 14 in the form of solid arrows. The indices corrected for both the metallicity of the giants and 47 Tuc are listed in Table 4. For Balmer line indices, the response is stronger than in the previous test, for the solid arrows have about the same length as the dotted arrows, even though the former were computed for a change in metallicity which is only half as large. This is because the new s are lower than those obtained when assuming [Fe/H]=–0.7, for the reasons explained above. For metal-line indices, the change depends on the balance between and [Fe/H]-dependence. From these figures it can be seen that, when we combine the correction for the higher metallicity of the library giants with a putative 0.05 dex decrease in the assumed metallicity of 47 Tuc, we achieve an overall better compromise with the observations. Three of the four metal lines and two out of three Balmer lines are now in good agreement with the observations. Ca4227 is still wildly overpredicted, however, and , which formerly agreed, is now too strong, because of its dependence on metallicity, as explained above.
In summary, overall agreement between the CMD-based model and the observations is improved by correcting for the lack of metal-poor giants in the library and by assuming that 47 Tuc is a little more metal-poor than the standard value ([Fe/H]=–0.75, yet safely within the errorbar of Carreta & Gratton 1997). In the next section, we investigate a final cause for the remaining mismatches in and Ca4227, namely, the effect of the abnormal strength of CN and CH lines in the integrated spectrum of the cluster.
5.3 Spectrum Synthesis from Model Atmospheres: Assessing the Effect of CN-strong Stars on Integrated Line Indices
The 3800–4400 Å interval is filled with lines due to CN and CH. In particular, both the passbands and continuum windows of , and Ca4227 are heavily blended by many lines due to CN and CH (Castilho 1999). It is well known that about half the stars of 47 Tuc and other GCs present an unusual abundance pattern, characterized by an abnormally high nitrogen abundance and a mild carbon underabundance (Cannon et al. 1998 and references therein). The net effect is to enhance the opacity due to the CN molecule and decrease that due to CH, as compared to stars with solar abundance ratios. Our spectral library lacks stars with abundance ratios similar to the ones found in the CN-strong stars in 47 Tuc. Therefore, we resort to spectrum synthesis, based on state-of-the-art model atmospheres and a comprehensive database of atomic and molecular data, in order to investigate the origin of the discrepancies discussed in the previous sections.
Computing reliable synthetic spectra from model atmospheres of cool stars is an extremely difficult task, involving the accurate determination of hundreds of thousands of oscillator strengths, even for a relatively narrow spectral region like the one under study in this paper. In the blue, this task is even harder, given the crowding of atomic lines even in the highest resolution attainable in stellar spectroscopy. However, although we may not be able to produce a perfect absolute match to the observations, it should be possible to use the model spectra differentially, to investigate the effect of changes in abundance ratios.
We computed synthetic spectra for the atmospheric parameters of a typical giant, subgiant and turn-off star in 47 Tuc. The stellar parameters adopted were: (, ) = (4750 K, 2.50) for a red giant, (6000 K, 4.0) for a turn-off star and (5250 K, 3.0) for a subgiant. In the absence of model atmospheres computed for the exact metallicity of 47 Tuc, all spectra were computed for [Fe/H]=–0.5. Therefore, this analysis must be kept strictly differential. Here we concentrate on the main results leaving the details for the Appendix. The synthetic spectra were calculated using two different abundance patterns: one for solar chemical composition (Grevesse & Sauval, 1998), scaled to the adopted =–0.5 dex, and the other for the abundance pattern of CN-strong stars in 47 Tuc, namely, =–0.2 and =+0.8 (Cannon et al. 1998).
The spectral differences resulting from these abundance patterns are illustrated in Figure 15. In Figures 16 and 17 we display a zoom of Figure 15 in the regions of and respectively. While the CN bands at 4160 Å are stronger in the synthetic spectrum computed with a non-solar abundance pattern, the G band, at 4300 Å (due mainly to CH) is weaker. The differences are large for giants and subgiants, while for turn-off stars they are far less important. This is because CN and CH lines are much weaker at the high and characteristic of turn-off stars.
We checked whether the predicted model differences in CH and CN band intensities match those measured in spectra of stars from 47 Tuc. For that purpose, we measured the indices C(4142) and as defined respectively by Norris & Freeman (1979) and Briley et al. (1994) in the synthetic spectra of the CN-normal and CN-strong giant model. According to our computations, the CN-strong giant is stronger in C(4142) by 0.15 mag and weaker in by 0.05 mag. These variations are consistent with the differences measured among giant stars in 47 Tuc by Norris & Freeman and Briley et al.
A look at Figures 15, 16 and 17 allows a quick estimate of how the line indices should change as a function of relative CN/CH line strength. In the case of Ca4227, the index is much weaker in CN-strong stars because of the severe contamination of the blue continuum window by CN lines. The effect on Balmer lines is more subtle. is slightly weaker in the spectra of CN-strong stars because the central passband, which includes the metallic feature at 4350 Å, which is due to a blend of FeI, FeII, TiII, CrI and MgI lines, but is also strongly contaminated by CH lines, which are weaker in those stars. In the case of H, CN lines contaminate both continuum and central passbands, so that the net effect on the measured index is not large. For all indices, the effect in turn-off stars is far less important, given the relative weakness of molecular lines in their spectra.
To assess the net effect of CN-strong stars on the CMD-based model, we summed the spectra displayed in Figure 15 adopting the weights given in Table 5. In this way, we produced two integrated spectra, one comprised of only CN-normal stars, and the other comprised of a mixture of half CN-normal and half CN-strong stars. Obviously, the absolute values of such integrated spectra do not reproduce accurately the observations because by construction they do not sample the full range of atmospheric parameters characteristic of cluster stars, and also because they were computed with a metallicity slightly higher than 47 Tuc’s. However, they do provide a rough measure of the effect of CN-strong stars on the modeled indices. The synthetic spectra were then smoothed and rebinned to the same resolution and dispersion as the blue observed spectrum, and indices were measured in the same way as in the observed and previous model spectra.
The resulting corrections are shown as the arrows labeled “CN” in Figures 13 and 14. The corrected indices are listed in Table 4. To compute these, we have measured the percentage change in each index caused by CN-strong stars in the model and applied the same percentage shift as a further correction to the previous best model presented in the last section. We find that is increased by 10% when CN-strong stars are included, so that the corrected is stronger than the measured values by 0.4 Å. However, we do not put too much weight on this discrepancy, given that our synthetic spectrum seems to underpredict this line as well as a few moderately strong metal lines included in the passband of the index, at 4110–4112 Å (see Figure 18 in the Appendix). Because the total absorption inside the index passband is underestimated, the percentage change due to the variation in CN line-strength may be overestimated. Most importantly, the final correction to the line index results from a delicate balance between the corrections due to extra CN absorption both in the continuum windows and index passband. In a spectral region heavily contaminated by CN lines, both corrections (to continuum and passband) are large (see Figure 17), and the resulting correction to the line index is small, so that small errors in the line strengths of CN lines in either the continuum and passband would result in a sizably wrong final correction to the index. In particular, if the CN-line strengths in the index passband were slightly underestimated relative to CN-line strengths in the continuum windows, the present index correction would go in the wrong sense.
Unfortunately the wavelength interval of the synthetic spectrum does not include the Fe4383 red continuum window. However, it can be seen in Figure 16 that CH line variation is very mild in the spectral vicinity of the index, so that it is unlikely that Fe4383 is strongly affected by these lines, and we chose not to make any correction to model predictions of Fe4383. In the case of we find that the index is reduced by 5% when CN-strong stars are included in the synthesis, because of the aforementioned contamination of the index by CH lines. This is an artifact of the index definition, as illustrated in Figure 16, where we display a zoom of the spectra from Figure 15 in the region of . The continua and passband of are shown in the upper panel. From the figure, it is clear that the reduction in when considering CN-strong (CH-weak) stars is due to the reduction in the intensity of the CH feature at 4352 Å, which is included in the index passband. This result should be taken as a warning, for it means that is affected, though mildly, by carbon and nitrogen abundance ratios, which may differ between giant ellipticals and the Milky Way (Trager et al. 1998).
It is interesting to note that the results of Gibson et al. (1999), Jones (1996) and Rose (1994) for CaI were opposite to ours, in the sense that the index was underpredicted by their models. This is an artifact of the differing index definitions adopted in the different works. In particular, the other authors adopted high-resolution, very narrow-band indices, whose continuum windows were much less affected by CN/CH opacities than Ca4227, whose blue continuum contains strong CN lines. The latter make the index much weaker in the observed spectrum, due to the lowering of the blue continuum by the stronger CN lines in the spectra of CN-strong stars from 47 Tuc (see next section). All in all, we stress the fact that our correction for the intensity of CN lines brings our predicted Ca4227 essentially into agreement with the observations.
A similar study was performed by Tripicco & Bell (1992), where integrated synthetic spectra of purely CN-strong and CN-weak stars have been computed and compared to the integrated spectrum of 47 Tuc. The authors found that a better fit was obtained when a purely CN-strong integrated spectrum is employed. This is in disagreement with our results shown in Figures 13 and 14, because if we assume that the center of 47 Tuc is made of 100% of CN-strong stars, the corrections for the effect of these stars in the Figures would drive our model predictions far from the observations. Tripicco & Bell (1992) claim that their result is consistent with the evidence, found by Norris & Freeman (1979), of an increase of the ratio of CN-strong/CN-weak fraction towards the cluster center. Indeed, Briley (1997) found further evidence, on the basis of better statistics, suggesting that the fraction of CN-strong stars in the inner 10 arcminutes of the cluster is 65%. However, the data in Briley (1997) do not seem to suggest that the proportion of CN-strong stars increases all the way into the cluster center, but rather keeps a constant value from 4 to 10 arcminutes from the center, undergoing a sharp decline towards larger radii. It is nevertheless very hard to assess the reasons for the disagreement between Tripicco & Bell and our work, given the many differences between the two procedures, such as: the abundance patterns adopted in the computations of stellar synthetic spectra are slightly different; their integrated synthetic spectrum is based on a theoretical isochrone, while ours is based on an observed color-magnitude diagram; they compute synthetic spectra in a fine grid of stellar parameters, while we just infer a somewhat cruder estimate of the corrections to the model integrated spectrum from computations for a much coarser grid of stellar parameters. A resolution of this impass awaits the production of a finer grid of synthetic spectra with updated model atmospheres and opacities (Castilho & Barbuy 2002, in preparation).
In summary, we conclude that considering the effect of CN-strong stars in the integrated spectrum of 47 Tuc brings our model predictions into better agreement with the observations, in particular for Ca4227, for which the corrected model prediction is almost exactly correct. The case of is more complicated, because, as opposed to , our synthetic spectrum is not a good match to the spectra of normal cool giants in the region of this index, as shown in the Appendix. Comparing the results from the three Balmer lines under study, we achieve formal agreement with the observations for both and , while is overpredicted by 0.4 Å. The residual mismatches in and are 0.03 and 0.09 Å respectively. Such mismatches translate into age errors, according to the models of Paper II, of +4 Gyrs for , –1.5 Gyr for and –1 Gyr for .
5.4 Uncertainties due to Input Stellar Parameters
As noted in Section 2.1.1, the and metallicity scales of metal-poor stars from different sources in the literature may differ by up to 100 K and 0.1 dex. Scale uncertainties of this magnitude are present in the adopted stellar parameters of our stellar library. We ask here how such uncertainties would affect our CMD-based model spectrum, if at all. Consider errors first. It turns out that these completely cancel out. This is because the calibration adopted to convert s from the CMD of 47 Tuc to s was inferred from the s and colors of the library, in the case of the giants, while for the dwarfs the calibration adopted is fully consistent with the s and s of the library stars. Thus, it does not matter which parameter is formally used to select stars from the spectral library: both and produce the same result for a fixed [Fe/H]. is just an intermediate placeholder, and the real calibration taken from the library is line-strength vs. , which are both well measured empirically. Therefore, the effect of any error in the -scale of the library stars is negligible.
The same is not true of [Fe/H] errors. Any systematic error in the [Fe/H]-scale of the library stars will produce a mismatch between observed and model line indices. The error in the metallicity which is deduced from the integrated line indices is precisely equal to the scale zeropoint error in the [Fe/H]-scale of the stellar library. In fact, we seem to have detected such a mismatch, in that 47 Tuc appears to be a little more metal-poor (by 0.05 dex) according to our synthesis than the previous high-resolution analysis. In fact, we cannot tell from our present knowledge whether the mismatch is an error in the high-resolution analysis (which we have assumed until now) or in our own stellar library [Fe/H] zeropoint. In either case, the effect is reassuringly small.
Finally, we note that the temperature cancellation effect that is present in the CMD-based model is not achieved when making models based on theoretical stellar isochrones, where stars in the synthesis are ultimately selected by , not . This problem will be the subject of a detailed discussion in Paper II.
Another source of error in the computation of the CMD-based model spectrum is the assumed reddening. If the reddening is overestimated, dereddened colors are bluer, so that the stars selected in the synthesis tend to be hotter (for a fixed [Fe/H]), leading to stronger Balmer lines and weaker metal lines in the CMD-based model spectrum. The value adopted in this work, , was taken from Hesser et al. (1987). We estimated the uncertainties in the model predictions due to errors in reddening by varying the input by 0.01 mag and measuring all line indices in the model spectra obtained. The results are shown as the arrows labeled “E(B-V)” in Figures 13 and 14. From the size of these arrows, and with the aid of the isochrone-based models presented in Paper II, we estimate that errors due to reddening cause an uncertainty of 1 Gyr in the spectroscopic age inferred from Balmer lines. This result is fully consistent with the uncertainties induced by reddening in the ages inferred from the fit to the turn-off absolute magnitude.
5.5 Fractional Contribution to the Integrated Light from Different Evolutionary Stages
On the basis of the good general agreement between our model predictions and the observed integrated spectrophotometry and color of the cluster, we report in Table 5 the relative contributions of the various evolutionary stages to the integrated light of the cluster, at a number of reference wavelengths. The different evolutionary stages are delimited in the CMD of Figure 10. We notice that those definitions are somewhat arbitrary (for instance, in the case of the line separating turn-off from subgiant stars); therefore the results are subject to small changes if alternative definitions are adopted. The giants are divided into 4 sub-classes according to their s: G50 ( 5000 K), G45 (5000 4500 K), G40 (4500 4000 K) and G30 ( 4000 K).
From this exercise, we confirm the well known fact that giants are the dominant source of light in the optical, being responsible for more than half the integrated light for 5000 Å. Furthermore, the red giants in a narrow range of (G45) account for half of all giant light. In contrast, turn-off stars contribute only about 1/5 of the integrated light at 4000 Å, and their contribution drops to half that value around 5300 Å. Thus, when coupled with the slow evolution of the turn-off at old ages, it is not surprising that hydrogen lines such as in the integrated spectra of old stellar populations change so slowly with age.
Another interesting finding is the very low contribution of blue stragglers to the integrated light. As the CMD of Figure 10 samples the core of 47 Tuc, the relative number of blue stragglers is maximized, yet they contribute 1% of the integrated light beyond 4000 Å. Such a small contribution was also inferred from the integrated CaII index of 47 Tuc by Rose (1994). The effect of blue stragglers on line indices is also negligible, except for and, to a lesser extent, and . The impact of blue stragglers on age determinations from these indices is discussed in Paper II.
The CMD of Figure 10 does not include white dwarfs and UV-excess stars which were shown to be abundant in the core of 47 Tuc by Ferraro et al. (2001). In their Figures 1 and 2, however, it can be seen that those stars, though being almost as numerous as blue stragglers, are on average 4–5 magnitudes fainter at , so that their neglect in our computations has no impact on the final result.
The stars just above the subgiant branch in Figure 10 are due to crowding and unresolved binaries. They were taken into account in the calculations by dividing by two their observed magnitudes. Their contribution to the integrated light ( 0.3 % at all wavelengths) and line indices is negligible.
6 Conclusions
In this paper, we synthesized the integrated spectrum of 47 Tuc directly from its color-magnitude diagram. Our models are based on a moderately high-resolution spectral library and a deep observed CMD of the cluster.
Our CMD-based model spectrum provides a good match to a number of Balmer line and metal-line indices. Excellent fits are achieved for , , Ca4227 and . We also obtain satisfactory fits for Fe4383 and . The remaining 0.04 Å mismatch in Fe4383 (4 , see Table 4) is negligible if compared to the response of the index to [Fe/H] ( 0.3 Å/dex, see Vazdekis et al. 2001). Only for do the models fail in predicting the observed value of the index, but the CN correction for this index is perhaps the most uncertain.
A number of key factors were responsible for the agreement achieved:
– We had to correct the model predictions for a limitation of the spectral library, namely, that it lacks a sufficient number of metal-poor giants.
– A small adjustment (by –0.05 dex) was made to the [Fe/H] of 47 Tuc. It is not possible to decide if this really reflects a lower Fe abundance than the Carretta & Gratton (1997) value, or if it is due to an error in the zeropoint of the [Fe/H]-scale of the library stars. Further evidence for a lower Fe abundance in 47 Tuc, from a classical detailed abundance analysis comes from Brown & Wallerstein (1992), who found [Fe/H]=–0.8. This issue needs to be addressed by future high-resolution studies of individual cluster stars. Most importantly, the –0.05 shift is comfortably within the errorbars of both our [Fe/H]-scale and the abundance determinations of individual stars.
– The model predictions were corrected for the effect of CN-strong stars in 47 Tuc. Since our stellar library lacks CN-strong stars, we resorted to a spectrum synthesis approach. This correction is crucial to bring the models into agreement with the observations in the case of Ca4227. The effect on is small, and is probably small as well in the case of Fe4383. It is also computed to be small in the case of , in disagreement with the observations, but the spectrum around is heavily blended by CN lines and the correction is uncertain.
We devoted special attention to fitting Balmer lines because they are the key indices for spectroscopic age determination. For and , model predictions agree with the observations within the errorbars. , on the other hand, is overestimated by 0.4 Å. The latter mismatch translates into an age overestimate, according to the models to be presented in Paper II, of 4 Gyrs. Residual mismatches in and translate into age underestimates of 1 and 1.5 Gyrs respectively.
The computation of the integrated spectrum from the CMD of the cluster, being essentially devoid of inputs from theoretical isochrones, allowed us to infer model-independent estimates of the contribution of distinct evolutionary stages to the integrated light at a number of reference wavelengths. Giant branch and horizontal branch stars together contribute roughly 50% of the light at Å. In the same spectral region, turn-off stars contribute about 20% of the integrated light, while subgiants and lower main sequence stars contribute roughly equal parts to the remaining 30%. The contribution due to giants of course increases towards redder wavelengths. In the continuum of , turn-off stars contribute less than 15% of the integrated light. These numbers are only valid for metallicities around [Fe/H]=–0.7. For more metal-rich stellar populations, red-giant light may become less important in the blue. We call the attention of the reader to yet another caveat, which refers to the definition of the evolutionary stages themselves, which is somewhat arbitrary, especially when drawing a line separating turn-off from subgiant stars. Slightly different definitions would cause small changes in the numbers given in Table 5.
We derived a new set of stellar parameters for the spectral library stars, on the basis of a combination of Strömgren photometry and calibrations from the literature for the dwarfs, and a calibration of spectral features as a function of stellar parameters for the giants. On the basis of the latter, we derived a new metallicity-dependent vs. transformation for giant stars. We also assessed systematic errors in our stellar parameters by comparison with determinations from other sources. Metallicity and -scales can differ among different authors by as much as 0.1 dex and 70 K for giants and 0.05 dex and 50 K for dwarfs. A more thorough discussion of our determinations and the full list of stellar parameters will be presented elsewhere (Schiavon 2002, in preparation).
The main conclusion of this paper refers to our ability to correctly reproduce the integrated spectrum and color of a well-known globular cluster on the basis of the simplest possible assumptions. Our procedure relies on very few theoretical assumptions and thus allows us to isolate and study effects due to limitations of the empirical spectral library and uncertainties in the stellar parameters adopted. We have shown that such effects are in most cases minor and can be easily corrected. Most importantly, we conclude that the exceedingly high spectroscopic ages found for 47 Tuc in previous work ( 20 Gyrs, Gibson et al. 1999) cannot be attributed either to features of the spectral library or the calibrations adopted given that the age differences implied by the residual mismatch in Balmer line EW. The corrections inferred in this paper are applied in Paper II to our computations of integrated spectra based on theoretical isochrones. There, the main goal is to fit the integrated spectrum of 47 Tuc to determine its absolute age and metallicity.
Appendix A APPENDIX
A.1 Spectrum synthesis from model atmospheres
Synthetic spectra were computed for a set of representative stellar parameters, typical of giants, subgiants and turn-off stars from 47 Tuc. The stellar parameters adopted were: (,) = (4750 K,2.50) for a red giant, (6000 K,4.0) for a turn-off star and (5250 K,3.0) for a subgiant. All spectra were computed for [Fe/H]=–0.5.
An updated version of the code by Spite (1967), extended to include molecular lines by Barbuy (1982), where LTE is assumed, was used for the spectrum synthesis calculations. This code (FSYNTH) now includes atomic and molecular lines from the UV to near-IR, and the computations are made faster.
The synthetic spectra were calculated using two different abundance patterns: one adopting the solar chemical composition (Grevesse & Sauval, 1998), scaled to the adopted metallicity of –0.5 dex, and the other for the abundance pattern of CN-strong stars, [C/Fe]=–0.2 and [N/Fe]=+0.8 (Cannon et al. 1998). The ATLAS9 photospheric models, by Kurucz (1992) were employed. The spectra were calculated in 0.02 Å steps and later convolved and rebinned to match the resolution and dispersion of the observed spectra.
The concentration of CN in the stellar photosphere of metal-poor stars is known to be important in determining the temperature stratification, by introducing a backwarming effect (see, for instance, Gustafsson et al. 1975, Drake, Plez & Smith 1993, Hill et al. 2000). Therefore, in order to be fully consistent, we would need to use a set of model photospheres computed with the abundance pattern characteristic of CN-strong stars. Unfortunately, such model photospheres are not presently available. However, as shown by Drake, Plez & Smith (1993), the temperature change at low optical depths due to varying the CN concentration by the amounts discussed here is around 75 K for models with [Fe/H]=–1.0, being lower for higher metallicity models. Therefore the computations shown here serve as a first-order approximation to the problem.
Our list of atomic lines is based on the list of lines identified in the solar spectrum by Moore et al. (1966) and includes the updated list and accurate data for Fe I by Nave et al. (1994). Oscillator strengths for atomic lines were adopted from Nave et al. (1994), Wiese et al. (1969), Fuhr et al. (1988) and Martin et al. (1988) whenever available. Otherwise they were obtained by fitting the solar spectrum (Castilho 1999). The damping constants for the neutral element lines were calculated using tables of cross sections by Barklem et al. (1998 and references therein), and for the other lines they were determined by fitting the solar spectrum (Castilho 1999).
Molecular lines from the following electronic systems were taken into account in the calculations for the 4000-4400 Å interval: MgH (A-X), C2 (A-X), CN blue (B-X), CH (A-X), CH (B-X), CH (C-X), OH (A-X), NH (A-X) (see Castilho 1999 and Barbuy et al. 2001 for details). Franck-Condon factors with dependence on the rotational quantum number J as given in Dwivedi et al. (1978) and Bell et al. (1979) were computed and adopted when possible. For vibrational bands for which such values were not available, we adopted a constant value kindly made available to us through computations by P. D. Singh (unpublished).
Figures 18 and 19 compare the broadened and rebinned synthetic spectrum, computed adopting solar abundance ratios, to the library spectrum of a star with similar stellar parameters in the neighborhood of both and . While most spectral features are well reproduced by the synthetic spectrum, it is clear that some lines in the observed spectrum are not well matched by the models. The region of biggest mismatch is in fact the line passband of , which might explain our failure to fully match this index (Section 5.2). This is a result of uncertainties in both the model atmospheres and atomic oscillator strengths and also probable incompleteness in the atomic line lists.
References
- Alonso et al. (1995) Alonso, A., Arribas, S. & Martínez-Roger, C. 1995, A&A, 297, 197
- Alonso et al. (1996) Alonso, A., Arribas, S. & Martínez-Roger, C. 1996, A&A, 313, 873
- Alonso et al. (1999) Alonso, A., Arribas, S. & Martínez-Roger, C. 1999, A&AS, 139, 335
- Arenou et al. (1992) Arenou, F., Grenon, M. & Gómez, A. 1992, A&A, 258, 104
- (5) Barbuy B., 1982, Ph.D. Thesis, Univ. Paris VII
- Barbuy et al. (1992) Barbuy, B., Erdelyi-Mendes, M. & Milone, A. 1992, A&AS, 93, 235
- (7) Barbuy B., Perrin M.-N., Katz, D., Cayrel, R., VantVeer, C. 2001, A&A submitted
- (8) Barklem P.S., O’Mara B.J., Ross J.E., 1998, MNRAS 290, 102
- Beers et al. (1999) Beers, T.C., Rossi, S., Norris, J.E., Ryan, S.G. & Shefler, T. 1999, AJ, 117, 981
- (10) Bell R.A., Dwivedi P.H., Branch D., Huffaker J.N., 1979, ApJS, 41, 593
- (11) Blackwell, D.E. & Lynas-Gray, A.E. 1994, A&A, 282, 899
- Briley (1997) Briley, M.M. 1997, AJ, 114, 1051
- Briley et al. (1994) Briley, M.M., Hesser, J.E., Bell, R.A., Bolte, M. & Smith, G.H. 1994, AJ, 108, 2183
- Cannon et al. (1998) Cannon, R.D., Croke, B.F.W., Bell, R.A., Hesser, J.E. & Stathakis, R.A. 1998, MNRAS, 298, 601
- Carney (1996) Carney, B.W. 1996, PASP, 108, 900
- Carney et al. (1994) Carney, B.W., Latham, D.W., Laird, J.B. & Aguilar, L.A. 1994, AJ, 107, 2240
- Carretta & Gratton (1997) Carretta, E. & Gratton, R.G. 1997, A&AS, 121, 95
- (18) Castilho, B.V. 1999 PhD Thesis, IAG, Uiversidade de São Paulo
- Cayrel de Strobel et al. (1997) Cayrel de Strobel, G., Soubiran, C., Friel, E.D., Ralite, N. & François, P. 1997, A&AS, 124, 299
- Chen et al. (1999) Chen, B., Figueras, F., Torra, J., Jordi, C., Luri, X. & Galadí-Enríquez, D. 1999, A&A, 352, 459.
- Chun & Freeman (1979) Chun, M.S. & Freeman, K.C. 1979, ApJ, 227, 93
- Cohen et al. (1998) Cohen, J.G., Blakeslee, J.P. & Ryzhov, A. 1998, ApJ, 496, 808
- Cohen et al. (2001) Cohen, J.H., Behr, B.B. & Briley, M.M. 2001, AJ, in press (astro-ph/0103502)
- Covino et al. (1995) Covino, S., Galletti, S. & Pasinetti, L.E. 1995, A&A, 303, 79
- de Souza et al. (1993) de Souza, R.E., Barbuy, B. & dos Anjos, S. 1993, AJ, 105, 1737
- Drake et al. (1993) Drake, J.J., Plez, B. & Smith, V.V. 1993, ApJ, 412, 612
- (27) Dwivedi P.H., Branch D., Huffaker J.N., Bell R.A., 1978, ApJS, 36, 573
- Ferraro et al. (2001) Ferraro, F.R., D’Amico, N., Possenti, A., Mignani, R.P. & Paltrinieri, B. 2001, ApJ, 561, 337
- (29) Fuhr J.R., Martin G.A., Wiese W.L., 1988, Atomic Transition Probabilities: Iron through Nickel, Journal of Physical and Chemical Reference Data, vol. 17, suppl. no. 4
- Gibson et al. (1999) Gibson, B.K., Madgwick, D.S., Jones, L.A., Da Costa, G.S. & Norris, J.E. 1999 AJ, 118, 1268
- Girardi et al. (2000) Girardi, L., Bressan, A., Bertelli, G. & Chiosi, C. 2000, A&AS, 141, 371
- (32) Grevesse N., Sauval A.J., 1998, SSRv 85, 161.
- Gustafsson et al. (1975) Gustafsson, B., Bell, R.A., Eriksson, K., Nordlund, Å. 1975, A&A 42, 407
- Hauck & Mermilliod (1998) Hauck, B. & Mermilliod, M. 1998, A&AS, 129, 431
- Hakkila et al. (1997) Hakkila, J., Myers, J., Stidham, B.J. & Hartmann, D.H., 1997, AJ, 114, 2043
- Hesser et al. (1987) Hesser, J.E., Harris, W.E., Vandenberg, D.A., Allwright, J.W.B., Shott, P. & Stetson, P.B. 1987, PASP, 99, 739
- Hill et al. (2000) Hill, V., Barbuy, B., Spite, M., Spite, F., Cayrel, R., Plez, B., Beers, T.C., Nordström, B. & Nissen, P.E. 2000, A&A, 353, 557
- Howell et al. (2000) Howell, J.H., Guhathakurta, P. & Gilliland, R.L. 2000, PASP, 112, 1200
- Howell et al. (2001) Howell, J.H. et al. 2001, BAAS, 198, 9505
- Jones, (1999) Jones, L.A. 1996, PhD Thesis, University of North Carolina
- Jones & Worthey (1995) Jones, L.A. & Worthey, G. 1995, ApJ, 446, L31
- Kelson et al. (2001) Kelson, D.D., Illingworth, G.D., Franx, M. & van Dokkum, P.G. 2001, ApJ, 552, L17
- Koo (1998) Koo, D.C. 1998, in Highlights of Astronomy, vol. 11A, Proceedings of IAU 23 Joint Discussion 11: Redshift Surveys in the 21st Century, ed. J. Andersen, (Dordrecht: Kluwer), p. 468
- (44) Kurucz R.L., 1992, in IAU Symp. 149, eds. B. Barbuy, A. Renzini, (Dordrecht: Kluwer), p. 225
- Liu & Chaboyer (2000) Liu, W.M. & Chaboyer, B. 2000, ApJ, 544, 818
- Luck & Challener (1995) Luck, R.E. & Challener, S.L. 1995, AJ, 110, 2968
- (47) Martin G.A., Fuhr J.R., Wiese W.L., 1988, Atomic Transition Probabilities: Scandium through Manganese, Journal of Physical and Chemical Reference Data, vol. 17, suppl. no. 3
- McWilliam (1990) McWilliam A. 1990, ApJS, 74, 1075
- Moore et al. (1966) Moore C.E., Minnaert M.G.J. & Houtgast J. 1966, The Solar Spectrum 2935 Å to 8770 Å (Washington: National Bureau of Standards NBS Monograph 61)
- (50) Nave G., Johansson S., Learner R.C.M., Thorne A.P., Brault T.J., 1994, ApJS 94, 221
- Neckel et al. (1996) Neckel, Th., Klare, G. & Sarcander, M. 1980, A&AS, 42, 251
- Norris & Freeman (1979) Norris, J. & Freeman, K.C. 1979, ApJ, 230, L179
- Perry et al. (1987) Perry, C.L., Olsen, E.H. & Crawford, D.L. 1987, PASP, 99, 1184
- Richer et al. (1996) Richer, H.B., et al. 1996, ApJ, 463, 602
- Rose (1985) Rose, J.A. 1985, AJ, 90, 1927
- Rose (1994) Rose, J.A. 1994, AJ, 107, 206
- Salaris & Weiss (1998) Salaris, M. & Weiss, A. 1998 A&A, 335, 943
- Salaris (2001) Salaris, M. 2001, in Observed HR diagrams and stellar evolution: the interplay between observational constraints and theory, (Dordrecht: Kluwer), in press
- Santos et al. (1995) Santos, J.F.C.Jr., Bica, E., Dottori, H., Ortolani, S. & Barbuy, B. 1995, A&A, 303, 753
- Savage et al. (1985) Savage, B.D., Massa, D., Meade, M. & Wesselius, P.R. 1985, ApJS, 59, 397.
- Schiavon & Barbuy (1999) Schiavon, R.P. & Barbuy, B. 1999, ApJ, 510, 934
- Schiavon et al. (1999) Schiavon, R.P., Barbuy, B. & Bruzual A., G. 2000 ApJ, 532, 453
- Schlegel et al. (1998) Schlegel, D.J., Finkbeiner, D.P. & Davis, M. 1998, ApJ, 500, 525
- Schuster & Nissen (1989) Schuster, W.J. & Nissen, P.E. 1989, A&A, 221, 65
- Smalley & Dworetsky (1993) Smalley, B. & Dworetsky, M.M. 1993, A&A, 271, 515
- Soubiran et al. (1998) Soubiran, C., Katz, D. & Cayrel, R. 1998, A&AS, 133, 221
- (67) Spite M., 1967, Ann. Astrophys. 30, 211
- Trager et al. (1993) Trager, S.C., Djorgovski, S. & King, I.R. 1993, in ASP Conf. Ser. 50, Structure and Dynamics of Globular Clusters, ed. S.G. Djorgovski & G. Meylan (San Francisco: ASP), 347
- Trager et al. (1998) Trager, S.C., Worthey, G., Faber, S.M. Burstein, D. & González, J.J. 1998, ApJS, 116, 1
- Tripicco & Bell (1992) Tripicco, M.J. & Bell, R.A. 1992, AJ, 103, 1285
- Tripicco & Bell (1995) Tripicco, M.J. & Bell, R.A. 1995, AJ, 110, 3035
- Vazdekis (1999) Vazdekis, A. 1999, ApJ, 513, 224
- Vazdekis & Arimoto (1999) Vazdekis, A. & Arimoto, N. 1999, ApJ, 525, 144
- Vazdekis et al. (2001) Vazdekis, A., Salaris, M., Arimoto, N. & Rose, J.A., 2001, ApJ, 549, 274
- (75) Wiese W.L., Martin G.A., Fuhr J.R., 1969, Atomic Transition Probabilities: Sodium through Calcium, NSRDS-NBS 22
- Worthey et al. (1994) Worthey, G., Faber, S.M., González, J.J. & Burstein, D. 1994, ApJS, 94, 687
- Worthey & Ottaviani (1997) Worthey, G. & Ottaviani, D.L. 1997, ApJS, 111, 377


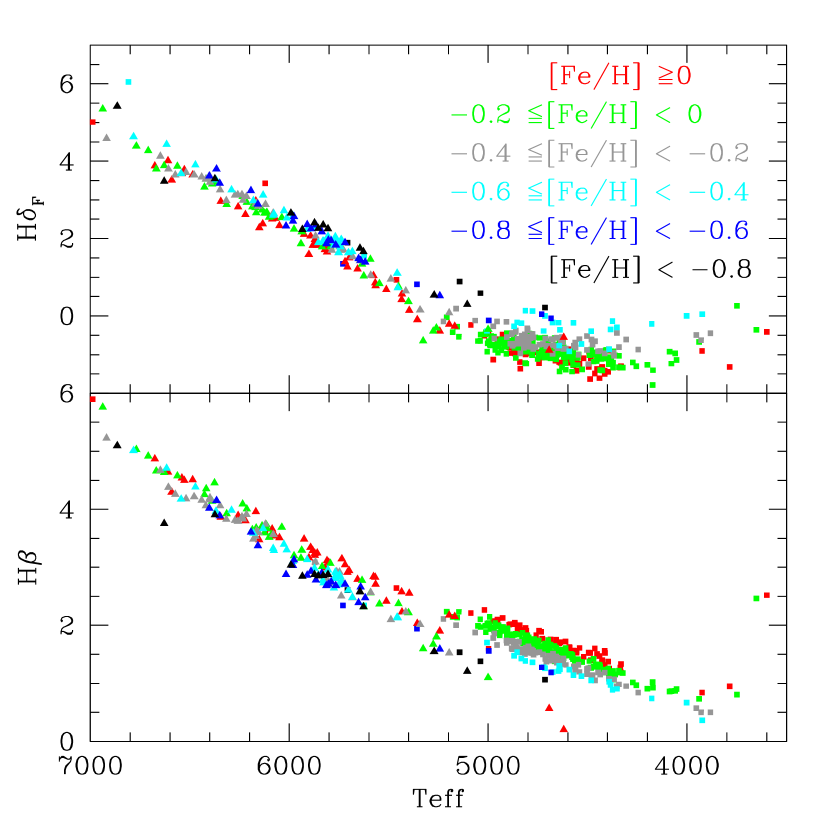
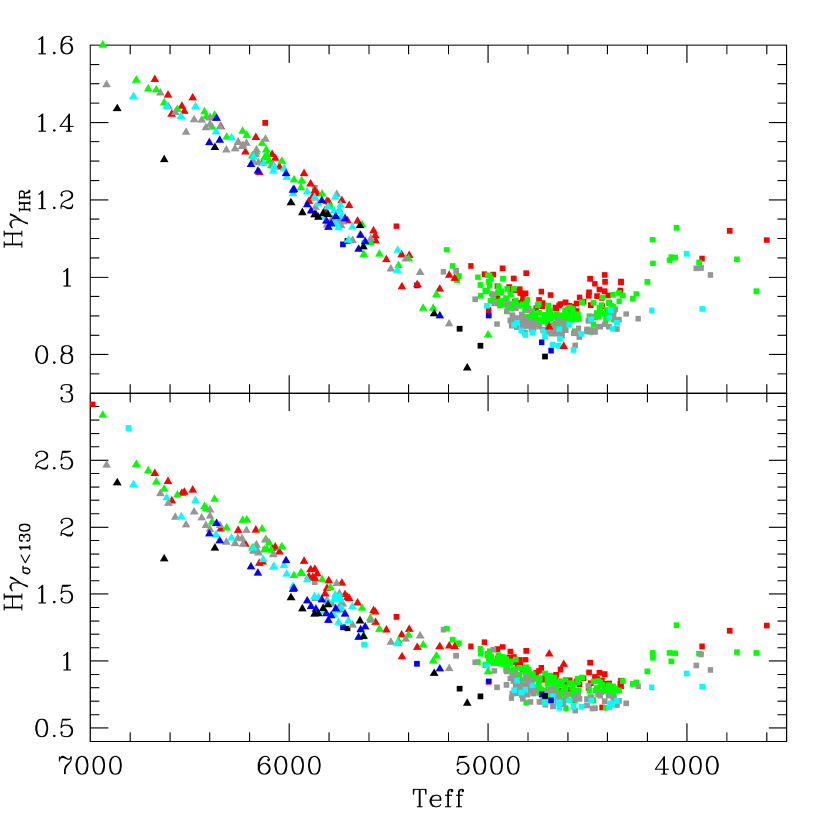
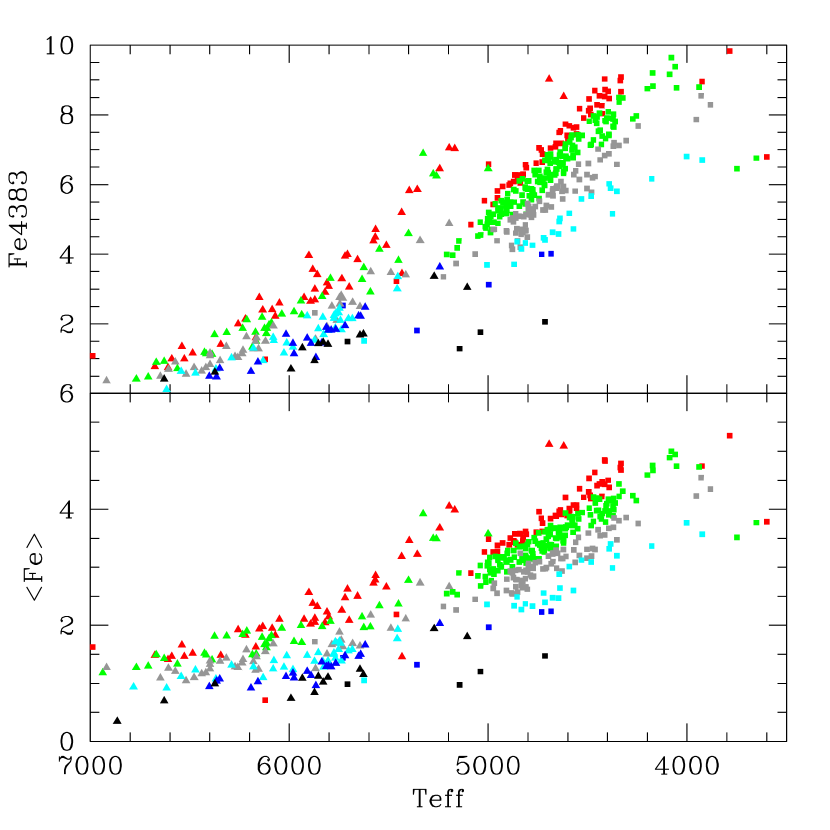
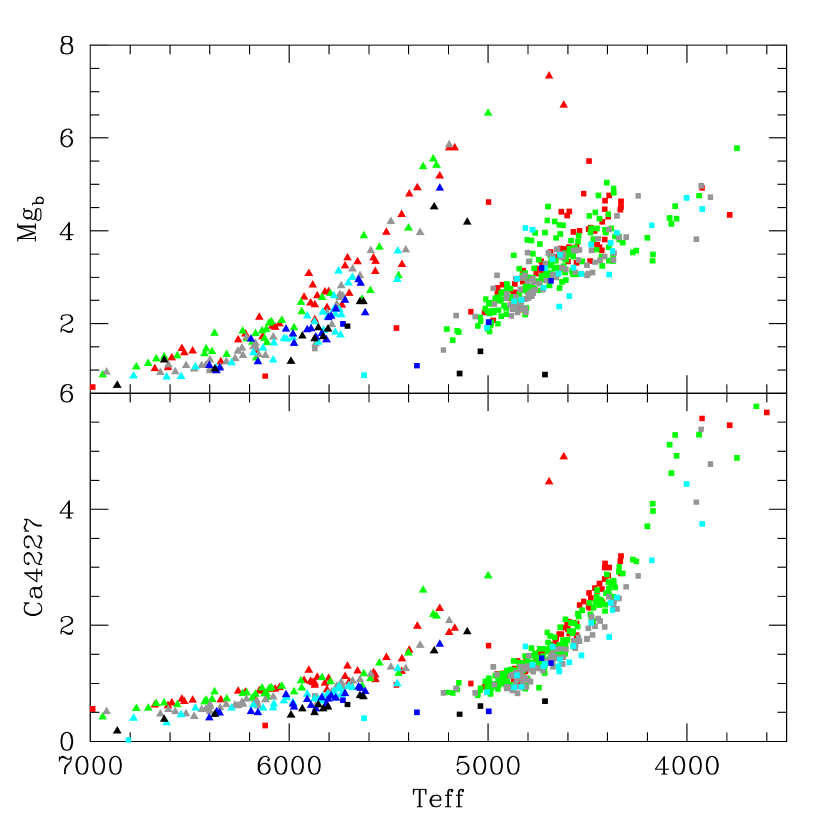


| [Fe/H] | -2.6895 | 0.47814 | -0.01916 | -0.06726 | 0.75866 | -0.00383 | |
| 3989.76 | -17.480 | -4.032 | -74.572 | 1072.59 | -118.957 | 49.325 |
| 0.70816 | 0.31406 | 0.03296 | 0.09548 | -0.17799 | -0.04965 |
| 0.860.01 | 0.86 | 0.85 |
Note. — is the dereddened from Chun & Freeman (1979), within an aperture of 1 arcmin. Superscript ‘st’ denotes the integrated color of the stars entering the synthesis, while no superscript indicates the color obtained from direct integration of stars in the CMD. In both cases, stars below the completeness limit are included assuming a Salpeter IMF (see text).
| Ca4227 | Fe4383 | ||||||
|---|---|---|---|---|---|---|---|
| Observed | 0.7770.003 | 0.920.02 | 0.920.04 | 3.160.01 | 1.570.17 | 0.450.03 | 2.290.25 |
| Observed - BS | 0.70 | 0.92 | 0.91 | 3.19 | 1.54 | 0.45 | 2.29 |
| Model | 0.796 | 1.288 | 0.97 | 3.56 | 1.55 | 0.47 | 2.32 |
| Corr. | 1.06 | 1.26 | 0.93 | 3.20 | 1.48 | 0.46 | 2.14 |
| CN-Corr. | 1.17 | 0.80 | 0.89 | – | – | – | – |
Note. — The first row lists indices measured in the observed spectra. In the second row, the indices are corrected from the contribution by blue stragglers. The corrections are larger than the errorbars only for and Fe4383. These are the values to be compared with predictions from model isochrones in Paper II, while the CMD-based models listed in rows 3 through 5 should be compared to the values of the first row. The third row lists the indices measured in the CMD-based model spectra. The fourth row lists model predictions corrected for the metallicity effects discussed in Section 5.2 and fifth row lists the indices corrected for the contamination of Cn and CH lines, according to the discussion of Section 5.3.
| TO | G50 | G45 | G40 | G30 | HB | PMS | MS | SG | BS | |
|---|---|---|---|---|---|---|---|---|---|---|
| 3912 | 23.5 | 7.6 | 15.0 | 4.3 | 2.4 | 18.6 | 14.4 | 47.9 | 12.5 | 1.4 |
| 4088 | 18.8 | 7.9 | 18.0 | 7.0 | 4.4 | 18.7 | 13.4 | 56.0 | 10.5 | 0.8 |
| 4317 | 16.9 | 8.1 | 19.1 | 8.6 | 5.7 | 19.0 | 12.4 | 60.5 | 9.3 | 0.7 |
| 4475 | 15.5 | 8.1 | 19.7 | 9.7 | 6.5 | 18.8 | 12.1 | 62.8 | 8.7 | 0.6 |
| 4896 | 13.6 | 7.6 | 20.4 | 11.8 | 9.7 | 17.2 | 11.3 | 66.7 | 7.7 | 0.5 |
| 5358 | 12.2 | 7.2 | 20.5 | 13.4 | 11.6 | 17.3 | 10.3 | 70.0 | 6.8 | 0.4 |