The Discovery of a Second Luminous Low Mass X-ray Binary in the Globular Cluster M15
Abstract
We report an observation by the Chandra X-ray Observatory of 4U2127+119, the X-ray source identified with the globular cluster M15. The Chandra observation reveals that 4U2127+119 is in fact two bright sources, separated by . One source is associated with AC211, the previously identified optical counterpart to 4U2127+119, a low mass X-ray binary (LMXB). The second source, M15-X2, is coincident with a U magnitude blue star that is from the cluster core. The Chandra count rate of M15-X2 is 2.5 times higher than that of AC211. Prior to the imaging capability of Chandra the presence of two so closely separated bright sources would not have been resolved. The optical counterpart, X-ray luminosity and spectrum of M15-X2 are consistent with it also being an LMXB system. This is the first time that two LMXBs have been seen to be simultaneously active in a globular cluster. The discovery of a second active LMXB in M15 solves a long standing puzzle where the properties of AC211 appear consistent with it being dominated by an extended accretion disk corona, and yet 4U2127+119 also shows luminous X-ray bursts requiring that the neutron star be directly visible. The resolution of 4U2127+119 into two sources suggests that the X-ray bursts did not come from AC211, but rather from M15-X2. We discuss the implications of this discovery for understanding the origin and evolution of LMXBs in GCs as well as X-ray observations of globular clusters in nearby galaxies.
1 Introduction
The X-ray source 4U2127+119 associated with the globular cluster (GC) M15 was the first to be identified with an individual star within a GC. The identification with the star AC211 was made by Auriere, le Fevre and Terzan (1984) using the Einstein high resolution imager (HRI) position (Hertz and Grindlay 1983; HG83). The identification of AC211 with 4U2127+119 was further strengthened from a spectroscopic study by Charles, Jones and Naylor (1986), which showed characteristic signatures of a LMXB. AC211 was found to have a modulation of 8.5 hr in the optical (Ilovaisky et al. 1987), which was then subsequently seen in the X-ray flux of 4U2127+119 (Hertz 1987; H87). Further observations and a more detailed analysis by Ilovaisky et al. (1993; I93) revealed the true orbital period of AC211 to be 17.1 hr, twice the originally proposed value.
AC211 is optically one of the brightest known LMXBs and yet has a relatively low X-ray luminosity of ergs s-1. The high optical to X-ray luminosity ratio suggests that a very luminous central X-ray source is hidden behind the accretion disk, with X-ray emission scattered into our line of sight via an accretion disk corona, ADC (Auriere et al. 1984, H87, Naylor et al. 1988). An ADC is also required to explain the X-ray orbital modulation (H87, I93). This neat picture was put into doubt when a luminous X-ray burst from 4U2127+119 was recorded by the Ginga satellite in 1988 (Dotani et al. 1990). This burst was long lived ( 150 s) with a precursor event s before the longer event. The peak luminosity of the burst was above ergs s-1, with an expansion of the neutron star photosphere (Dotani et al. 1990; van Paradijs et al. 1990), meaning that the neutron star surface had been directly observed. A dip in the continuum flux between the precursor and the main burst seemed to tie this event to the X-ray source in M15. A second X-ray burst from 4U2127+119 in September 2000, with similar properties to the first, has been reported by Smale (2001) using RXTE. The observation of X-ray bursts from 4U2127+119 has been hard to reconcile with the idea that the central source is hidden behind an ADC. In the letter we report the results of a Chandra High Energy Transmission Grating (HETG) observation that solves the puzzling behavior of 4U2127+119.
2 Results
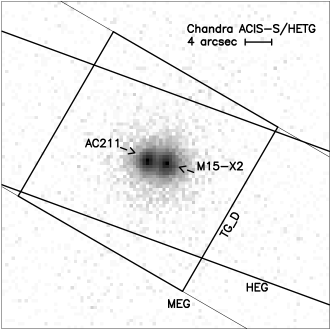
4U 2127+119 was observed with the Chandra HETG grating in conjunction with the ACIS-S CCD array on 2000 August 24, for a total exposure of order 21,000 s. The event file was gain corrected, using the calibration released on June 7 2001 (Caldb 2.6), screened for bad pixels and good time intervals. Streaks caused by flaws in the serial readout of the CCDs were also removed. A CCD grade histogram shows a large fraction of grade seven events, indicating considerable pile up. The zero order image from the cleaned event file using all grades is shown in Figure 1a – two bright sources separated by can be seen. To determine the best source positions we used data from all grades and determined the peak of the distribution in a box of pixels. The positions of the two sources are M15-X1: R.A. (J2000) = , Dec (J2000) = and M15-X2: R.A. (J2000) = , Dec (J2000) = .
Accurate positions for AC211 were reported by Kulkarni et al. (1990) based on radio measurements and by Geffert et al. (1994) based on meridian circle measurements and the PPM catalogue. The separation between the radio-meridian and radio-PPM positions range between . M15-X1 is within of the Kulkarni position of R.A.(J2000)=, Dec(J2000)= for AC211. This is within the uncertainty of the Chandra attitude solution. To obtain the best coordinates for the second source we then corrected the image reference coordinates so as to give the Kulkarni position for AC211. This corresponded to a shift of in RA and in Dec, and gives a revised position for M15-X2 of R.A. (J2000)= and Dec (J2000)=. Since the M15-X2 source shows pile-up, which could effect the centroiding, we adopted a conservative positional uncertainty of diameter, based on the size of 1 pixel in the Chandra CCD. We designate the new source CXO J212958.1+121002, although continue to refer to it here by the more concise name M15-X2.
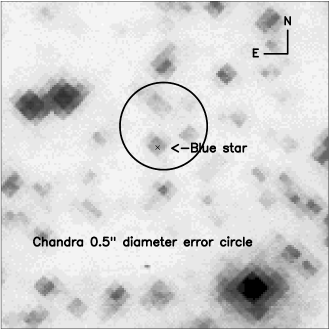
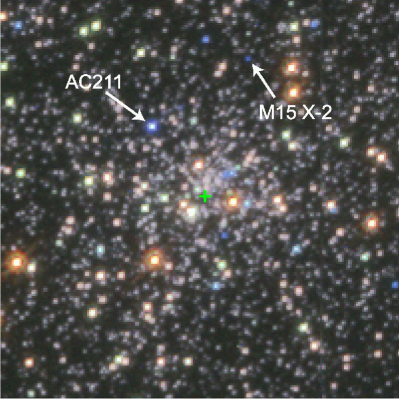
To search for an optical counterpart we used the Hubble Space Telescope (HST) images published in Guhathakurta et al. (1996). In Figure 1b we over the diameter circle centered on the M15-X2 position (Figure 1b). Near the center of the error circle is a faint blue star. De Marchi and Paresce (1994) have cataloged the M15 stars seen in earlier HST images and in their list the faint blue star is number 590, a star with an equivalent U magnitude of 18.6. Star 590 is from the Chandra position centroid for M15-X2. In Figure 1c we indicate on the original color (U+B+V) image from Guhathakurta et al. (1996) the positions of AC211 and the blue optical counterpart to M15-X2. The new source M15-X2 is from the center of M15 (the green cross in Figure 1c). A faint blue optical counterpart is the classic signature of a LMXB (e.g. van Paradijs and McClintock 1996) and it seems very likely that this is the counterpart to the X-ray source.
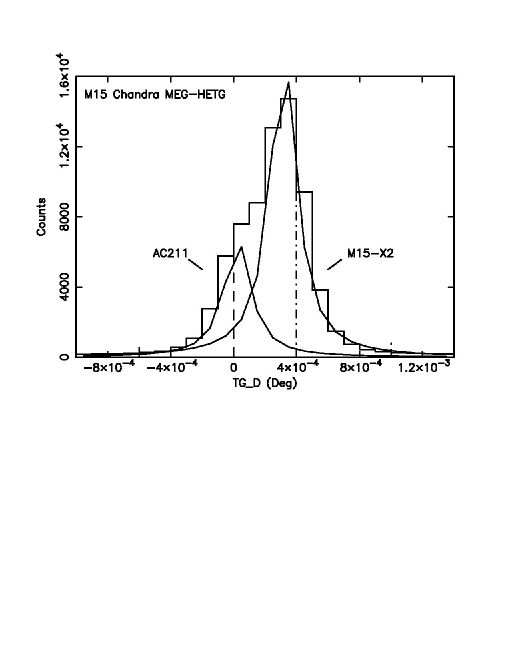
The HEG and MEG dispersion directions and the two source positions relative to the Chandra roll angle are such that the dispersed grating spectra of the two sources overlap (Figure 1a). Due to the 10 degree difference in dispersion angle between the two gratings, the overlap is more severe in the HEG compared to the MEG. To extract the spectra of the two sources, histograms for the MEG and HEG along the cross-dispersion dimension were fitted with Lorenzian models. The Lorenzian width was fixed at the value obtained from a similar histogram of a point source. The width of the HEG histogram is consistent with a single source, while the MEG requires a double Lorenzian fit (see Fig 2). We concentrated on the MEG grating spectrum because it is the best separated. The relative normalization between the two Lorenzian models for the MEG histogram is , with M15-X2 the brighter source. This is consistent with the fact that most of the zero order grade seven events, caused by pile-up, are coincident with M15-X2. MEG spectra and light curves were accumulated by selecting regions across the cross-dispersed direction, where the contamination was a minimum (Fig 2). The percentage of counts from each source included in the extracted spectra are 50% for AC211 and 20% for M15-X2.
The lightcurves of the two sources exhibit quite different variability, confirming that the cross contamination is minimal (Figure 3). The X-ray flux of AC211 is highly variable across the observation, typical of that reported in the past (see e.g. Ilovaisky et al. 1987). Using the ephemeris given in I93 the observation began at orbital phase 0.6 and ended at 0.9, just prior to the predicted time of the partial X-ray eclipse. In contrast M15-X2 shows little variability, with just a very slight decline of a few percent across the observation. A power spectrum analysis of each source for a frequency range Hz to 0.196 Hz (twice the CCD read out) did not reveal any periodic signal with a peak to mean amplitude 10%, neither from AC211, nor from M15-X2. There was some quasi-periodic activity on a timescale of hr from AC211 (which can be seen in the lightcurve) and a 700s modulation in both sources caused by a deliberate wobble in the spacecraft pointing to reduce pileup in the CCD.
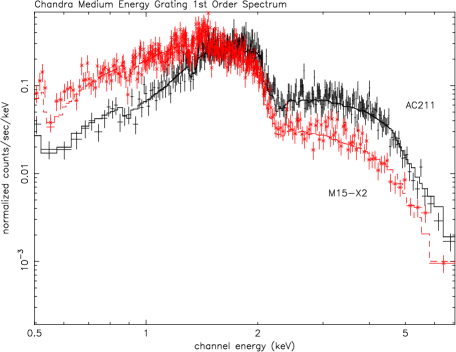
The spectra of the two sources, separated by orders, were extracted using the tgextract routine included in Ciao 2.1. For each source the first order positive and negative MEG spectra were added together and grouped with a minimum of 20 counts per bin. The MEG spectra of the two sources are shown in Figure 4. The X-ray spectrum of AC211 is harder than that of M15-X2. The new source, M15-X2, can be fit with a single power law with an energy index of and an absorption of H cm-2. Fixing the overall absorption at the expected value to M15 equivalent to a hydrogen column density of cm-2 still gives an acceptable fit (reduced of 1.14), with a power law index of . In contrast, AC211 is not well fit by a single component power law or thermal bremsstrahlung model. A power law model gives a relatively hard photon index of 1.2 with an absorption of cm-2, but with a reduced of 1.75. A partial covering model, one of several components used by Sidoli, Parmar and Oosterbroek (2000; SPO) to fit the broader band BeppoSAX integrated spectrum of both sources, does provide an acceptable fit. This gives a power law index of 2.1, a covering fraction of 0.87 with an absorption of cm-2 and an interstellar absorption of cm-2. Fixing the absorption at the expected interstellar value for M15 gives a power law index of , a covering fraction of and an intrinsic absorption of cm-2. This is higher than the covering fraction of 0.64 reported by SPO for the combined spectrum of both sources. Using the expected point spread function for a single source we corrected for the partial extraction of the two sources. The 0.5–7.0 keV flux from AC211 is ergs cm-2 s-1, corresponding to ergs s-1 using a distance of 10.3 kpc to M15 (Harris 1996). For the new source, M15-X2 the 0.5-7.0 flux is ergs cm-2 s-1, corresponding to ergs s-1.
The second burst from 4U2127+119 reported by Smale (2001), occurred one month after the Chandra observation – indicating the burst source to still be active. The RXTE all sky monitor (ASM) light curve of M15 does not show any transient outburst or unusual behavior around the time of the Chandra and RXTE observations. The 5yr long ASM light curve is relatively steady, suggesting that the source is long lived and not highly variable. There are short outbursts in the ASM every days, but they occur when the source passes close to the sun and are probably caused by sun glint on the detector collimator upsetting the solutions. It is interesting to note that the original position from the Einstein HRI (HG83) lies closer to that of M15-X2, than AC211, and that the search for the optical counterpart by Auriere at al. (1984) used a circle of , the standard HRI 90% confidence error circle. The ROSAT HRI archival images from the mid-1990s appear somewhat elongated in the East-West direction – suggesting the M15-X2 source may have been present.
3 Discussion
This is the first time that two LMXBs have been seen to be simultaneously active in a globular cluster associated with our Galaxy. The separation of is less than the resolution of previous X-ray telescopes. It is only with the superb quality imaging of the Chandra X-ray Observatory that 4U2127+119 can be resolved into two sources. The new X-ray source M15-X2 is 2.5 times brighter than AC211 and associated with a faint U magnitude blue star, characteristic of a LMXB. It is 3.4 arc from the center of M15 (Figure 1c). The discovery of a second active LMXB in M15 provides a simple explanation for the apparently schizophrenic properties of 4U2127+117 – M15-X2 is the source of the X-ray bursts, not the ADC dominated AC211. The presence of a second source also resolves why the spectrum of 4U2127+119 is unusually complex (SPO). The X-ray continuum spectrum of M15-X2 is a power law with a photon index of and a luminosity of ergs s-1, both typical of LMXBs that show X-ray bursts. RXTE and archival data suggests that the 2nd source may have been present over the entire past 20 yr. This confirms earlier suspicions that two sources could explain the conflicting properties of 4U2127+117 (Grindlay 1992, 1993; Charles, van Zyl & Clarkson 2001). The ADC model to explain the X-ray and optical properties of AC211 is now self consistent. The X-ray spectrum of AC211 alone is harder and resembles that of the classic ADC source 4U1822-371 (White et al. 1981; White, Kallman and Angelini 1997). The average X-ray luminosity of AC211 is really one third lower than previously thought. This both increases the amplitude of the orbital modulation and reduces the luminosity – strengthening the analogy with 4U1822-371 (White and Holt 1982).
The ratio of LMXBs to stellar mass is more than two orders of magnitudes higher for globular clusters than it is for the rest of the Galaxy (Clark 1975). This overabundance of LMXBs led Fabian, Pringle & Rees (1975) to propose that the LMXBs in globular clusters are formed via tidal capture of neutron stars in close encounters with main-sequence or giant stars, a mechanism that operates efficiently in the high stellar density found in globular clusters. Hut, Murphy and Verbunt (1991; HMV) discuss the probability of finding one or more LMXBs in any particular globular cluster. This depends strongly on how many neutron stars stay in the cluster after they are born and the lifetime of the LMXBs. In general these calculations suggest that more than one LMXB should be found in a globular cluster. The fact that so few LMXBs in globular clusters are observed has required either short lifetimes (HMV) or larger fractions of neutron stars ejected from the globular cluster (Verbunt and Hut 1987). The large number of millisecond radio pulsars found in globular clusters, thought to be the remains of a LMXB systems, also points to many LMXBs having been active in the past (see HMV). Chandra observations of other GCs have revealed faint sources some of which may be a transient LMXB in quiescence, suggesting that there are more LMXB in a single GC (e.g. Grindlay at al. 2001). This discovery of two active LMXBs in M15 moves the observations in the right direction with respect to the theory and number of radio pulsars, especially given the small number of globular cluster systems in our Galaxy with active LMXBs.
Chandra X-ray observations of nearby galaxies have identified many point X-ray sources with globular clusters (Sarazin, Irwin, & Bregman 2001, Angelini, Loewenstein, & Mushotzky 1991). Many of these GC sources have a luminosity above the Eddington limit for accretion onto a neutron star. Angelini et al. (1991) have suggested that some of these high luminosity systems may be due to multiple LMXBs being active in some GC systems. The discovery of two LMXBs active at the same time in M15 adds weight to that argument.
Acknowledgements. We recognize the critical contribution of Cynthia Hess, the original principle investigator for this observation. We thank Ian George and Roy Kilgard for help with the grating analysis, Brian Yanny for providing an HST image of M15, Phil Charles for discussions on the optical counterpart, Robin Corbet for advice on the RXTE ASM and Josh Grindlay, Peter Edmonds and Sergio Ilovaisky for comments on the manuscript. This research made used of data extracted from the HEASARC, MAST and CDS.
References
- Angelini et al. (2001) Angelini, L., Loewenstein, M., & Mushotzky, R. F., 2001, ApJ, 557, L35
- Auriere (1984) Auriere, M., le Fevre, O. , & Terzan, A. 1984, A&A, 138, 415
- Charles (1986) Charles, P.A., Jones,D.C., & Naylor, T., 1986, Nature , 323, 417
- Charles (1991) Charles, P.A., Clarkson, W.I., & van Zyl, L, 1991, New Astr. submitted
- Clark (1975) Clark , G.W., 1975, ApJ, 199, L143
- De Marchi & Paresce (1994) De Marchi, G., & Paresce, F., 1994, AJ, 422, 597
- Dotani (1990) Dotani,T., et al., 1990, Nature, 347,534
- Fabian, Pringle, and Rees (1975) Fabian,A. C., Pringle,F.E., & Rees, M.J. , 1975, MNRAS, 172, 15p
- Geffert (1992) Geffert, M., Auriere, M., Requieme,Y.,& Mazurier, J-M., 1994, A&A, 282, 989
- Grindlay (1992) Grindlay, J.E. 1992, in ”X-ray Binaries and Recycled Pulsars” (Ed. E. van den Heuvel & S. Rappaport), Kluwer, NATO ASI Series, 377, 365
- Grindlay (1993) Grindlay, J.E. 1993, ASP Conf Ser., 48, 1993
- Grindlay (2001) Grindlay, J.E., Heinke, C., Edmonds, P.D. and Murray, S.S. 2001, Science, 292, 2290
- Guhathakurta (1996) Guhathakurta, P., Yanny, B., Schneider, D.P., & Bahcall, J.N., 1996, AJ, 111,267
- Harris (1996) Harris, W.E., 1996, AJ, 112,1487
- Hertz (1987) Hertz, P., 1987, ApJ, 315,119 [H87]
- Hertz & Grindlay (1983) Hertz, P., & Grindlay,J.E, 1983, ApJ, 275, 105 [HG83]
- Hut, Murphy & Verbunt (1992) Hut, P., Murphy,B.W., & Verbunt, F.,1991, A&A, 241,137 [HMV]
- Ilovaisky (1987) Ilovaisky, S.A., Auriere, M., Kock-Miramond, L., Chevalier, C., & Cordoni, J.P., 1987, A&A, 179, L1
- Ilovaisky (1993) Ilovaisky, S.A., Auriere, M., Kock-Miramond, L., Chevalier, C., Cordoni, J.P., & Crowe, R.A., 1993, A&A, 270, 139 [I93]
- Kulkarni (1990) Kulkarni, S.R., Goss,W.M., Wolszczan, A., & Middleditch, J.M., 1990, ApJ, 363,L5
- Nylon et al. (1988) Nylon, T., Charles, P.A., Drew, J.E., & Hassall, B.J.M., 1988, MNRAS, 233,285
- Sarazin, Irwin, & Bregman (2001) Sarazin, C. L., Irwin, J. A., & Bregman, J.N. 2001, ApJ, in press
- Sidoli, Parmar, Oosterbroek (1997) Sidoli, L., Parmar, A. N., & Oosterbroek, T., 2000, A&A, 360, 520 [SPO]
- Smale (2001) Smale, A.P. 2001, ApJ, in press
- Van Paradijs et al. (1990) Van Paradijs, J., Dotani, T., Tanaka, Y., & Tsuru, T., 1990, PASJ, 42, 633
- Van Paradijs et al. (1996) Van Paradijs, J., & McClintock, J.E., 1996,X-ray binaries, ed. W.H.G Lewin, J. van Paradijs & E.P.J. van den Heuvel, Cambridge University Press, 126
- Verbunt, van Paradijs, J. & Elson (1984) Verbunt, F., & Hut, P., 1987, The Origin and Evolution of Neutron Stars, Proceedings of the IAU Symposium, Nanjing, People’s Republic of China, May 26-30, 1986, eds D. J. Helfand and J.-H. Huang, Dordrecht, D. Reidel Publishing Co. (IAU Symposium, No. 125), 187
- White et al. (1981) White, N. E.,Becker, R. H.,Boldt, E. A., Holt, S. S., Serlemitsos, P. J., & Swank, J. H., 1981, ApJ, 247,994
- White,& Holt (1982) White, N. E., & Holt, S.S., 1982, ApJ, 257, 318
- White et al (1997) White, N. E., Kallman, T.R., & Angelini, L., 1997, X-ray Imaging and Spectroscopy of Cosmic Hot Plasmas, ed. F.Makino & K. Mitsuda, Universal Academy Press, 411