Infrared Colors of L and T Dwarfs
Abstract
We discuss the behaviour of the colors of L and T dwarfs, based on new photometric and spectroscopic data obtained at the United Kingdom Infrared Telescope in Hawaii. We have measured the first accurate photometry for L and T dwarfs. The – colors of T dwarfs are much bluer than predicted by published models, suggesting that CO may be more abundant than expected, as has been found spectroscopically for the T6 dwarf Gl 229B. We also find that – increases monotonically through most of the M, L, and T subclasses, but it is approximately constant between types L6 and T5, due to the onset of CH4 absorption at the blue edge of the bandpass. The colors of L dwarfs show significant scatter, suggesting variations in the amount and properties of photospheric dust, and indicating that it may not be possible to associate a unique Teff with a given L spectral type. The colors of the later T dwarfs also show some scatter which we suggest is due to variations in pressure–induced H2 opacity, which is sensitive to gravity (or age for a brown dwarf) and metallicity.
1. Introduction and Photometric Systems
This work is based on papers by Leggett et al. (2001) and Geballe et al. (2001a). Geballe et al. present a spectral classification scheme for L and T dwarfs (summarised elsewhere in these proceedings) and Leggett et al. present photometry of a sample of 58 late–M, L, and T dwarfs. The L and T dwarfs in these papers are primarily taken from recent results of red and near–infrared imaging sky surveys — the Deep Near–Infrared Survey (DENIS, e.g. Martín et al. 1999), the 2 Micron All–Sky Survey (2MASS, e.g. Kirkpatrick et al. 1999) and the Sloan Digital Sky Survey (SDSS, e.g. York et al. 2000). The data presented in this work were obtained at the United Kingdom Infrared Telescope (UKIRT) in Hawaii.
Figure 1 shows , and colors as a function of spectral type, where the type is taken from Geballe et al. (2001a). Section 2 discusses the 1—2.5 m colors of L and T dwarfs — (1.25 m), (1.65 m) and (2.2 m). Section 3 discusses the longer wavelength 3—5 m colors — (3.8 m) and (4.7 m).

The infrared passbands are constrained by the transmission of the terrestrial atmosphere. Unfortunately, historically, there has not been a consensus on the exact specifications of the filters used by different observatories. Recently a group led by A. Tokunaga has defined a set of infrared filters well matched to the atmosphere (Simons & Tokunaga 2002, Tokunaga & Simons 2002); these filters are being widely adopted and are known as the Mauna Kea Observatory (MKO) filter set. The colors in Figure 1 are on this system. Note that differences between colors measured on different photometric systems can be significant, especially in the case of T dwarfs, and colors available in the literature should not be compared without transforming between systems. This is discussed further in Sections 2 and 3.
2. 1—2.5 m Colors ()
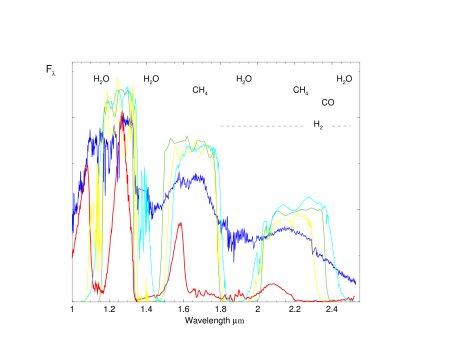
Figure 2 shows the observed 1—2.5 m flux distributions of an L and a T dwarf, with the important absorbing molecular species indicated along the top of the figure (see also the paper by Burgasser et al. in these proceedings, and Burgasser et al. 2001). We have overlaid , and filter profiles from three photometric systems: 2MASS, UKIRT (prior to adoption of the MKO filters) and MKO. Note the significant differences between the filters and the very structured energy distributions within the bandpasses, especially for the T dwarfs. While differences between measured magnitudes on these systems are only around 5% for L dwarfs, for T dwarfs the difference at is 10% and at it is 30%.
Methane (CH4) absorption in the K band becomes important for spectral types L8 and later, and in the H band for types T0 and later (Geballe et al. 2001a). Hence the and colors become increasingly blue for the latest spectral types, as can be seen in Figure 1. Figure 1 also shows that while trends are apparent between color and type, for the L3—L8 dwarfs there is a large scatter in and as a function of type. The scatter is much larger than the measurement error, indicated by the error bar in the figure.
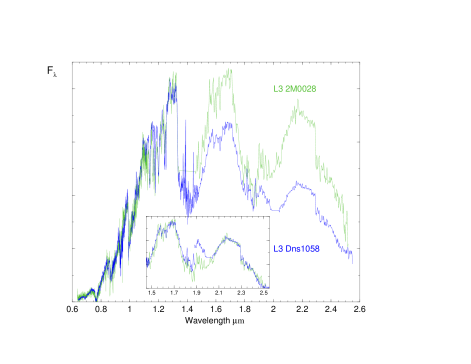
Figure 3 explores this observed scatter further by superimposing the energy distributions of two objects both classified as L3; it can be seen immediately that they have very different color. However the inset shows that if the H and K spectral segments are separately scaled and overlaid, the agreement is excellent. That is, the slope of the red continuum, the wings of the water (H2O) bands, and the depth of the carbon monoxide (CO) band all match and so indeed the objects are both L3 types. The difference in color is probably due to another important opacity source not yet mentioned: dust. At the temperatures of these photospheres, around 2000 K, grains are expected to form. This is discussed further by Marley et al. in these proceedings (see also Ackerman & Marley 2001 and Allard et al. 2001). This dust is expected to cause a warming of the photosphere and a redistribution of flux to the infrared. The scatter in color may indicate varying dust properties caused by differences in metallicity (which affects dust abundance), age (which limits settling time) and rotational velocity (which may inhibit dust settling). Detailed models are required before we can understand how dust can change the overall color of an L dwarf without affecting the dominant spectroscopic features.
Note also how very different the radiated energy is for these two L3 dwarfs over this wavelength range. One effect of the dust may be that a unique effective temperature cannot be associated with a given L spectral type. Bolometric magnitudes are needed to investigate this further.
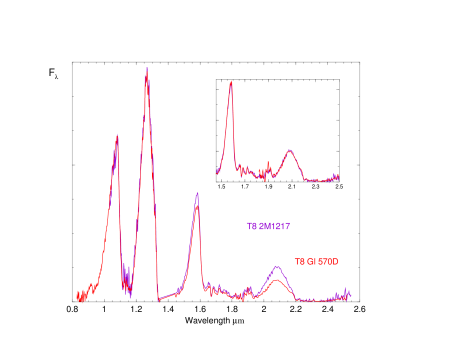
Figure 1 shows there is also some scatter in the colors of the later T dwarfs. Figure 4 shows the relative flux distributions of two T8 dwarfs superimposed; the inset shows the H and K regions scaled separately. Again it can be seen that although the overall color is different, the H2O and CH4 absorptions match well, and they are both therefore classified as T8. At the effective temperatures of these atmospheres, around 1000 K, grains are expected to lie below the photosphere, and the absorption bands of CH4 and H2O are close to saturation. One opacity source that is still important is pressure–induced molecular hydrogen (H2) absorption, which is an extremely broad feature that spans both the H and K bands but is strongest at K (see e.g. Borysow et al. 1997). The strength of this opacity is sensitive to gravity (or age, for a brown dwarf) and metallicity, and we suggest that the scatter seen in the K band colors of late T dwarfs is due to variations in these parameters.
3. 3—5 m Colors ()
Figure 5 shows the 3—5.5 m calculated energy distribution for two model atmospheres with effective temperatures appropriate for an L dwarf and a T dwarf. The observed flux distribution for a T dwarf is also shown. The principal absorbing species are indicated along the top of the figure and filter profiles are overlaid. The MKO and filter bandpasses are shown, as well as the earlier UKIRT profile and a wider profile.
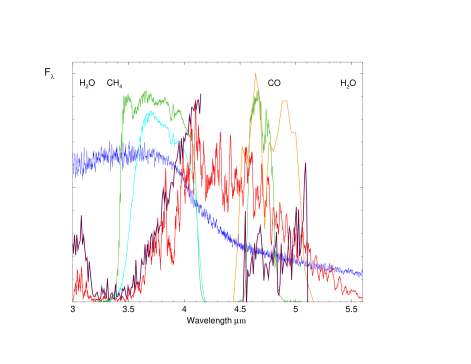
In the L band the important opacity sources are H2O and CH4. Noll et al. (2000) have shown that the 3.3 m band of CH4 is detected for spectral types around L5 and later. Figure 1 shows that our colors are almost constant for types L6 to T5 most probably due to the onset of this absorption feature at the blue edge of our bandpass. For later types the band is saturated and can increase again. Differences in the L′ bandpass can lead to magnitudes that differ by 20% for T dwarfs (see also Stephens et al., these proceedings and Stephens et al. 2001).
In the M band it can be seen that the model spectrum (red line) does not agree with the observed spectrum (maroon line). Noll et al. (1997) show that the shape of the observed Gl 229B spectrum indicates the presence of the fundamental vibration–rotation band of CO in this T6 dwarf. This is unexpected as at these temperatures all the carbon is expected to be in the form of CH4. Possibly CO is being dredged up from hotter, deeper, layers of the atmosphere.
, : Model Comparison