Properties of Relativistic Jets in Gamma-Ray Burst Afterglows
Abstract
We extend our calculation of physical parameters of GRB jets by modeling the broadband emission of the afterglows 970508, 980519, 991208, 000926, 000418, and 010222. Together with 990123, 990510, 991216, and 000301c, there are ten well-observed afterglows for which the initial opening angle of the GRB jet can be constrained. The jet energies (after the GRB phase) obtained for this set of afterglows are within one decade around erg. With the exception of 000418, which requires a jet wider than 1/2 radians, the jet initial half-angle in the other cases ranges from to . We find that, in half of the cases, a homogeneous ambient medium accommodates the afterglow emission better than the wind-like profile medium expected around massive stars. The two types of media give fits of comparable quality in four cases, a wind medium providing a better description only for 970508. The circumburst densities we obtain are in the range, with the exception of 990123, for which it is below . If in all ten cases the observed GRB durations are a good measure of the ejecta deceleration timescale, then the parameters obtained here lead to jet initial bulk Lorentz factors between 70 and 300, anticorrelated with the jet initial aperture, and jet masses around . Our results on the jet energy, opening Lorentz factor, and evacuation of material until break-out provide constraints on theoretical models of GRB jets.
Dept. of Astrophysical Sciences, Princeton University, Princeton, NJ 08544
and Institute for Advanced Study, Olden Lane, Princeton, NJ 08540
Subject headings: gamma-rays: bursts - ISM: jets and outflows - methods: numerical - radiation mechanisms: non-thermal - shock waves
1 Introduction
The localization of Gamma-Ray Bursts (GRBs) to within a few arc-minutes by the Italian–Dutch satellite BeppoSAX, the Interplanetary Network, and the Rossi–-ray Transient Explorer have enabled us to carry out ground-based follow-up searches for afterglow emission. The current database of multiwavelength (radio, millimeter, optical, and -ray) observations allows us to begin a statistical study of the physical properties of GRB afterglows.
This is a third in a series of papers modelling the broadband emission of GRB afterglows, with the aim of determining the total energy in the relativistic ejecta, the jet opening angle, the density and profile of the medium in the immediate vicinity ( cm) of the burst, and the microphysical shock parameters. The first paper (PK01) has presented the modelling of the afterglows 990123, 990510, and 991216 while the second (Panaitescu 2001) analyzed the peculiar afterglow 000301c, whose emission fall-off exhibited a sharp break. Here we present our results for the afterglows 970508, 980519, 991208, 000926, 000418, and 010222. With the exception of 000418, after 1 day the decay of their optical emission is steep or exhibits a steepening, as expected if the GRB ejecta are well collimated (Rhoads 1999), thus their modelling allows the determination of the jet aperture and energy. Section §2 outlines the model used to fit the broadband emission of these afterglows. The jet properties inferred for individual afterglows are presented in §3 and the results for the entire set are analyzed in §4.
2 The Afterglow Model
2.1 Model Features
The calculation of the afterglow emission is carried out in the standard framework of relativistic ejecta decelerated by an external medium (Mészáros & Rees 1997), with allowance for the effects due to collimation (Rhoads 1999). The equations governing the dynamics of jet–medium interaction and those for the calculation of the synchrotron and inverse Compton emission are presented in KP00, PK00 and PK01. Similar analytical treatments of jet dynamics and/or emission of radiation can be found in Waxman (1997), Granot, Piran & Sari (1999), Gruzinov & Waxman (1999), Wijers & Galama (1999), Chevalier & Li (2000), and Sari & Esin (2001). The effect of interstellar scintillation on the radio afterglow emission (Goodman 1997) is taken into account following the treatment of Walker (1998).
In our treatment, the afterglow modelling has the following features:
the jet is considered uniform, with an energy per solid angle independent of direction within
the jet;
the shocked gas internal energy density is assumed uniform;
the jet dynamics is calculated by following the evolution of its energy (which decreases
due to radiative losses), mass (increasing, as the jet sweeps-up the surrounding medium),
and aperture (which increases due to jet expansion in the comoving frame). The equations
employed are accurate in any relativistic regime;
the afterglow emission is calculated by integrating over the jet dynamics the synchrotron and
inverse Compton radiation, taking into account the spread in the arrival time of photons emitted
at a given radius. The Compton parameter and its evolution are calculated from the electron
distribution;
the shock-accelerated electron distribution is assumed a power-law in the random electron Lorentz factor , starting from a minimum
up to a high energy break ;
the fractional energy in electrons and magnetic field are constant throughout the jet
deceleration;
in general, the observer is assumed to lie on the jet axis. For our jet model, observer
off-sets lower than the jet initial aperture produce insignificant changes in the resulting
light-curve (see Granot et al. 2002), and therefore in the fitting parameters.
2.2 Model Parameters and Their Determination
The model has three parameters that give the jet dynamics: the initial jet energy , initial half-angle , and external particle density (or the constant for a wind-like density profile111 This constant is proportional to the ratio between the mass loss rate of the star which ejects the wind and the speed of this wind. We denote by the value of the constant relative to that corresponding to ejected per year at a speed of 1000 km/s. ), and three parameters related to the microphysics of shocks: the fraction of the post-shock energy density in magnetic fields, the fractional energy in electrons if they all had the same Lorentz factor , and the power-law index . For , there are two additional parameters: the fractional energy of the electrons between and , which parameterizes , and the power-law index of the electron distribution above (for simplicity the cut-off above is assumed to be a power-law). In some cases, the curvature of the optical spectrum or consistency between the optical and -ray afterglow emission indicates a significant dust extinction in the host galaxy. This is taken into account by assuming an SMC-like reddening curve and adding an extra model parameter, the extinction in the host rest-frame. We note that the initial jet Lorentz factor has little effect on the afterglow emission and is not considered a free model parameter.
The spectrum of the afterglow synchrotron emission (Sari, Piran & Narayan 1998) has breaks at the self-absorption frequency , injection frequency corresponding to the minimum electron , cooling frequency corresponding to the electron Lorentz factor for which the radiative timescale equals the dynamical time, and cut-off frequency associated with . Generically, the afterglow emission can be written as
| (1) |
where the exponent is non-zero for all break frequencies between the observing frequency and the frequency at which the synchrotron spectrum peaks, being the flux at . For a relativistic spherical outflow and an adiabatic expansion, the break frequencies and peak flux are given by:
| (2) |
where is the afterglow redshift, is the fireball energy in erg, the external medium density y in , and have been normalized to 0.1 and 0.01 respectively, is the observer time measured in days, and is the burst luminosity distance measured in cm. Similar equations can be derived for spreading jets, non-relativistic GRB remnants, or non-adiabatic expansion.
As illustrated in equation (1), the afterglow light-curve at a given frequency is given by the evolution of , , , , and which, for constant parameters , and , are determined by the Lorentz factor of the jet, its radius , and external density profile . For a relativistic jet and negligible radiative losses, conservation of total jet energy leads to and in the case of a homogeneous medium and , for a wind external medium, before the time
| (3) |
when the jet transits between a quasi-spherical expansion and a lateral spreading dominated one 222 This is also the time when the jet Lorentz factor equals the reciprocal of the jet half-angle, thus the radiation emitted from the jet edge is no longer relativistic beamed away from the observer.. In equation (3) the initial jet energy measured in erg and the initial jet half-opening measured in 0.1 radians. After the jet dynamics is described by and (to “zeroth order”) constant. The resulting evolution of the afterglow spectral characteristics in these two asymptotic regimes are summarized in Table 1, together with the afterglow light-curve at frequencies above , for slowly cooling electrons, i.e. , and for Compton parameter below or above 1, i.e. electron cooling due to synchrotron losses or up-scatterings, respectively.
Because the afterglow light-curve decay depends only on the index of the electron distribution (or above ), this index can be easily determined from observations if one knows the location of and relative to the observing frequency. For measurements made more than a few hours after the GRB, the injection frequency is below the optical domain, thus the only uncertainties are related to . Consistency between the decay indices given in Table 1 and the slope of the synchrotron power-law optical spectrum , where
| (4) |
is commonly used to determine both and the location of relative to the optical domain.
Finding the remaining parameters, five if the high frequency cut-off is above the highest observing frequency, seven in the opposite case, is conditioned by the localization of the spectral breaks at some time (not necessarily the same for all breaks), either from the afterglow flux at two frequencies bracketing a given break, or from the passage of that break through an observing band. If we know , , and from observations, inverting the set of equations (2) above allows the calculation of , , and . Then, if the afterglow decay exhibited a steepening which can be identified as the “jet-break”, equation (3) gives the initial jet aperture . Together with , this allows the calculation of the jet initial energy .
In general the above method cannot be readily used to other afterglows because the locations of and are not sufficiently constrained by the available data. For instance, evidence for self-absorption at radio frequencies exists only for the afterglows 970508, 991208, 000301c and, perhaps, 991216. Furthermore, the approximations usually made in analytical treatments of the afterglow emission (e.g. Waxman 1997, Wijers & Galama 1999, PK00, Sari & Esin 2001) are accurate only over a limited time interval. Various departures from those approximations, such as moderately relativistic jets, with of several, jets transiting between quasi-collimated and lateral-spreading expansion, electron radiative cooling not dominated by a single emission process (synchrotron or inverse Compton), afterglow spectral breaks smoothed by the differential relativistic boost and photon arrival-time over the jet surface, time changing ordering of the spectral, during the afterglow evolution, require numerical calculations to yield a more reliable determination of jet parameters.
3 Collimated Afterglows
The model outlined above was used to model the broadband emission of ten afterglows to determine the parameters , , (or for a wind), , , and (plus , and in those cases where they are relevant) by -minimization. Nine of these afterglows (970508, 980519, 990123, 990510, 991208, 991216, 000301c, 000926, and 010222) were selected based on the existence of a break in (or a steep decay of) the optical light-curve, allowing the calculation of the jet initial opening, and sufficient broadband observations to make the modelling meaningful. The 000418 afterglow has been added due to its good multiwavelength coverage, although its emission does not exhibit a signature of a jet-break.
In calculating the afterglow optical fluxes we assumed a 5% error in the magnitude-to-flux conversion and Galactic reddening and we subtracted the reported contributions of the host or contaminating galaxies. -ray fluxes have been calculated from the reported band fluxes (2–10 keV, usually) and -ray spectral slopes.
The modelling of the afterglows 990123, 990510, 991216, and 000301c is presented elsewhere (PK01, Panaitescu 2001). The use of a larger set of -ray measurements for the 990123 afterglow (Costa 1999) and the reduction of the assumed error in the Galactic extinction of the optical emission of 991216 from 10% to 5%, led in these two cases to small changes in the best fit parameters. Below we discuss the features of the broadband emission and the modelling of the remaining six afterglows.
3.1 GRB 970508
During the first day after the burst, the optical emission of 970508 exhibits a brightening by more than one magnitude, lasting for about 1 day, followed by a long-lived decay of temporal index (Sokolov et al. 1998). Simultaneous with the brightening, Galama et al. (1998b) observe a reddening of the optical spectrum, the slope changing from at 1 day to at days. They interpret the softening of the optical spectrum as the passage of the cooling frequency , thus the latter implies .
The radio emission of this afterglow has been monitored for about 1 year. Frail, Waxman & Kulkarni (2000b) report that the slope of the radio spectrum evolved from before 80 days to an average after 100 days, which must be due to the passage of the injection frequency . Therefore the latter implies that , as the radio domain is expected to lie below . After 100 days, the radio emission decayed as a power-law of index (Frail et al. 2000b), which, given the above and that after the jet-break time, suggests that the days, if the assumption of relativistic motion is still correct.
In order to have an observational constrain on the jet initial opening, we make the assumption that the brightening seen at 1 day is due to an observer location which, initially, is outside the jet (i.e. ). In this case, the observer will see a rising light-curve when the jet has decelerated down to a Lorentz factor , for which the radiation from the nearest part of the jet becomes visible to the observer. We also assume that the GRB and the dimmer afterglow emission prior to the brightening were due to some less energetic ejecta located outside the main jet and moving toward the observer, but ignore their effect on the dynamics of the jet and afterglow emission after 1 day.
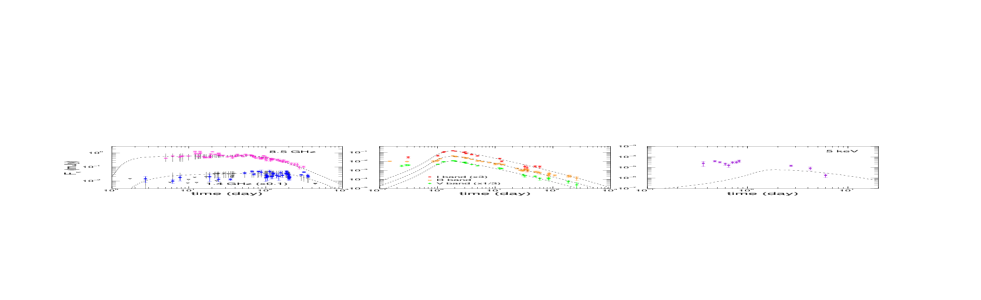
The parameters of the best fit to the radio (Frail et al. 2000b), millimeter (Bremer et al. 1998), optical (Sahu et al. 1997, Galama et al. 1998a, Pedersen et al. 1998, Sokolov et al. 1998, Zharikov et al. 1998), and -ray (Piro et al. 1998) emission of 970508 after the onset of the brightening phase, obtained with a homogeneous external medium, are given in Table 2. The observer is located at . The fit is not satisfactory (thus we do not determine confidence intervals), exhibiting a slower brightening and weaker -ray emission than observed. The jet isotropic equivalent energy derived by Wijers & Galama (1999) for the 970508 afterglow from its spectrum at 12 days is twice smaller than our value333 For the and given for 970508 in Table 2, radiative losses are significant (80% until around 10 days), thus the jet energy we infer is likely to exceed that obtained by other researchers using adiabatic models for the jet dynamics while their value for is twice larger. The largest discrepancies are in , our value being 25 times larger than theirs, and in for which we find a value five times larger. From the same 12 day spectrum of 970508, Granot et al. (1999) found 15 times smaller, four times larger, and three times smaller than our values, and a similar . Through an analytical treatment of the radio emission of 970508, Frail et al. (2000b) inferred a jet energy 4 times smaller than obtained by us, electron and magnetic parameters close to equipartition and , close to our results.
A significantly better fit can be obtained for a wind-like external medium. This fit, shown in Figure 1, has erg, , , , , , , and for 279 degrees of freedom (dof). Although it describes well the rise of the optical emission, it does not accommodate the -ray emission during the brightening. Using a spherical model, Chevalier & Li (2000) estimated similar values for and , and and twenty and seven times smaller, respectively.
The spectral properties of the best fit models discussed above are similar. In both cases the injection frequency is slightly below the optical domain at 1 day444 Due to the off-axis location of the observer, the passage of through the optical occurs later than predicted by eq. (2) , its evolution yielding the spectral softening observed by Galama et al. (1998b). At days, passes through the radio domain, as inferred from observations by Frail et al. (2000b).
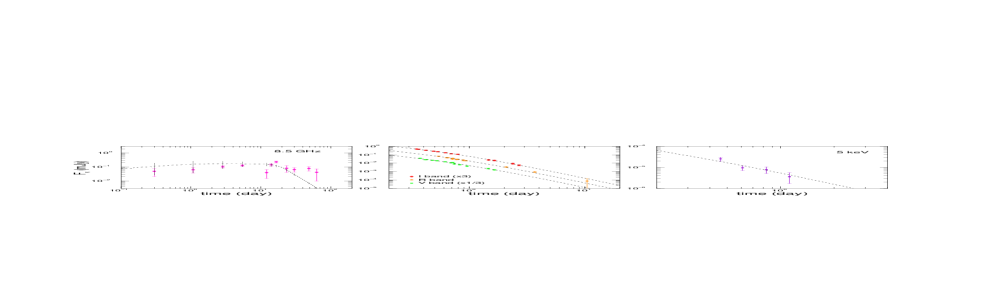
3.2 GRB 980519
The optical emission of this afterglow had a break of magnitude at day, with a temporal index (Jaunsen et al. 2001) after the break, close to that measured in -rays, , at about 1 day (Nicastro et al. 1999). The equality of these two indices is consistent with the achromatic break expected in the jet model. At day the slope of the optical spectrum dereddened for Galactic extinction, (Halpern et al. 1999), is shallower than that measured by Nicastro et al. (1999) at about the same time in -rays, . The difference between the two slopes is close to that expected when is between optical and -rays but, given the their large uncertainties, does not provide a compelling proof.
Numerically we find that the radio (Frail et al. 2000a), optical (Vrba et al. 1999, Jaunsen et al. 2001) and -ray (Nicastro et al. 1999) emission of 980519 can be well accommodated by a spreading jet interacting with a homogeneous medium, and with between optical and -rays (Figure 2). The best fit with a jet interacting with wind medium has erg, , , , , , and for 46 dof. This model yields a shallower break than observed in the -band light-curve of 980519 and provides a poorer fit to the radio data.
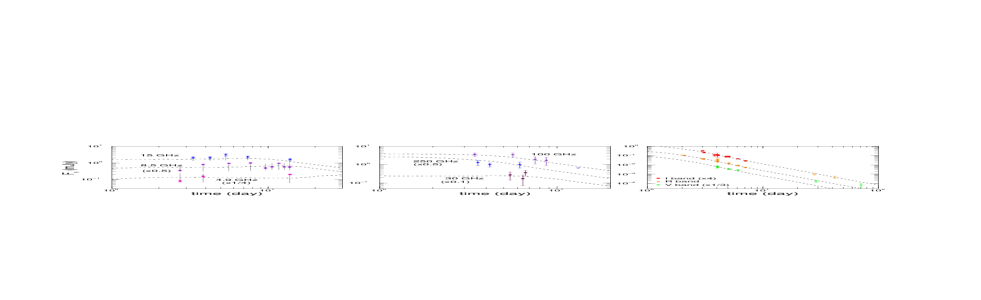
3.3 GRB 991208
The radio emission of this afterglow (Galama et al. 2000) exhibited a quasi-flat behavior until days (Figure 3), followed by a power-law decay (Galama et al. 2002) which is much shallower than the observed in the optical at 2–7 days (Castro-Tirado et al. 2001). The flatness of the early radio emission indicates that the frequency is above the radio domain and that either the external medium is homogeneous and the GRB remnant is a jet observed after (i.e. after the jet-break) or the ambient medium is wind-like and the GRB jet is seen before . This suggests that the steepening of the radio emission at 10 days is due to the -passage. Then the shallow radio decay after 10 days requires a hard electron distribution, , and the steep optical decay implies that the -break is below the optical domain.
The best fit to the data obtained with a jet interacting with a homogeneous medium is shown in Figure 3 and has the parameters given in Table 2. The spectral characteristics (break frequencies and peak flux) of the model afterglow emission are consistent with those obtained by Galama et al. (2000) by fitting the spectrum of 991208 at four epochs. The electron distribution cut-off at higher energy is characterized and .
The data can be fit equally well ( for 97 dof) with wind medium of and a jet with parameters erg, , , , , , and . The last five parameters above and the implied are similar to those determined by Li & Chevalier (2001).
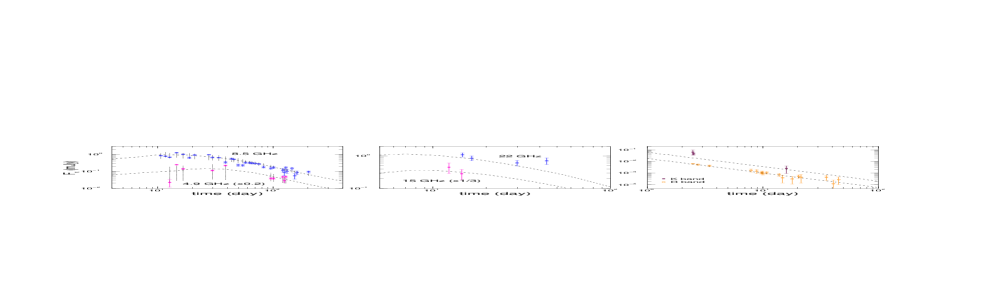
3.4 GRB 000418
The -band emission of this afterglow exhibited a flattening after only 10 days (Klose et al. 2000, Berger et al. 2001), indicating an underlying host galaxy. By fitting the optical light-curve with the power-law fall-off expected of GRB afterglows plus the constant contribution of the host, Berger et al. (2001) obtain a decay index . The 8.5 GHz radio emission exhibits a gradual steepening to a power-law of similar index, (Berger et al. 2001) after days, which, most naturally, is due to the frequency falling below the radio domain. The emission of the 000418 afterglow does not exhibit a steepening that can be attributed to the spreading of a jet, therefore its modeling should not constrain significantly the initial jet aperture.
Optical observations at other frequencies are rather scarce, making the determination of the optical spectral slope rather difficult. From the only two simultaneous and measurements at times when the afterglow emission is dominant, we infer (note that Klose et al. 2000 find a redder spectrum, with ). Then consistency between (Table 1) and (eq. [4]) suggests that the cooling frequency is below the optical range and/or there is a significant dust reddening within the host galaxy.
With our jet model, the best fit for this afterglow is obtained with a wide jet ( 1 radian) interacting with either a homogeneous medium or a wind. Table 2 lists the parameters in the former case, the model light-curves being shown in Figure 4. In the latter case, the best fit parameters are erg, , , , , and . The two models have and , respectively, for 61 dof. Taking the host extinction as a free parameter, does not improve the fits significantly. Compared to the parameters inferred by Berger et al. (2001), the above and are larger by a factor 100 and 10, respectively, is twice larger, is smaller by a factor 10-30, and the isotropic for the and above is smaller by a factor of a few. We note that jets narrower than 1/3 radians yield poorer fits, with for 61 dof, while acceptable fits can be obtained with spherical ejecta.
3.5 GRB 000926
The -ray emission (Piro et al. 2001) of this afterglow provided for the first time evidence (Harrison et al. 2001) that the -ray emission may be inverse Compton scatterings (PK00, Sari & Esin 2001). This is suggested by that the extrapolation of the optical spectrum, after dereddening for the host (intrinsic) extinction, falls below the observed -ray flux.
The optical emission of 000926 exhibited a break of magnitude at few days, with a post-break temporal index (Fynbo et al. 2001, Price et al. 2001). If interpreted as a jet break, it requires that , which would imply (eq. [4]) an optical spectrum significantly harder than observed at day: (Fynbo et al. 2001) or (Price et al. 2001). Within the fireball model, consistency between the optical spectral slope and temporal index requires a significant host extinction. From the curvature of the near infrared–optical spectrum, Fynbo et al. (2001) infer , corresponding to an extinction in the observer -band of magnitudes, thus the dereddened afterglow spectrum has an optical slope . Then equation (4) and imply that is below the optical domain.
For a homogeneous medium, the best fit obtained with a model with the above features (Figure 5) has parameters (table 2) that are close to those obtained Harrison et al. (2001), except and , for which we find values three times smaller and eight times larger, respectively. The best fit model with a wind medium has for 102 dof, yielding radio fluxes larger than observed, and parameters erg, , , , , and . Note, however, that Harrison et al. (2001) found a significantly better fit ( for 114 data points) for a wind medium.
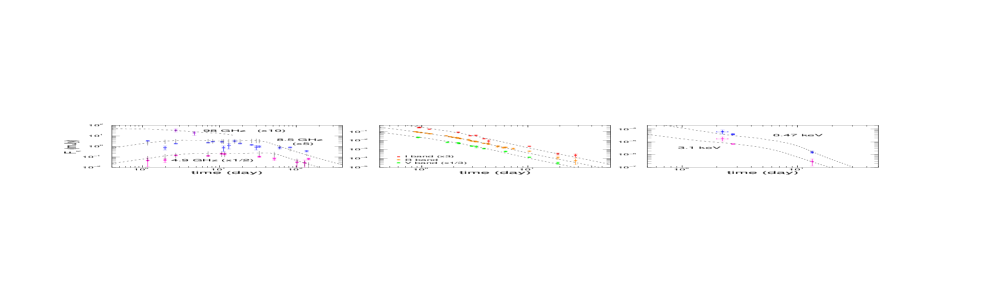
3.6 GRB 010222
The index of the power-law decay of the optical emission of 010222 steepened by at about 0.5 days, to (Masetti et al. 2001, Stanek et al. 2001), a value similar to that seen in the -rays, (’t Zand et al. 2001). The jet interpretation of this break requires an electron distribution with . As in the case of 991208, a hard electron distribution lowers the cut-off frequency sufficiently to yield a break of the afterglow decay when passes through of the observing band. This provides a natural explanation for the second steepening observed in the optical after 10 days by Fruchter et al. (2001) (see also http://www.stsci.edu/ fruchter/GRB/010222).
The low index required by the jet interpretation of the first break also implies an intrinsic optical spectrum harder than , i.e. harder than observed: (Jha et al. 2001, Lee et al. 2001), indicating the existence of a significant dust reddening in the host galaxy. The best fit we found to the radio (Berger & Frail 2001), optical (Cowsik et al. 2001, Masetti et al. 2001, Sagar et al. 2001, Stanek et al. 2001) and -ray (’t Zand et al. 2001) data has and a large for 87 dof. More than half of this arises from 8 optical and -ray data, suggesting either that some reported observations have underestimated uncertainties or that there are short timescale fluctuations in the afterglow emission (Cowsik et al. 2001). The jet model presented in Figure 6 faces also another problem: even if electrons acquire 100% of the post-shock fluid energy, the passage of through the -ray domain takes place too early, at about 1 day, leading to a discrepancy between the last few -ray data and the model expectations. Given the unsatisfactory fit provided by this model, we do not include in Table 2 the uncertainties of the best fit parameters.
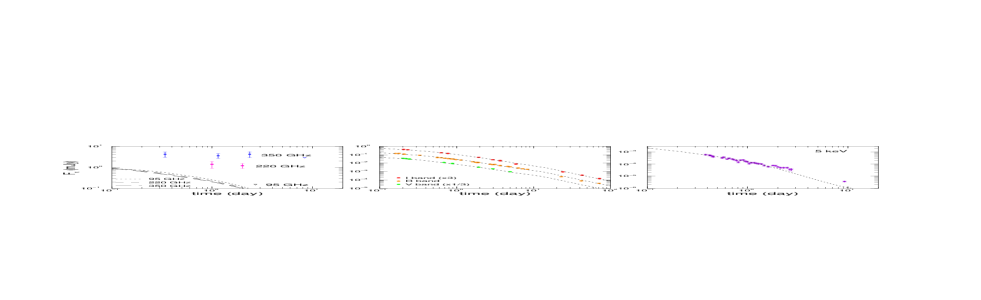
As shown in Figure 6, the millimeter model emission falls below the detections reported by Fich et al. (2001) and Kulkarni et al. (2001) at 220 GHz and 350 GHz, and below the upper limit on the 95 GHz emission found by Bremer et al. (2001). The constancy of the observed fluxes over almost one decade in time and the steep spectrum between 220 GHz and 350 GHz are hard to accommodate within the jet model, suggesting that the millimeter excess seen in 010222 is due to a dusty, star-forming host galaxy (Kulkarni et al. 2001). These data were not included in our fits.
The best fit obtained with a wind-like medium has a similar large for 87 dof, and parameters erg, , , , , , and . It provides a better description of the last -ray measurements than the homogeneous medium model, but a poorer one for the decay steepening seen in the optical at 0.5 days, as jets interacting with winds yield long-lived, smooth light-curve breaks (KP00). The millimeter emission in the wind model is also consistent with the 95 GHz upper limit and falls below the 220 GHz and 350 GHz detections.
4 Jet Properties
4.1 Jet Energy
For eight of the ten GRBs jets whose basic parameters are listed in Table 2, the ejecta kinetic energy at the beginning of the afterglow phase is between and erg. A narrow distribution of the jet kinetic energy has also been inferred by Piran et al. (2001) for a larger set of afterglows, based on the width of the observed -ray luminosity distribution at 0.5 days. Note, however, than the jet energy for the 970508 and 000418 afterglows is significantly larger, being around ergs.
The initial half-angle of the jet is correlated with : excluding 000418, for which we find and much larger than for the other afterglows, their linear correlation coefficient is , i.e. a 5% probability of obtaining this correlation by chance.
The -ray energy output for our set of afterglows, calculated from the -corrected isotropic-equivalent of the GRB emission in the 20–2000 keV obtained by Bloom, Frail & Sari (2001) and the jet aperture resulting from afterglow modeling, i.e. , are listed in Table 3. We find that, excluding 000418, for which the jet opening is much larger than for the other cases analyzed here, the dynamical range of is 30, i.e. a factor 3 larger than obtained by Frail et al. (2001) after determining the jet aperture from the jet-break time (eq. [3]).
Table 3 also shows the resulting 20–2000 keV GRB efficiency555 No value is given for GRB 970508, as we interpreted its afterglow emission arising from a jet seen from outside its initial opening, i.e. not from the same ejecta that has produced the GRB emission defined by . Note that, with the exception of 980519, is larger than 50%, most likely exceeding the ability of internal shocks to channel the dissipated energy into the 20–2000 keV band. This suggests that, during the GRB phase, jets are inhomogeneous on angular scales smaller than , such that we are biased toward observing bursts whose outflow has a bright spot moving directly toward the observer or very close to the observer’s line of sight toward the GRB source (Kumar & Piran 2000). Then the true efficiency of the GRB is much smaller and the jet energy at the beginning of the afterglow phase is closer to the jet energy before the GRB phase (Piran et al. 2001).
4.2 External Medium
Our results show that models with a homogeneous medium can accommodate the broadband emission of all EIGHT afterglows, while wind-like medium is consistent with the observations in at most four cases. If our assumption regarding the jet uniformity is correct, then a GRB model involving a massive star is allowed in the remaining four cases only if there is a mechanism for homogenizing the wind surrounding the star prior to its interaction with the jet. Ramirez-Ruiz et al. (2001) have shown that the interaction between the wind of a Wolf-Rayet star and a circumstellar medium of leads to the formation of a quasi-uniform, hot shell of density , extending from cm up to cm. More tenuous (or colder) media could produce thicker and less dense shells, consistent with the range of densities found here.
The particle density given in Table 2 for homogeneous media range from values typical for the interstellar medium (970508, 980519, 990510, 010222) to those of diffuse hydrogen clouds (991208, 991216, 000301c, 000418, 000926). In one case (990123) we find an external density below , characteristic of a hot component of the interstellar medium or a galactic halo. A similar low density was also obtained for the afterglow 980703 (PK01). These values are 2–5 orders of magnitude smaller than those implied by the column densities inferred by Galama & Wijers (2001) for 970508, 980519, 980703, 990123, and 990510 from the absorption seen in their soft -ray spectra. Furthermore, external densities higher than inferred by us are expected if GRBs are related with the death of massive stars, as in the collapsar model (Woosley 1993, Paczyński 1998, MacFadyen & Woosley 1999). Our results are compatible with the above results/expectations if the gas in the vicinity of the GRB was evacuated prior to the jet ejection. Recently Scalo & Wheeler (2001) have pointed out that the supernovae and H II region winds occurring in a cluster of massive stars form “superbubbles” within giant molecular clouds, with local densities that range over few orders of magnitude, possibly being as low as , depending on the superbubble age, ambient medium and power input from supernovae.
4.3 Jet Lorentz Factor and Mass
The afterglow emission is only weakly dependent on the initial jet Lorentz factor , which determines the evolution of the radiative losses in the early afterglow. Thus cannot be directly constrained through afterglow modelling. However, the inferred jet parameters can be used to determine the jet Lorentz factor during the afterglow phase:
| (5) |
where the usual notation was used and is measured in seconds. Thus can be calculated if one knows when the afterglow began, i.e. the jet deceleration timescale . In a few bursts (Giblin et al. 1999, Tkachenko et al. 2000), soft -ray emission has been observed from the end of the GRB phase up to s, indicating that the external shock had already set in by the end of the GRB. In other cases (Pian et al. 2001, ’t Zand et al. 2001), no -ray emission has been detected after the GRB, suggesting that is larger then the burst duration. To constrain , we assume666 This assumption is also used for GRB 970508 although, in our interpretation of the brightening of its afterglow, the burst and afterglow emission arise from different ejecta. The inclusion of 970508 does not change the following conclusions regarding the jet initial Lorentz factor and mass that the observed GRB duration is a good measure of . Equation (5) shows that has a moderate dependence on , thus the error due to this assumption is, likely, not too large.
Table 3 lists the values of obtained for the best fit parameters given Table 2. As shown in Figure 7, varies between 70 and 300 and is anticorrelated with the jet initial opening angle. Their linear correlation coefficient corresponds to a 20% chance of obtaining by chance this correlation in the null hypothesis. The anticorrelation of with has been recently suggested by Salmonson & Galama (2002) based on the positive correlation they observed in several cases between the GRB pulse lag-time and the afterglow jet-break time. We note, however, that the dependence they infer between and () is much stronger than that found by us from afterglow modeling (, see Figure 7).
That wider jets have lower bulk Lorentz factors may also be the origin of the GRB pulse lag-time anticorrelation with the burst peak luminosity found by Norris, Marani & Bonnell (2000) and Salmonson (2000). For the same kinetic energy, narrower jets have a larger energy per solid angle, which could lead to a higher GRB peak luminosity. If, in the comoving frame of the burst, the pulse duration and/or peak time dependence on photon energy are set by a process (e.g. electron cooling) whose timescale is the same in all bursts then, due to the relativistic contraction of time, GRBs from faster jets would have smaller pulse lag-times. Then the anticorrelation implies that (narrower) jets with higher peak luminosities (are faster and) yield shorter -ray pulse lags.
As indicated in Table 3, the product ranges from to 80, implying that, during the GRB phase, due to relativistic beaming, the observer receives emission from only a small fraction, less than 2%, of the jet surface. Thus calculations of the jet -ray output obtained by equating the energy per solid angle in the region visible during GRB phase to the energy per solid angle within the much wider region seen during the afterglow phase could lead to rather unreliable results.
From the jet energy at the beginning of the afterglow phase, one can also calculate the initial et mass: . The results are given in Table 3 and Figure 7. The jet mass is correlated with the jet opening, the linear correlation coefficient being . We note that increases slower than , thus the ratio between the jet mass and the stellar mass within the jet opening decreases with increasing . For a GRB progenitor and the jet masses given in Table 3, this ratio is between and , indicating that prior to the jet release the stellar material along the jet direction is strongly evacuated.
4.4 Microphysical Parameters
The results of Table 2 show that the fractional energy in the magnetic field spans three orders of magnitude and that the index of the power-law distribution of shock-accelerated electrons is not universal. In four of the afterglows analyzed here, the shallow fall-off of either the radio or the optical light-curve after the jet break requires . Mészáros, Rees & Wijers (1998) have shown that, for a fixed , variations in the jet energy per solid angle could lead to range of light-curve decay. Because the observer receives radiation from the entire jet surface after the jet-break time , the internal structure of the jet has little effect on the light-curve decay index after , thus we believe that the values of determined by modelling the post jet-break afterglow decay are not sensitive to the angular structure of the outflow.
We note that, for a fractional energy electron close to equipartition, the hard electron distributions () identified in the 991208, 991216, 000301c, and 010222 afterglows, lead to a -break passing through the optical band at/after few days, yielding the steepening seen in the optical emission of these afterglows.
5 Conclusions
Our modelling of the broadband emission of ten afterglows reveals several properties of GRB jets,
which represent constraints on the models for GRB progenitors (Woosley 1993, Paczyński 1998, Vietri
& Stella 1998, MacFadyen & Woosley 1999, Mészáros, Rees & Wijers 1999, MacFadyen, Woosley &
Heger 2001):
the jet energy has a relatively narrow distribution, the values determined here being within
a factor of 5, around erg,
the jet initial Lorentz factor is between and 300,
narrower jets are less massive and more relativistic than wider jets
the baryonic mass encountered by the jet (as it breaks out) is less than of
the material that the GRB progenitor had initially within the jet aperture,
the surrounding medium does not have, in general, the profile expected for the
unperturbed wind of a massive GRB progenitor. In most cases we find that the density of
the external medium is between and .
The conclusions and the jet parameters presented here were obtained by modelling the afterglow data within a specific framework and under certain assumptions, the most notable being the uniformity of the jet and the constancy of the energy release parameters (, ). For simplicity, the observer was located on the jet symmetry axis. Until the time when first observations are done (few hours to 1 day), the narrow jets considered here undergo significant lateral spreading, so that the afterglow light-curves seen by an observer located off the jet axis (but still within the initial jet opening, to allow the GRB to be detected and localized) differ little from those seen by an on-axis observer.
More complex jet models for GRB afterglows, such as that of a structured jet proposed by Rossi et al. (2001), or a hydrodynamical treatment of the jet lateral spreading (Granot et al. 2001), may yield different jet parameters and constraints on GRB progenitors than presented here. We note that the existence of a quasi-universal jet energy has also been established in a less model-dependent way by Piran et al. (2001), based on the narrow width of the afterglow -ray luminosity at 1/2 day, when a good fraction of the entire jet is visible to the observer, thus this property should also be present in more sophisticated jet models.
AP acknowledges the supported received from Princeton University through the Lyman Spitzer, Jr. fellowship.
REFERENCES
Berger, E. & Frail, D. 2001, GCN #968
Berger, E. et al. 2001, ApJ, 556, 556
Bloom, J., Frail, D. & Sari, R. 2001, AJ, 121, 2879
Bremer, M., Castro-Tirado, A. & Moreno, R. 2001, GCN #995
Bremer, M. et al. 1998, A&A, 332, L13
Castro-Tirado, A. et al. 2001, A&A, 370, 398
Chevalier, R. & Li, Z. 2000, ApJ, 536, 195
Costa, E. 1999, A&AS 138, 425
Cowsik, R. et al. 2001, BASI, 29,91
Fich, M. et al. 2001, GCN#971
Frail, D. et al. 2000a, ApJ, 534, 559
Frail, D., Waxman, E. & Kulkarni, S. 2000b, ApJ, 537, 191
Frail, D. et al. 2001, ApJ, 562, L55
Fruchter, A. et al. 2001, GCN#1087
Fynbo, J. et al. 2001, A&A, 373, 796
Galama, T. et al. 1998a, ApJ, 497, L13
Galama, T. et al. 1998b, ApJ, 500, L97
Galama, T. et al. 2000, ApJ, 541, L45
Galama, T. & Wijers, R. 2001, ApJ, 549, L209
Galama, T. et al. 2002, in preparation
Giblin, T. et al. 1999, ApJ, 524, L47
Goodman, J. 1997, New Astronomy, 2, 449
Granot, J., Piran, T. & Sari, R. 1999, ApJ, 527, 236
Granot, J. et al. 2001, in “GRBs in the Afterglow Era”, eds. E. Costa, F. Frontera & J. Hjorth, Springer-Verlag:Berlin, 312
Granot, J., Panaitescu, A., Kumar, P. & Woosley, S. 2002, ApJ, submitted (astro-ph/0201322)
Gruzinov, A. & Waxman, E. 1999, ApJ, 511, 852
Halpern, J., Kemp, J., Piran, T. & Bershady, M. 1999, ApJ, 517, L105
Harrison, A. et al. 2001, ApJ, 559, 123
Jaunsen, A. et al. 2001, ApJ, 546, 127
Jha, S. et al. 2001, ApJ, 554, L155
Klose, S. et al. 200, ApJ, 545, 271
Kulkarni, S. et al. 2001, GCN #996
Kumar, P. & Panaitescu, A. 2000, ApJ, 541, L9 (KP00)
Kumar, P. & Piran, T. 2000, ApJ, 535, 152
Lee, B. et al. 2001, ApJ, 561, 183
Li, Z. & Chevalier R. 2001, ApJ, 551, 940
MacFadyen, A. & Woosley, S. 1999, ApJ, 524, 262
MacFadyen, A., Woosley, S. & Heger, A. 2001, ApJ, 550, 410
Masetti, N. et al. 2001, A&A, 374, 382
Metzger, M. et al. 2000, GCN #733
Mészáros, P. & Rees, M.J. 1997, ApJ, 476, 232
Mészáros, P., Rees, M.J. & Wijers, R. 1998, ApJ, 499, 301
Mészáros, P., Rees, M.J. & Wijers, R. 1999, New Astronomy, 4, 303
Nicastro, L. et al. 1999, A&A, 138, S437
Norris, J., Marani, G. & Bonnell, J. 2000, ApJ, 534, 248
Paczyński, B. 1998, ApJ, 494, L45
Panaitescu, A. & Kumar, P. 2000, ApJ, 543, 66 (PK00)
Panaitescu, A. & Kumar, P. 2001, ApJ, 554, 667 (PK01)
Panaitescu, A. 2001, ApJ, 556, 1002
Pedersen, H. et al. 1998, ApJ, 496, 311
Pian, E. et al. 2001, A&A, 372, 456
Piran, T., Kumar, P., Panaitescu, A. & Piro, L. 2001, ApJ, 560, L167
Piro, L. et al. 1998, A&A, 331, L41
Piro, L. et al. 2001, ApJ, 558, 442
Price, P. et al. 2001, ApJ, 549, L7
Ramirez-Ruiz, E., Dray, L., Madau, P. & Tout, C. 2001, MNRAS, 327, 829
Rhoads, J. 1999, ApJ, 525, 737
Rossi, E., Lazzati, D. & Rees, M.J. 2002, MNRAS, submitted (astro-ph/0112083)
Sagar, R. et al. 2001, BASI, 29, 91
Salmonson, J. 2000, ApJ, 544, L115
Salmonson, J. & Galama, T. 2002, ApJ, submitted (astro-ph/0112298)
Sahu, K. et al. 1997, ApJ, 489, L127
Sari, R., Piran, T., & Narayan, R. 1998, ApJ, 497, L17
Sari, R. & Esin, A. 2001, ApJ, 548, 787
Scalo, J. & Wheeler, J.C. 2001, ApJ, 562, 664
Sokolov, V. et al. 1998, A&A, 334, 117
Stanek, K. et al. 2001, ApJ, 563, 592
Tkachenko, A. et al. 2000, A&A, 358, L41
Vietri, M. & Stella, L. 1998, ApJ, 507, L45
Vrba, F. et al. 1999, ApJ, 528, 254
Walker, M. 1998, MNRAS, 294, 307
Waxman, E. 1997, ApJ, 485, L5
Wijers, R. & Galama, T. 1999, ApJ, 523, 177
Woosley, S. 1993, ApJ, 405, 273
’t Zand, J. et al. 2001, ApJ, 559, 710
Zharikov, S., Sokolov, V., & Baryshev, Y. 1998, A&A, 337, 356
TABLE 1. Evolution of spectral parameters and indices of power-law light-curves at .
TABLE 2. Best fit parameters for a homogeneous medium and 90% confidence levels for ten GRB afterglows.
| GRB | /dof | ? | ||||||
| ( erg) | (deg) | () | () | |||||
| 970508 | 20 | 18.3 | 0.75 | 11 | 2.18 | 780/279 | yes | |
| 980519a | 53/46 | no | ||||||
| 990123 | 55/56 | no | ||||||
| 990510 | 36/69 | no | ||||||
| 991208 | 112/97 | yes | ||||||
| 991216 | 42/41 | yes | ||||||
| 000301c | 119/96 | maybe | ||||||
| 000418 | 55/61 | yes | ||||||
| 000926 | 159/102 | no | ||||||
| 010222 | 5.1 | 4.6 | 1.7 | 0.43 | 1.35 | 230/87 | yes |
a redshift unknown. was assumed.
TABLE 3. Burst properties and jet characteristics inferred from the best fit parameters given in Table 2.
| GRB | z | ||||||
|---|---|---|---|---|---|---|---|
| ( erg) | (s) | () | |||||
| 970508 | 0.84 | … | … | 35 | 150 | 47 | 8.2 |
| 980519 | 1(a) | 0.52 | 0.11 | 40 | 250 | 10 | 0.90 |
| 990123 | 1.60 | 4.9 | 0.76 | 100 | 300 | 11 | 0.28 |
| 990510 | 1.62 | 1.3 | 0.48 | 100 | 140 | 7.8 | 0.53 |
| 991208 | 0.71 | 18 | 0.88 | 60 | 68 | 15 | 2.0 |
| 991216 | 1.02 | 3.0 | 0.73 | 30 | 150 | 7.0 | 0.43 |
| 000301c | 2.03 | 6.6 | 0.66 | 10 | 160 | 38 | 1.2 |
| 000418 | 1.12 | 148 | 0.82 | 30 | 90 | 78 | 20 |
| 000926 | 2.07 | 15 | 0.82 | 25 | 130 | 19 | 1.4 |
| 010222 | 1.48 | 11 | 0.67 | 120 | 110 | 9.2 | 2.5 |
a assumed
b -corrected jet energy output in the 20–2000 keV band (Bloom et al. 2001)
c efficiency of -ray emission
d observed GRB duration
e jet Lorentz factor at end of GRB
f jet mass