Ultraluminous Infrared Galaxies: Atlas of Near-Infrared Images 111 Based on observations with the NASA/ESA Hubble Space Telescope, obtained at the Space Telescope Science Institute, which is operated by the Association of Universities for Research in Astronomy, Inc., under NASA contract NAS5-26555.
Abstract
A sample of 27 ultraluminous infrared galaxy (ULIRG) systems has been imaged at 1.6 m using the HST Near Infrared Camera and Multi-Object Spectrometer (NICMOS). These ULIRGs are from a larger sample also imaged with HST in the -band. Images and catalog information for the NICMOS subsample, as well as brief morphological descriptions of each system are presented. Inspection of the infrared images and a comparison with optical images of these systems shows that at least 85% are obviously composed of two or more galaxies involved in a close interaction or merger event, with as many as 93% showing some signs of interaction history. Approximately 37% of the systems show either spectroscopic or morphological characteristics of an active galactic nucleus (AGN). The infrared morphologies of these systems are generally less complicated or disturbed than their optical morphologies, indicating that some of the small-scale features seen in optical images are likely due to complicated patterns of dust obscuration, as well as widely distributed star formation activity. In some systems the high-resolution HST infrared images have revealed nuclear remnants that are obscured or unidentified in ground-based imaging, which has led to changes in previously determined interaction stage classifications or system content. In general, however, the NICMOS images support previous conclusions from previous HST optical imaging.
1 Introduction
One of the major discoveries of the Infrared Astronomical Satellite 222The Infrared Astronomical Satellite was developed and operated by the US National Aeronautics and Space Administration (NASA), the Netherlands Agency for Aerospace Programs (NIVR), and the UK Science and Engineering Research Council (SERC). (IRAS) mission was the existence of a population of galaxies that emit the majority of their luminosity in the far-infrared (e.g. Soifer et al., 1984). At luminosities greater than , infrared-selected galaxies become more numerous than optically-selected starburst and Seyfert galaxies of comparable bolometric luminosity, and at the highest luminosities, , they exceed the space densities of quasi-stellar objects (QSOs) by a factor of 1.5–2 (Soifer et al., 1987; Sanders et al., 1989).
Subsequent studies have shown that a large fraction of ultraluminous IR galaxies (ULIRGs), with , are interacting or merging systems, and many contain active galactic nuclei (AGN) (for a review see Sanders & Mirabel, 1996). The relative fractions of systems that are interacting or contain AGN, however, varies depending on the particular subsample of ULIRGs studied. Some samples appear to contain only 10–20% interacting, merging, or peculiar systems, while in others the fraction is 80% or higher (e.g. Sanders et al., 1988a; Melnick & Mirabel, 1990; Zhenlong et al., 1991; Leech et al., 1994; Kim, 1995; Clements et al., 1996b; Murphy et al., 1996). Similarly, the fraction of systems containing AGN varies from 25% (e.g. Leech et al., 1989; Lawrence et al., 1999; Veilleux et al., 1995; Veilleux, Sanders, & Kim, 1999) to nearly 100% (e.g. Sanders et al., 1988a; Sanders, 2000). In general, the fraction of interacting systems and systems containing AGN appears to increase with IR luminosity (Klaas, 1989; Klass & Elsässer, 1993; Rowan-Robinson, 1991; Kim, Veilleux, & Sanders, 1998; Veilleux, Kim, & Sanders, 1999; Veilleux, Sanders, & Kim, 1999).
Given the propensity for ULIRGs to be found in interacting systems, it seems clear that collision and merger driven processes are the major mechanisms responsible for the bulk of their infrared emission. Starbursts, induced by the gravitational interaction of colliding and merging galaxies, could account for the excess IR emission (e.g. Leech et al., 1989; Ashby, Houck, & Matthews, 1995; Lutz et al., 1998; Genzel et al., 1998; Lutz, Veilleux, & Genzel, 1999). On the other hand, the frequent occurence of AGN in these systems suggests that non-thermal processes might be the dominant energy source in the most luminous systems (e.g. Sanders et al., 1988a; Veilleux et al., 1995; Genzel et al., 1998).
Recent deep surveys at 850 m using the SCUBA camera (Submillimeter Common User Bolometer Array; Holland et al., 1999) on the James Clerk Maxwell Telescope have discovered a substantial population of ULIRGs at high redshift (1–4), whose cumulative space density accounts for nearly all of the extragalactic background light at submillimeter wavelengths (Smail, Ivison, & Blain, 1997; Hughes et al., 1998; Barger et al., 1998; Barger, Cowie, & Sanders, 1999; Eales et al., 1999; Blain et al., 1999). Evidence suggests that the SCUBA sources, like local ULIRGs, are powered by intense starbursts and AGN, both fueled by mergers of gas-rich disk galaxies. As such, they represent a key stage in the early evolutionary history of all galaxies, and are likely to be the precursors of QSOs. Studies of low- ULIRGs, which appear to be local templates of the SCUBA sources, will therefore lead to a greater understanding of massive star formation, the formation and evolution of galaxies and QSOs, as well as the metal enrichment of the intergalactic medium.
Recent Hubble Space Telescope (HST) and other high-resolution imaging observations of small and medium-sized samples of ULIRGs have demonstrated the ability to resolve close nuclei, near-nuclear star clusters, and the complicated morphologies that are present at all scales in these types of systems. Boyce et al. (1996) and Surace, Sanders, & Evans (2000), for example, have found systems with close double nuclei that were previously unresolved. Surace et al. (1998), Zheng et al. (1999), and Scoville et al. (2000) have utilized HST images to measure the surface brightness profiles in the inner regions of ULIRGs, and found that many are well-fit by an law, indicating that the merging events may be in the process of turning these systems in giant elliptical galaxies.
The study of a larger, more representative collection of ULIRGs is needed to address with strong statistical significance both the “interaction frequency” and “starburst vs. AGN” issues mentioned above. We are carrying out a multi-wavelength HST imaging survey of a large, well-defined sample of ULIRGs, in order to survey the fine-scale features that are associated with the interaction and activity-related processes that are at work within these systems. Borne et al. (2001) present an atlas of Wide Field Planetary Camera-2 (WFPC2) -band images of the parent sample of 123 ULIRG systems. Farrah et al. (2001) present the results of an additional WFPC2 -band survey of a subsample of 23 of these systems.
Here we present near-IR survey results, consisting of Near Infrared Camera and Multi-Object Spectrometer (NICMOS) -band images of a representative subsample of 27 ULIRGs. Additional wavelength coverage at 4–200 m from Infrared Space Observatory (ISO) observations has also been obtained for this subsample. Images and catalog information for the NICMOS sample, as well as brief morphological descriptions of each system, are contained in this paper. Colina et al. (2001) present more detailed analyses of these data. The near-IR imaging data complement the optical data in several ways. The near-IR band is less sensitive to emission from young, blue star clusters, as well as the absorption effects of interstellar dust. A comparison of the near-IR and optical images allows us to ascertain to what level the complex small-scale morphological structures seen in the optical images are due to either dust or young star clusters. This will provide confirmation of conclusions previously based on the optical morphology alone regarding the makeup and status of the ULIRGs. Futhermore, the addition of the NICMOS data will yield colors, which can be used, for example, to classify various morphological features as remnant nuclei or young star clusters.
2 The Near-IR ULIRG Sample
The sample of ULIRGs imaged in the near-IR was randomly selected from the larger sample of 123 systems previously imaged in the -band with WFPC2. Full details of the selection criteria for the WFPC2 sample are given by Borne et al. (2001). It consists of objects compiled by Sanders et al. (1988a) and Sanders et al. (1988b), southern hemisphere targets from Melnick & Mirabel (1990), many systems from the QDOT all-sky IRAS galaxy redshift survey by Lawrence et al. (1999), and complemented with systems from Leech et al. (1994), Kim et al. (1995), and Clements et al. (1996a). The near-IR subsample presented in this paper was compiled by selecting a representative subsample of 50 targets from the WFPC2 sample, consisting mainly of galaxies from the QDOT survey, as well as the samples of Melnick & Mirabel (1990) and Clements et al. (1996a). The objects were selected without regard for morphological or spectroscopic types. HST NICMOS snapshot images were obtained for a total of 27 systems in this subsample, of which 17 are from the QDOT survey, 9 from the Melnick & Mirabel (1990) sample, and 1 from the Clements et al. (1996a) sample.
Table Ultraluminous Infrared Galaxies: Atlas of Near-Infrared Images 111 Based on observations with the NASA/ESA Hubble Space Telescope, obtained at the Space Telescope Science Institute, which is operated by the Association of Universities for Research in Astronomy, Inc., under NASA contract NAS5-26555. lists the objects that have been observed with NICMOS and includes basic catalog information for each object. Redshifts and IRAS fluxes were obtained for each object from the NASA/IPAC Extragalactic Database (NED), where the IRAS fluxes are from the Faint Source Catalog (Moshir et al., 1990). This sample covers a redshift range of , with a median . The vast majority (85%) of the systems lie within a redshift range of . The 60m luminosities range from to , with a median . Most of the galaxies (81%) have infrared colors indicative of “cool” ULIRGs (i.e. ). The distribution of 60m luminosities is essentially random within the redshift range . These systems therefore form a representative sample of low-redshift cool ULIRG’s.
Sanders et al. (1988a) originally defined ULIRGs as having , where the IR luminosity is integrated over the 8–1000 m range and makes use of flux measurements from all four IRAS bands. Very few of the objects in the current sample, however, have detections in the IRAS 12 and 25 m bands, therefore it is not possible to derive comparable IR luminosities. Furthermore, some objects in this sample also do not have detections in the IRAS 100 m band, making it similarly impossible to derive the typical far-infrared luminosity, , from the 60 and 100 m flux densitites (e.g. Fullmer & Lonsdale, 1989) in a uniform fashion. Table Ultraluminous Infrared Galaxies: Atlas of Near-Infrared Images 111 Based on observations with the NASA/ESA Hubble Space Telescope, obtained at the Space Telescope Science Institute, which is operated by the Association of Universities for Research in Astronomy, Inc., under NASA contract NAS5-26555. therefore lists only the 60m luminosity for each object. For the types of galaxies in this sample, is roughly equivalent to , and values are roughly 2 for a wide range of dust temperatures and emissivities (Lawrence et al., 1989). Therefore a definition of ultraluminous which is equivalent to that of Sanders et al. (1988a) is . All of the objects in the current sample meet this criterion.
3 Observations and Data Reduction
Direct imaging observations of 27 ULIRGs were obtained with the NICMOS instrument on HST in a snapshot program that executed from January to August 1998. The NICMOS camera 2 was used, which has a pixel size of 0.075″ and a field-of-view of 19.2″ square. The images were taken with the NICMOS F160W filter, which approximates the groundbased -band. Observations of each target were obtained using a four-point square dither pattern, with dither steps of 3.75″ (50 pixels) between each exposure. Each of the four images for a given target was taken in the NICMOS multiaccumulate (or “multiaccum”) mode of operation, using the “STEP32” readout sequence and 12 readout samples, for a total integration time per exposure of 160 s. Combining the four exposures for each target yields an image with a total field-of-view of 23″ square and a total on-source integration time of 640 s.
The raw data files were processed with the IRAF/STSDAS NICMOS calibration program calnica (Bushouse, 1997). This program performs the operations necessary to subtract the initial (or “zeroth”) readout of the multiaccum exposure sequence from all subsequent readouts, flag hot and cold pixels, subtract the dark current, linearize the detector photometric response, and flatfield the data. This program also combines the multiple readouts of each multiaccum exposure into a single image, and in the process rejects samples suspected of containing cosmic-ray hits.
Two characteristics of the NICMOS detectors resulted in effects that were severe enough in these data to require special processing. First, there is a bias-related signal, known as “shading”, that varies across each image quadrant as the pixels are read out. The exact shape and amplitude of the shading are dependent on both detector temperature and the elapsed time since the previous readout. Because the temperature characteristics of the standard dark current images used in calnica were a bit different than that of the science data, the shading was not completely removed by subtracting the dark images. The residual shading appears as a signal gradient across each quadrant in a calibrated image. To reduce these effects, the raw data were reprocessed with version 3.3 of calnica, which allows for the rejection of data from several of the initial readouts of each exposure sequence in the processing step where the data are combined to form a single image. Rejection of the early readouts, which have the most non-linear increases in exposure time from readout to readout, dramatically reduces the level of the residual shading in the final combined image, while sacrificing very little of the total integration time.
Second, the overall bias level in the NICMOS detectors is also temperature-dependent, such that a residual bias signal (often referred to as “pedestal”) is frequently present in processed data. The amplitude of the residual bias varies from quadrant to quadrant in each image, and the process of flatfielding the data leaves a negative imprint of the flatfield image, resulting in a non-uniform background in the calibrated images. To remove this effect, the calibrated data were processed with the IRAF/STSDAS NICMOS program pedsky (Bushouse, Dickinson, & van der Marel, 2000), which iteratively solves for the best combination of sky background and residual bias signal levels that minimizes the flatfield residuals in each image. The computed sky and bias (or “pedestal”) signals are subtracted from the images by this process.
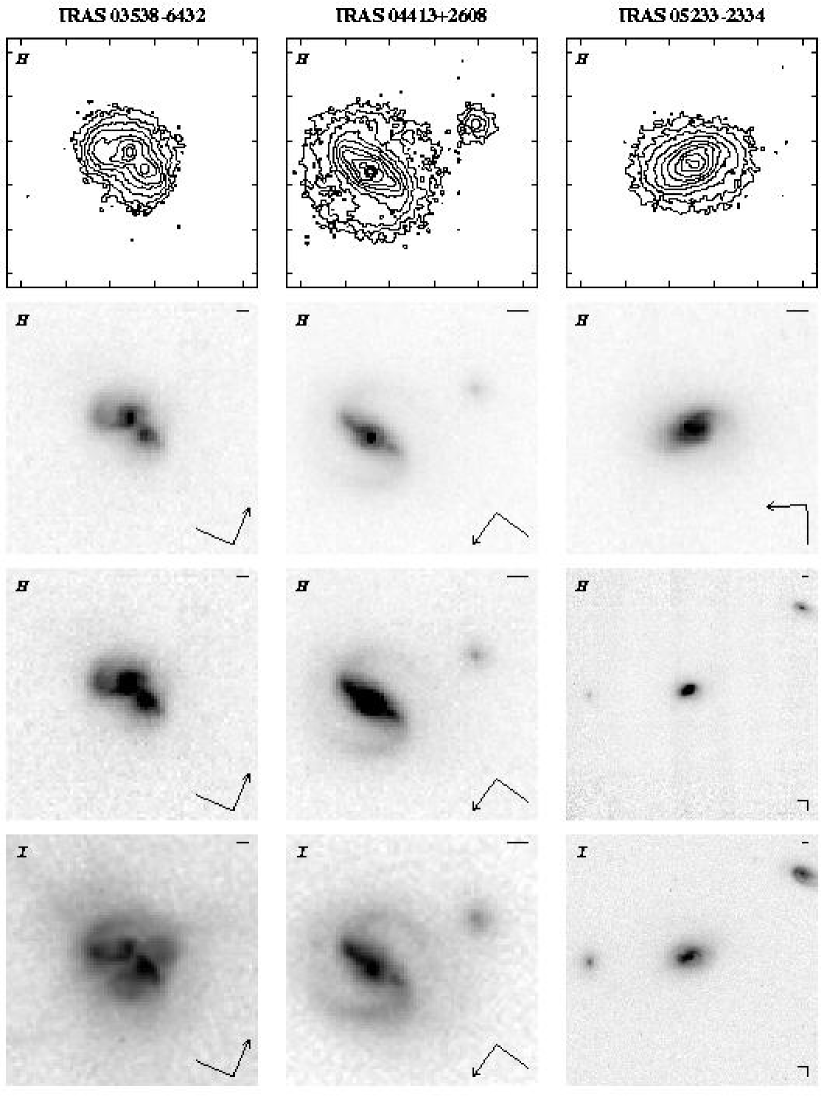
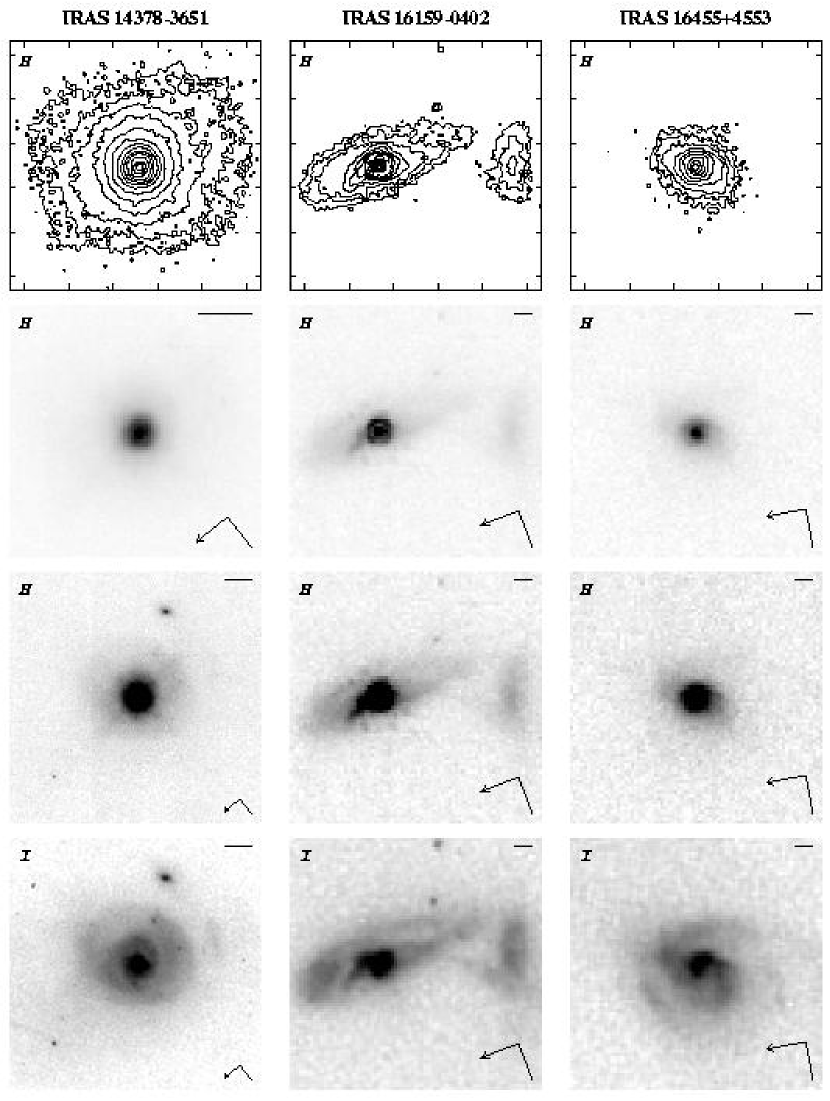
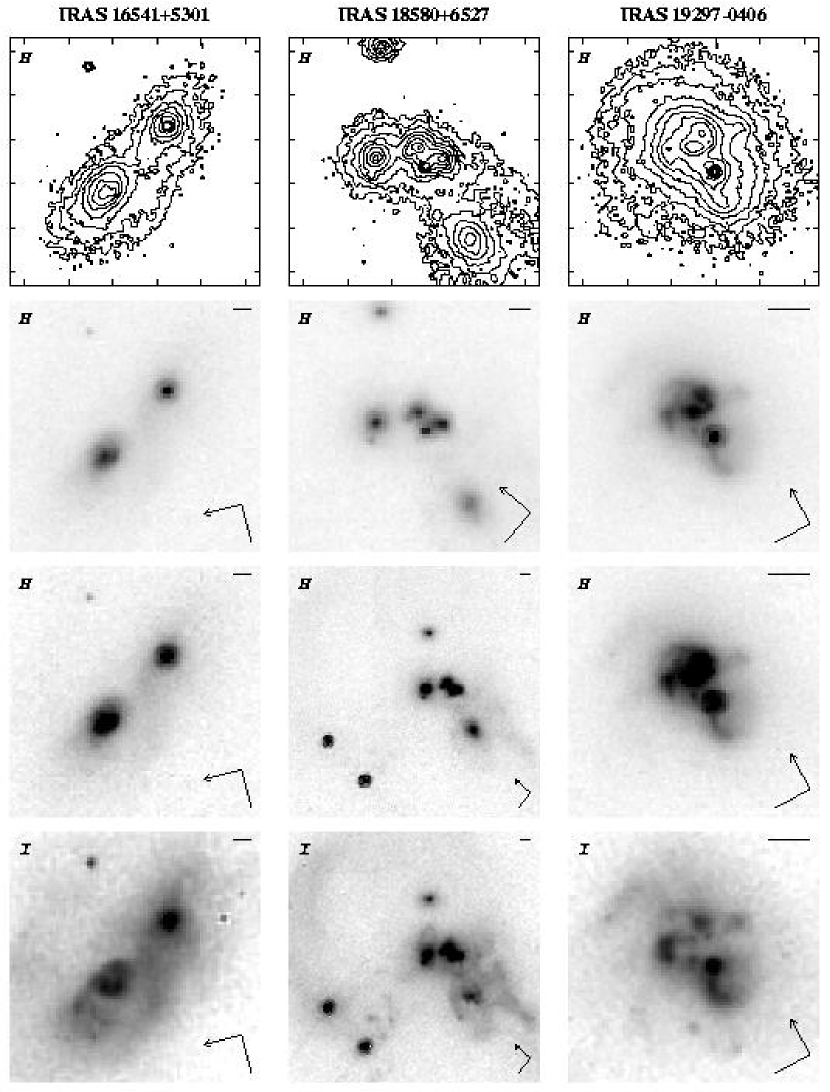
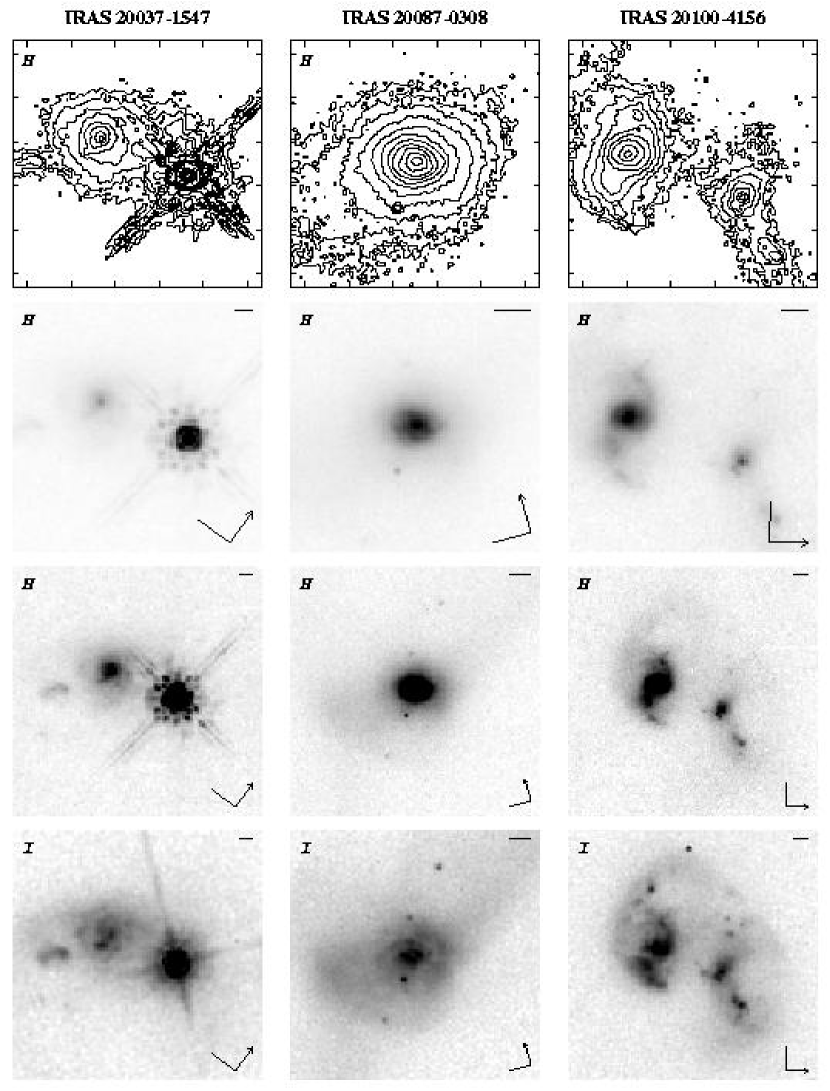
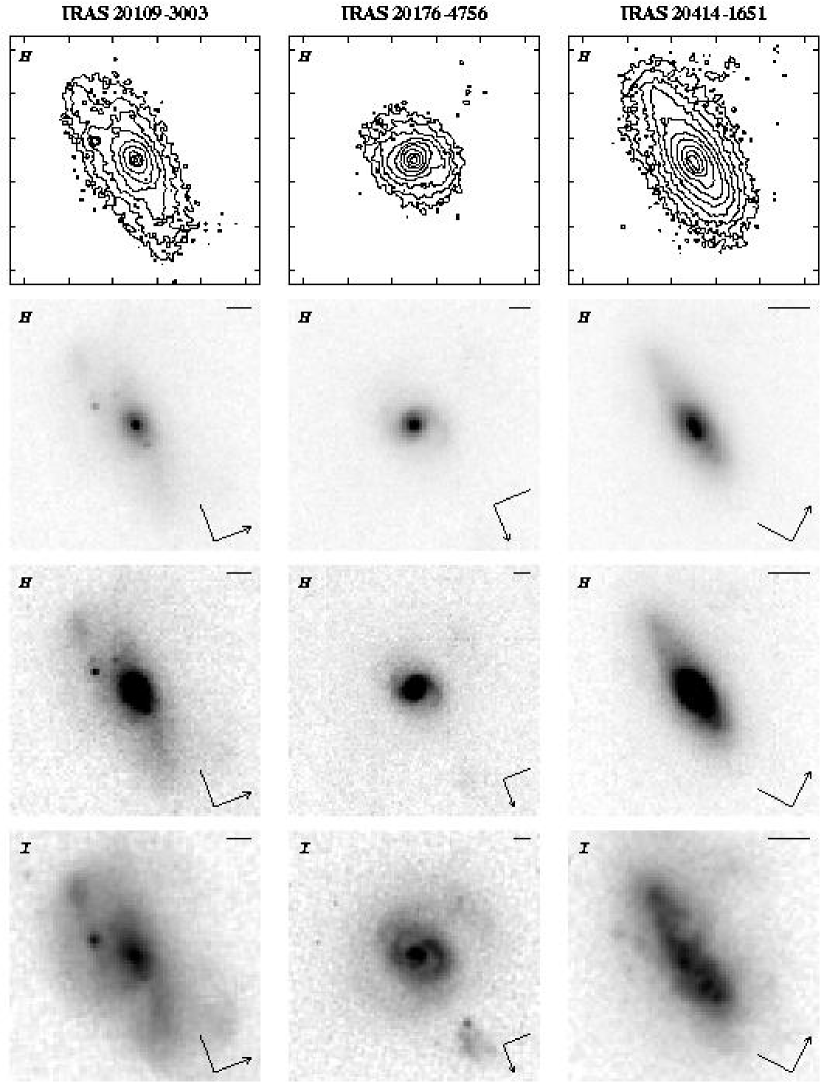
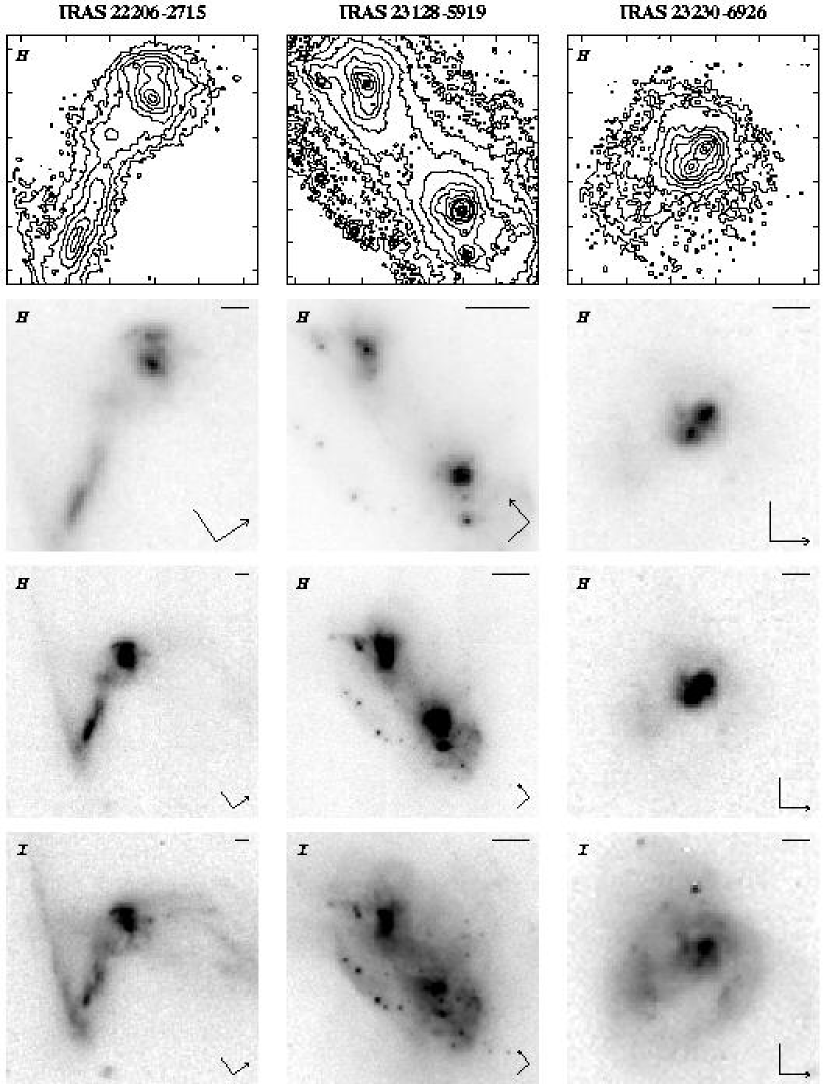
After applying these processing steps to the four images acquired for each target, the associated sets of calibrated images were then processed with the IRAF/STSDAS NICMOS program calnicb (Bushouse, 1997). This program combines the four dithered images into a final mosaiced image, using a cross-correlation technique to determine the relative registrations and a simple bilinear interpolation for accounting for subpixel shifts. Figure 1 shows the final combined images for the 27 ULIRGs that have been observed in this program. This figure includes contour plots and greyscale images of the NICMOS data for each system, and a WFPC2 -band image for comparison.
Global -band absolute magnitudes for each system are listed in Table Ultraluminous Infrared Galaxies: Atlas of Near-Infrared Images 111 Based on observations with the NASA/ESA Hubble Space Telescope, obtained at the Space Telescope Science Institute, which is operated by the Association of Universities for Research in Astronomy, Inc., under NASA contract NAS5-26555.. The photometric measurements were performed on the final combined and calibrated NICMOS images. The measured count rates have been converted to apparent -band magnitudes in the Vega system using the expression
| (1) |
where Jysec/DN, countrate is the integrated count rate, in units of DN/sec, and Jy. The resulting magnitudes have an estimated systematic uncertainty of less than 5%. The majority of these measurements were performed using an aperture of 7.5″ in diameter. Larger apertures were used for a few particularly extended systems. See Colina et al. (2001) for more details.
4 General Results
The WFPC2 -band imaging survey of the parent sample of ULIRGs (Borne et al., 2001) has revealed fine structure on all spatial scales in these systems. Only about 10% of the systems have structure that is smooth and centrally concentrated. The rich variety of morphological features seen at optical wavelengths is almost certainly due to a combination of tidal disturbances, young star-forming regions, and dust obscuration. Furthermore, the high spatial resolution of the WFPC2 images has revealed the presence of multiple nuclei and other morphological distortions in systems that were previously classified as non-interacting on the basis of ground-based imaging. There is also a strong correlation between the presence of spatially-unresolved nuclear morphology (i.e. bright, point-like nuclei) in the -band images of these systems and spectral classification as AGN. This type of morphology therefore appears to be a strong indicator for the presence of visible AGN (deeply obscured AGN could still be present in systems that don’t show this type of morphology).
The NICMOS -band survey images presented here show similar trends. Table 2 lists the global and nuclear morphologies, indicating the number of discernable galaxies and nuclei, as well as the presence of an unresolved nuclear source in each system. Out of the 27 systems imaged, 23 are obviously composed of strongly interacting multiple galaxies, or single-body systems with extensive shells, loops, or tails that indicate an advanced stage of merging. The remaining four systems—IRAS 04413+2608, IRAS 05233-2334, IRAS 20176-4756, and IRAS 20414-1651—show a single, dominant galaxy with at least one or more smaller, nearby companions. In the IRAS 20176-4756 system, the companion is very distorted and therefore may have suffered a collision with the parent galaxy. The parent galaxy in IRAS 20414-1651 appears quite disturbed in the -band WFPC2 image, suggesting a previous history of either collisions or a merger event. The morphologies of the parent and companion galaxies in IRAS 04413+2608 and IRAS 05233-2334 are quite regular, with no obvious signs of previous or current interaction activity. The parent galaxy in IRAS 04413+2608, however, does harbor a Seyfert 2 nucleus. Therefore at least 85% of these systems are interacting, with as many as 93% showing some signs of interaction history.
A little more than one-third of this sample contains obvious signs of an AGN. There are 7 systems that have a bright, point-like nucleus visible in the NICMOS -band images, suggestive of the presence of an AGN. Previous spectral observations of galaxies in this sample yield a total of 8 objects with indications of either Seyfert 1 or 2 characteristics, and an additional four objects with LINER spectra (Veilleux et al., 1995; Duc, Mirabel, & Maza, 1997; Lawrence et al., 1999). Of these 12 objects, five show a bright, unresolved nuclear source in the NICMOS -band images. All five of these are classified spectroscopically as Seyfert 1 or 2 systems. None of the systems classified as LINER shows any morphological evidence for a strong nuclear source. Thus the total number of systems that have either morphological or spectroscopic indications of Seyfert activity is 10, yielding a fractional content of AGN in this sample of 37%. This result is similar to the 34% fraction of Seyferts found in an IRAS 1 Jy sample of ULIRGs by Kim, Veilleux, & Sanders (1998). These data, however, do not rule out the existence of heavily obscured AGN in these systems. Furthermore, 12 of the systems in this sample do not have spectral observations available at this time. So the derived fraction of systems containing AGN should be viewed as a lower-limit.
The combination of high spatial resolution, low background, and reduced effects of dust obscuration offered by the NICMOS images gives us new insights into many of the ULIRG systems when compared with previously obtained ground-based optical and near-IR images. For example, IRAS 11095-0238 was previously classified as a system containing a single nuclei, and therefore at the end stage of a merger (Duc, Mirabel, & Maza, 1997). The NICMOS image of this system shows two unmerged cores, with a separation of 0.5″. Similarly, IRAS 16541+5301 appears as a single object in ground-based R-band images (Leech et al., 1994), while the NICMOS image clearly reveals two remnant galaxies within a common envelope. Furthermore, IRAS 18580+6527, IRAS 19297-0406, and IRAS 20100-4156 are all systems in which single components that appear in ground-based images have been resolved by NICMOS into two or more sub-components.
Comparison of the NICMOS images with the somewhat shorter-wavelength WFPC2 images has also helped to confirm the character of many other systems in the sample, whose optical morphologies are sometimes complicated by the effects of dust and the presence of young, blue star forming regions. In the IRAS 05233-2334, IRAS 16455+4553, IRAS 20037-1547, IRAS 20087-0308, IRAS 20176-4756, and IRAS 20414-1651 systems, for example, the near-nuclear regions have very complicated optical morphologies, showing multiple bright regions that might be identified as remnant nuclei. In the NICMOS -band images of these systems, however, we clearly see a single, dominant nuclear core. Similarly, the inner regions of IRAS 03538-6432, IRAS 10558+3845, IRAS 11095-0238, and IRAS 2320-6926 also have very complex optical morphologies, but the -band images very clearly show two distinct, dominant nuclear cores.
Two systems in this sample, IRAS 18580+6527 and IRAS 19297-0406, were previoulsy identified by Borne et al. (2000) as multiple progenitor systems, based on the appearance of multiple nuclear-like cores in WFPC2 -band images. The NICMOS images of these two systems support this conclusion, as they also contain evidence for multiple remnant nuclei. Quantitative analysis, however, will be required to determine whether the putative galaxy cores have luminosities and colors consistent with that expected for galaxy bulges.
5 Object Descriptions
Here we describe the morphology of each of the 27 ULIRGs observed with NICMOS, and compare it to that seen in the -band images obtained with the WFPC2 (Borne et al., 2001), as well as ground-based images obtained by other investigators.
5.1 IRAS 035386432
This object appears to be a relatively advanced merger, with a single central body containing multiple nuclei, one prominent tidal tail, and several additional short tails. In our WFPC2 -band image, the central region of the main body contains several obvious dust lane features, and what appear to be as many as three stellar concentrations. The NICMOS -band image clearly reveals that there are in fact only two remant nuclei. The third bright concentration seen in the -band image appears to be a hot spot located on an arm of one of the two galaxies. The dominant tidal tail is just barely visible in the -band image.
5.2 IRAS 04413+2608 (Sy 2)
This is a pair of galaxies made up of a (possibly barred) spiral and a much smaller spheroidal companion. In the -band image the spiral galaxy is dominated by nuclear point source, presumably corresponding to the Seyfert 2 component. In the -band image, the bar component of the spiral galaxy appears to be one-sided, i.e. it is much brighter on one side of the nucleus than the other. This asymmetry is also visible in the -band, although to a lesser degree. This suggests that at least some of the imbalance in the surface brightness of the bar is due to dust obscuration. In the -band image there is still a clear separation between the nuclear component and the hot spot that appears at the base of a spiral arm on the faint end of the bar. If this bifurcation is due to dust obscuration, the fact that it is still visible at -band indicates a substantial amount of dust. Alternatively, the hot spot may be an intrinsic bright feature, such as a site of recent starburst activity.
5.3 IRAS 052332334
This is a single, disturbed looking spiral galaxy, with a somewhat fainter spiral companion, and a much smaller spheroidal companion. The very complex -band appearance of the central region of the main spiral is replaced in the -band by a much more normal looking two-armed spiral, dominated by a point-like nucleus. There is only a hint of structure in the near-nuclear region, with a hot spot on one side of the nucleus that shows up in both the I and -band images. The one-armed spiral companion appears at edge of the -band frame and is dominated by an unresolved nucleus. The only evidence for an interaction history in this system is the presence of the two nearby companions.
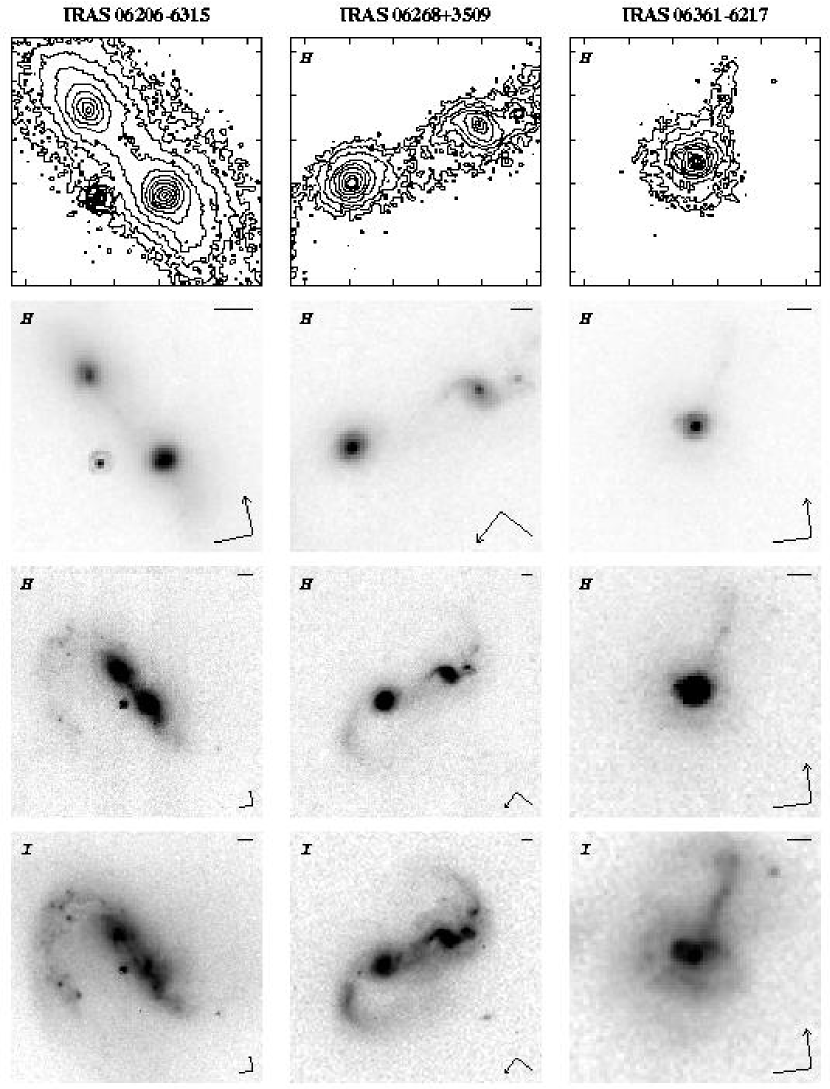
5.4 IRAS 062066315 (Sy 2)
This is a spectacular pair of interacting spiral galaxies, still clearly separated, and yet involved in a very strong interaction that has produced one very large tidal tail, and possibly other smaller ones. In the -band image the central regions show very complex structure, apparently due to mixtures of dust obscuration and active star formation regions. Even the dominant tidal tail shows structure on small scales. The -band image clearly reveals the nuclei of the two progenitor galaxies, with a fairly bright linear feature connecting the two. While the -band image shows much less complicated structure than the -band (indicating that much of that structure is due to dust and possibly groups of hot stars), a few of the hot spots are still visible in the near IR. This is true not only in the bodies of the galaxies, but also in the large tidal tail. If these hot spots are in fact regions of interaction-induced star formation, then the burst ages must be large enough for a population of red supergiants to exist and be visible in the near-IR. Ground-based optical and near-IR imaging of this system has been able to resolve the two galaxies, but does not reveal the much smaller scale knots and dust signatures within the tidal tail and around the nuclei (Duc, Mirabel, & Maza, 1997; Rigopoulou et al., 1999).
5.5 IRAS 06268+3509
This is another pair of strongly interacting spirals, still clearly separated, yet connected by a tidal bridge, and each galaxy has a large tidal tail. In the -band image the complex structure in the central regions of the galaxies makes it difficult to identify exactly the location of the nuclei. The -band image, on the other hand, clearly shows the nucleus of each galaxy. The southern galaxy (upper right in Fig. 1) also shows spiral (or possibly tidal?) arm structures on either side of the central core. The two prominent tidal tails are also visible in the near-IR. In particular, the middle portion of the tail from the northern (lower left) galaxy is quite bright, indicating that it is composed of a substantially old stellar population. Two or three hot spots near the base of the tidal tail of the southern galaxy are also still visible in the -band image, but the rest of the small-scale structure attributable to dust obscuration is largely absent.
5.6 IRAS 063616217
Zhenlong et al. (1991) described this system as containing several well separated objects, with the main central object appearing as a single, undisturbed galaxy. The HST images, however, reveal that the central object appears to be made up of a small, edge-on galaxy that is in the process of plunging through the center of a more spheroidal galaxy. In the -band image the spheroidal galaxy nucleus is visible, with hot spots on either side that appear to form portions of a ring around the nucleus. One of these hot spots is still visible in the -band image, but is insignificant next to the extremely bright, point-like nucleus (the first airy ring of the diffraction pattern is clearly visible). In the -band the edge-on galaxy shows several bright condensations along the major axis (pointing towards the spheroidal galaxy). In the near-IR only one of these hot spots is visible, and may represent the nucleus.
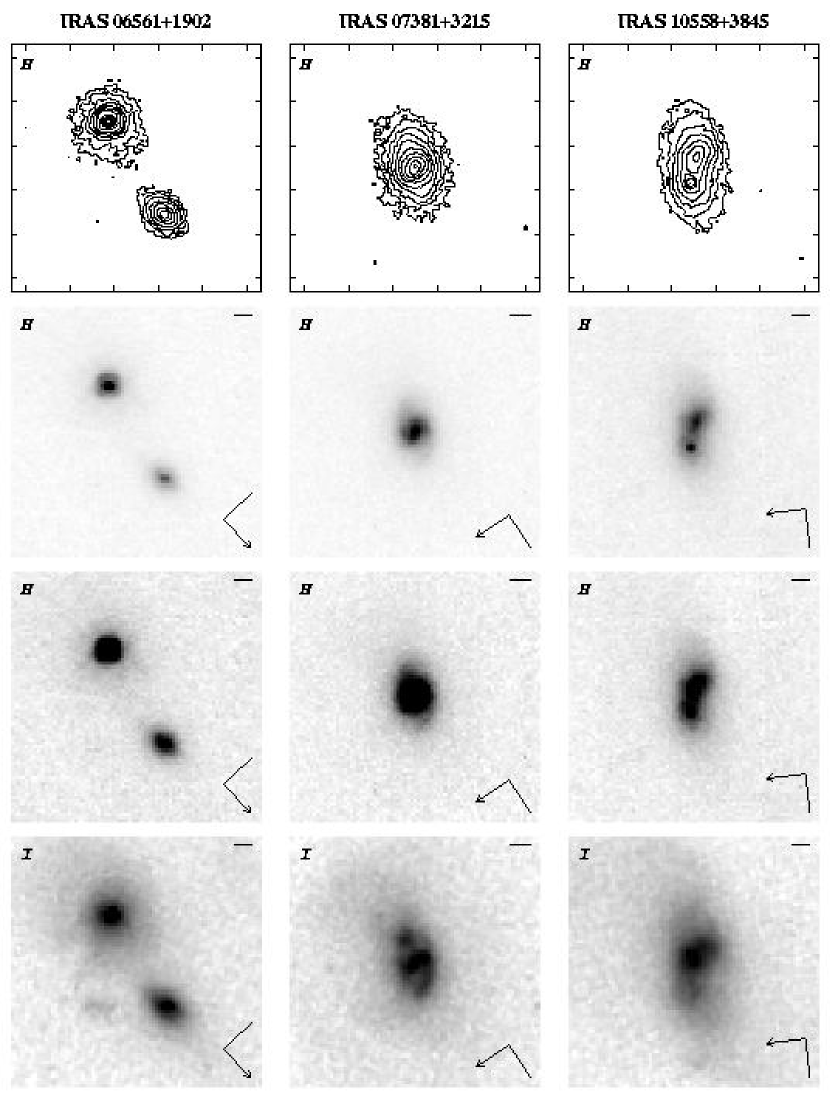
5.7 IRAS 06561+1902
The -band image of this small group of galaxies covers only the central binary pair and is rather unremarkable. The extensive common envelope of tidal debris surrounding the pair is not detected in the -band image, nor is the object that appears to be a very faint companion located within the common envelope. There is little to no evidence of fine-scale structure within the two main galaxies in either the I or -band images. The nucleus of the southern galaxy (upper left in Fig. 1) shows a bright, point-source nucleus in the -band image (the NICMOS PSF is quite distinct).
5.8 IRAS 07381+3215
This system shows a small, single galaxy, with some evidence of past interaction. The extended, low surface brightness features, such as tails and shells, that constitute this evidence in the optical are not visible in the -band image. Small scale features, such as arms and hot spots, that are visible in the central regions of the galaxy in the -band image are barely visible in the near-IR. The -band image shows a single nucleus with what appear to be a central bar and two spiral arms wrapping out into the disk of the galaxy. A couple of localized hot spots that appear in the optical image along the arms are not visible in the near-IR.
5.9 IRAS 10558+3845
Optical images show a single central body with a pair of symmetric, fan-like tails, suggesting a fairly advanced merger. The central region is also quite complex in the optical image, with indications of either multiple nuclei or hot spots, as well as patches of dust obscuration. The NICMOS -band image shows the same single, central body, but now there are two distinct nuclear concentrations, with the one towards the east (bottom) being very bright and point-like. This nucleus is essentially invisible in the -band image, suggesting that it is hidden by large amounts of dust. The western (upper) nuclear-like region is fainter and more extended, and the ellipticity suggests an edge-on orientation. Only the innermost (highest surface brightness) portions of the fan-like tails are detected in the -band image.
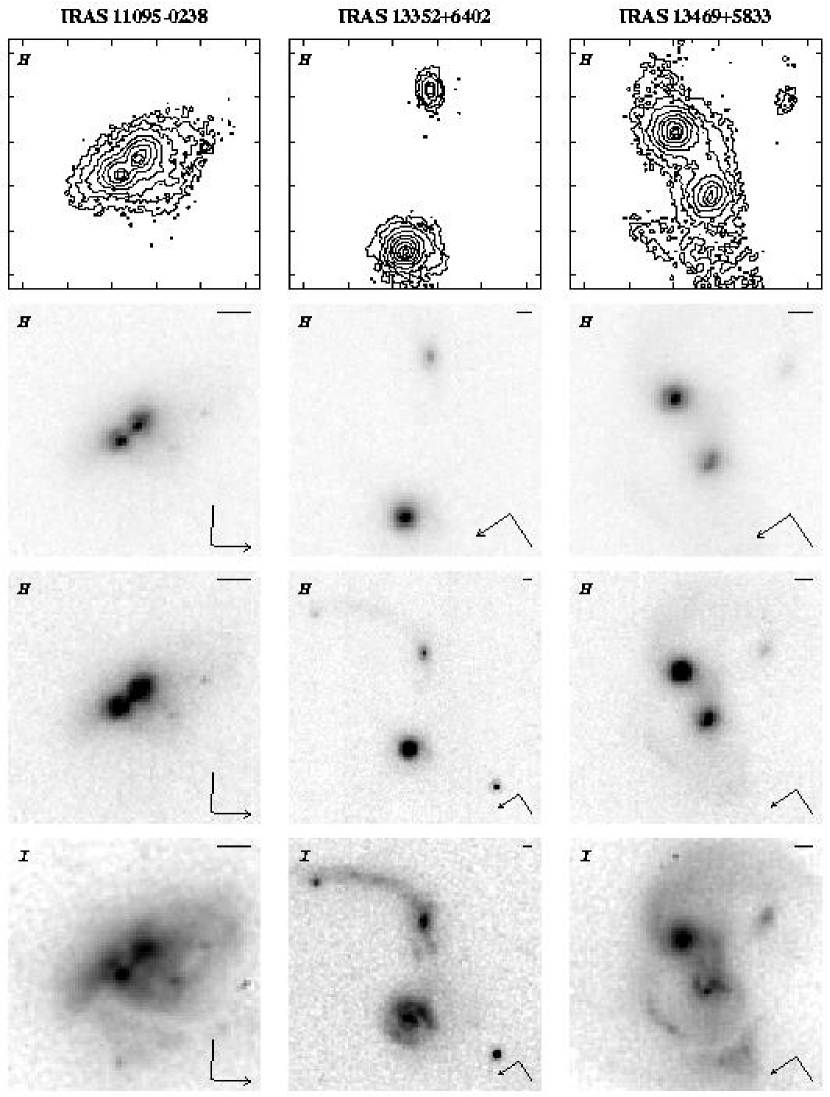
5.10 IRAS 110950238 (LINER)
Ground-based optical and near-IR images by Duc, Mirabel, & Maza (1997) shows two tidal tails in this system, but only a single nucleus. The HST -band image shows a single main body with two clearly resolved cores, and a long, complex tidal tail. It is not obvious whether the two brightest (and also closest) nuclear condensations are in fact multiple nuclei or simply a single core bifurcated by a dense dust lane. The NICMOS image of the core is significantly less complex, showing the same two dominant nuclear concentrations and a few of the hot spots that are visible further out in the optical image. But even in the -band image the edges of the low intensity band that separates the two nuclei are sharp enough to suggest that we still may be seeing a dust lane.
5.11 IRAS 13352+6402
This is a small group of galaxies, dominated by a central, strongly interacting pair. A ground-based -band image of this system shows the pair of galaxies in close contact, with some evidence for a tidal extension from one of them (Leech et al., 1994). In the HST images the northeastern (lower) galaxy of the pair appears to be a nearly face-on spiral. The arm pattern is very asymmetric, with the western arm being much brighter. The southwestern (upper) galaxy is smaller, with a large tail containing several condenstations (star forming complexes?). There is a bright knot at the very end of the tail. The -band image shows almost no small-scale features within these two galaxies, although the asymmetry of the arms in the spiral is still noticeable. A few of the bright knots in the tail of the western galaxy, most notably the one at the very end of the tail, are also still visible in the near-IR.
5.12 IRAS 13469+5833
The Leech et al. (1994) ground-based -band image of this system shows what is probably two galaxies in contact, with two tidal tails that wrap around the pair. The HST images confirm that this is indeed a close pair of strongly interacting spiral galaxies, in the late stages of collision, but not yet merging. In the WFPC2 -band image the central region of the eastern (lower right) galaxy is complex, with several hot spots and indications of patchy dust obscuration. The extended regions of the tail that lies to the northeast of this galaxy also have complex fine-scale structure, with numerous star complexes and dust lanes. The central region of the western (upper) galaxy appears smooth, with a single nucleus, in both the I and -band images. The eastern galaxy appears less complex in the -band, but there is still a slight indication of a double peak at the very center, with a separation of only ″. The bright ridge of emission seen along the edge of the tail from this galaxy in the -band image is still visible in the near-IR, as is the object (dwarf galaxy?) located within the inner arc of the tail from the western galaxy.
5.13 IRAS 143783651 (Sy 2)
Ground-based optical and near-IR images of this system show a group of isolated objects, with a central elliptical-like galaxy that has no remarkable features (Melnick & Mirabel, 1990; Duc, Mirabel, & Maza, 1997). The HST images reveal that the main galaxy has multiple shells and an inner spiral pattern, along with a faint companion to the south (upper right). The center of the main galaxy appears to have a single nucleus in both the optical and near-IR HST images. The nucleus in the -band image is point-like, showing the instrumental diffraction spikes. The shells and inner arms are faintly visible in the -band image, as are two bright spots (star clusters?) that appear in the outer envelope.
5.14 IRAS 161590402
This is a compact group of at least two and possibly three strongly interacting galaxies. The Leech et al. (1994) ground-based -band image shows two galaxies in contact, but with no obvious tidal extensions or internal disturbances. In the WFPC2 -band image the brightest galaxy of this pair has a complex inner disk structure, which has the appearance of being due to dust lanes. In the -band image some of this structure is still visible, indicating large amounts of dust. The single nucleus of this galaxy is very bright and point-like in the near-IR, but appears to be offset by 0.2″ relative to the surrounding common features in the -band image. This could be due to large amounts of dust obscuring the nucleus asymmetrically in the -band. The second brightest galaxy appears nearly edge-on, and there is more of an obvious nuclear concentration in the -band image than in the optical.
5.15 IRAS 16455+4553
The Leech et al. (1994) ground-based -band image shows what appears to be two distinct galaxies in contact, with a tidal tail emanating from one of them. The HST images, however, indicate that this is a single object, with a pair of large, fan-like tidal tails. What appeared to be a second galaxy in the ground-based image is actually just a high surface brightness tidal loop. The two tails suggest that this must be the result of a merger event. The WFPC2 optical image shows spiral arm structure in the main body of the galaxy. This image also shows two peaks near the center, one brighter than the other, suggestive of a double nucleus. The NICMOS -band image, however, shows only a single peak, indicating that the second bright spot in the optical image is probably a star cluster. The rest of the object is quite featureless in the -band image, showing only a hint of the spiral arm structure.
5.16 IRAS 16541+5301 (Sy 2)
Leech et al. (1994) placed this system in their interaction class zero, because a ground-based -band image shows a single body with one or more possible tidal extensions, but no nearby companions. The high-resolution HST images clearly reveal that this is in fact a compact, strongly interacting pair of galaxies that are still separate but are in close contact. The pair is surrounded by low surface-brightness tidal debris. The galaxy to the south (upper right) appears to have a single nucleus in both WFPC2 and NICMOS images. In the -band image it is unresolved and bright enough to see the first airy ring of the instrument diffraction pattern. The central region of the galaxy to the north (lower left) is quite complex in the optical -band image, showing patterns of spiral arms and/or the base of tidal tails, bright clusters, and patchy dust lanes. In the -band image the nucleus of this galaxy appears to be bifurcated by a narrow dust lane. Evidence for this dust lane is still visible in the -band image, indicating a large optical depth. The central region of this galaxy is also much more extended towards the north in the -band image than in the optical, again indicating the presence of large amounts of dust that must be affecting the optical image. The complicated spiral arm and dust lane structures seen further out in the disk of this galaxy in the -band image are only faintly visible in the near-IR.
5.17 IRAS 18580+6527 (Sy 2)
This is a very large, strongly distorted system containing several luminous cores. Globally, the system is distinguished by a single large tidal tail, with amorphous extended emission opposite the tail. Previous ground-based -band images showed two distinct galaxy-like objects connected by the tidal bridge to the north, with the object to the east containing two nuclear cores (Leech et al., 1994; Auriere et al., 1996). The HST images confirm the double nuclei in the eastern object, while the central regions of the system to the west have been revealed to contain at least four comparably bright cores that could be the remnants of additional progenitor galaxies. Several of these cores show fainter, nearby hotspots. Six out of the total of seven bright regions are equally distinct in both -band and -band images, indicating that their appearance is most likely not due to dust patterns. Only one of the cores, to the south (lower right) in the -band image, has a mottled appearance in the -band image that suggests a complex dust arrangement. This system is quite likely the result of collisions of at least four or more progenitor systems.
5.18 IRAS 192970406
A ground-based -band image of this system shows a crowded field, with one main object that has chaotic morphology, but apparently a single core (Melnick & Mirabel, 1990). The HST images show that this central object is a very complicated, compact object, composed of several luminous cores embedded within a common, diffuse envelope. Only one obvious large tidal tail is seen in the -band image, but the -band image show hints of other smaller tails or loops further in towards the central region of the system. The central region of the system is equally complex in both the I and -bands, again suggesting that the multiple cores or hotspots are not simply the result of complex dust obscuration patterns. While the overall pattern of nuclei or cores is fairly similar in the two different wavebands, the relative intensities are quite different. In fact one of the most prominent nuclear remnants visible in the -band image is almost completely obscured in the -band. The brightest core appears point-like in both bands and has a short tidal feature extending from it.
5.19 IRAS 200371547 (Sy 1)
This system is dominated by the star-like nucleus of the AGN source, with one other distinct companion galaxy located within a common halo of tidal debris. Several other galaxies are located nearby. The two main progenitors are in close contact, with a large, diffuse tidal tail wrapping around their periphery. The non-AGN progenitor has a complex nuclear morphology in the -band, but is much more regular in appearance in the -band image, which indicates the presence of large amounts of dust.
5.20 IRAS 200870308 (Sy 2 or LINER?)
This system is apparently in the advanced stages of merging, with a single central body surrounded by diffuse, low surface-brightness emission, some of which is in the form of tidal tails. In ground-based optical and near-IR images the main body appears to have an elongated or distorted nuclear region, which after the application of resolution enhancement techniques appears to be double (Melnick & Mirabel, 1990; Duc, Mirabel, & Maza, 1997). In the WFPC2 -band image the nuclear region appears quite complicated in appearance, showing several bright knots or condensations. The NICMOS -band image reveals a distinct single nucleus, indicating that the knot structure seen at shorter wavelengths is due to dust obscuration. The nucleus appears to be surrounded by a bright ring structure, about 1″ in diameter. In the -band the regions surrounding the nucleus are also complicated by dust obscuration, but in the -band image these regions are quite smooth.
5.21 IRAS 201004156 (LINER?)
This system is apparently composed of at least two galaxies nearing the point of final merging. Ground-based images clearly show the two disk-like galaxies in near or grazing contact, with some mild evidence for distortions or tidal debris around the outer edges (Melnick & Mirabel, 1990; Duc, Mirabel, & Maza, 1997). The HST images show that the brightest (southern) galaxy has a long tidal tail wrapping around it and several bright knots (presumably star forming regions) within opposing spiral arms. The second brightest (northern) galaxy has one main nuclear region, with two very small knots located very close to it. Another clump of less luminous knots located a bit further away (to the northwest) could be the remnants of yet a third galaxy. The morphology of these regions is quite a bit more complicated in the -band than in the -band, suggesting the presence of complex dust patterns.
5.22 IRAS 201093003
This is a double-tailed system, with a single distinct nucleus, thus indicating that it is in the final stages of merging. The central body shows subtle features in the -band, including two bright, but very compact knots on either side of the main nucleus, and a pair of opposing arms or plumes extending outwards from the nucleus. These features show a bit more contrast in the -band.
5.23 IRAS 201764756
This system is composed of a dominant spiral galaxy, with a severely disrupted small companion. The companion is nearly in contact with the main galaxy. The companion also appears to be quite a bit fainter relative to the main galaxy in the -band image as compared to the -band, suggesting that it may be relatively blue in color. In the -band the main galaxy shows distinct spiral arm structure, as well as faint knots and loops within the central body. The -band image, however, shows considerably less complicated structure, although the main spiral arms are still visible. Almost no structural information is contained in the -band image of the companion galaxy, due to it’s very low signal level.
5.24 IRAS 204141651 (LINER)
This system has been imaged on several occasions from the ground, from optical to near-IR wavelengths (Melnick & Mirabel, 1990; Duc, Mirabel, & Maza, 1997; Surace, Sanders, & Evans, 2000). Most of these data show what appears to be either two overlapping galaxies, or one main galaxy with tidal connections to or contact with one or more fainter objects or condensations. The HST images reveal that this very compact system is composed of a single central body that is highly elongated, with hints of faint, amorphous emission surrounding it in various places. In the -band the central body has a complex morphology, containing many knots and patches of obscuration, and no clear sign of any dominant remnant nuclei. The morphology in the -band, on the other hand, is quite regular, showing a distinct central core. The central core appears to be split, however, into two components with a separation of only 0.15–0.20″.
5.25 IRAS 222062715
This is a complex interacting pair of galaxies. Initial ground-based imaging showed a single dominant object, with multiple tidal extensions, all of which appeared featureless (Clements et al., 1996b). More recent higher-resolution data revealed that there are actually two remant galaxies present, with the northern object having a roughly spherical or elliptical morphology, and the southern appearing very elongated, suggesting an edge-on disk (Surace, Sanders, & Evans, 2000). The HST images show that the northern, relatively face-on galaxy, has several clouds of diffuse tidal debris on either side of the main body. The southern edge-on galaxy has a long tidal tail extending from the its central body. The majority of this tail is quite straight and narrow, but has a remarkably sharp turn or twist in direction near the point of contact with the central body of the galaxy. The morphology in the WFPC2 -band is very complex, with evidence for many star-forming knots and dust lanes throughout the central bodies of both galaxies, as well as the tidal structures. The edge-on galaxy has so much dust obscuration in the -band that it is difficult to determine the existence or position of the remnant nucleus. In the -band the effects due to dust are drastically reduced, allowing the remnant core of this galaxy to be much more easily distinguished. Several knots and hot-spots do still appear in the -band image, however, and are coincident with the most luminous knots seen in the -band image. One of the largest of these regions is located approximately midway between the two progenitor galaxies, suggesting a region of shock-induced star formation at the point of contact.
5.26 IRAS 231285919 (Sy 2?)
This is a pair of strongly interacting galaxies very similar in appearance to the nearby NGC 4038/4039 (“Antennae”) pair. The two progenitor galaxies appear to be of similar mass and size, and each has a very long tidal tail extending over several galaxy diameters. This system has been the target of several ground-based imaging studies. Broad-band data have shown the two distinct progenitor galaxies, with a nuclear separation of 4.5″ (Zenner & Lenzen, 1993; Duc, Mirabel, & Maza, 1997). These data indicate that the southern galaxy is much redder in color than the northern galaxy. H maps show that the majority of emission is concentrated in the two nuclei, although some emission also appears between them (Mihos & Bothun, 1998).
In the HST images the central bodies of the two galaxies have a very complex morphology in both the I and -band, containing many bright knots of emission (super star clusters?), as well as complex dust obscuration patterns. In spite of the complicated morphology the two progenitor nuclei are relatively distinct and straightforward to identify. The nucleus of the southern (lower right) galaxy is relatively bright and point-like, indicating the possible existence of an active nucleus. There are numerous emission knots located very near the nuclei, as well as throughout the central bodies and on their periphery. The coincidence of many of these knots in both the I and -band images suggests that they are not simply due to local regions of low obscuration, but are in fact bright star clusters. This is supported by the similar morphologies seen in ground-based I and K images (Zenner & Lenzen, 1993), suggesting relatively little dust content.
Mihos & Bothun (1998) found that H emission line profiles in the southern galaxy of this pair were very complex, showing asymmetric shapes or double-line profiles. In several regions, two distinct kinematic profiles were indicated by the data. They also found that the H emission associated with the southern galaxy nucleus is spatially extended in the east-west direction. These observed effects are quite likely a result of the existence of the multiple subcondensations and apparent star forming regions as seen in the HST images.
5.27 IRAS 232306926 (LINER?)
This is a compact system composed of a single, amorphous body, with faint loops and shells of tidal material surrounding. This morphology suggests that it is at an advanced merger stage. Previous ground-based images showed what appeared to be two galaxies in close contact, or a single object with an elongated, but unresolvable, nuclear region (Melnick & Mirabel, 1990; Duc, Mirabel, & Maza, 1997). The WFPC2 -band image shows only one distinct and dominant nuclear core, but the near-nuclear morphology is quite complicated by dust obscuration and bright emission knots. A secondary nucleus could be obscured. The NICMOS -band image confirms this suspicion, revealing what appears to be a second remnant core located 0.6″ from the first. Both nuclei appear to be somewhat elongated along the direction of their separation. Note, however, that there is also the appearance of a dust lane running between the two nuclei, and therefore the two bright regions could be a single nucleus that is bisected by the dust lane. Some of the bright knots and regions located further out in the central body in the -band image are also visible in the NICMOS near-IR image.
6 Summary
An HST NICMOS -band survey of 27 ultraluminous infrared galaxies has shown the following.
-
•
At least 85% of the systems are obviously composed of two or more interacting galaxies, with as many as 93% showing some signs of interaction history.
-
•
Approximately 30% of the systems have existing spectra with characteristics of Seyfert 1 or 2 type nuclei. An additional 7% of the systems show a bright, unresolved nuclear source in the HST -band images, yielding a fraction of 37% of these systems with evidence for an AGN. These data do not rule out, however, the possible existence of heavily dust-enshrouded AGN or QSO.
-
•
There is often a stark contrast in the optical and near-IR morphologies of the ULIRGs. HST -band morphologies of 75–80% these systems are quite complicated and often chaotic, while only 25–30% of the -band images show similar features. The relative lack of small-scale features in the -band images suggests that a majority of such optical features are due to complicated dust morphologies and a widely distributed ensemble of hot, young star clusters.
-
•
The reduced sensitivity of -band images to the effects of dust obscuration as well as the blue colors of young star clusters has revealed more of the true nature of the underlying global stellar mass distributions in these systems. Specifically, three systems that were previously classified as containing single nuclei have been shown to contain the remnant cores of two or more galaxies. A total of seven systems that have the global morphology of a single body have been shown to contain double or multiple nuclei. Furthermore, in about a dozen systems with complicated optical morphologies and therefore no clear identification or segregation of remnant nuclei and young super star clusters, the -band images have clearly revealed the dominant core nuclei.
-
•
The difference in -band and -band morphologies of these systems serves as yet another reminder that galaxy morphology is quite wavelength-dependent, and therefore any implications for galaxy structure or evolution based on the optical morphologies of high-redshift galaxies must be treated with care (e.g. Giavalisco et al., 1996). The complicated optical morphologies taken by themselves might lead one to believe that many of the systems are in a severely disturbed or disrupted state. The -band images, on the other hand, reveal that many systems have underlying mass distributions more typical of ordinary disk-type galaxies (albeit mass distributions that have suffered the tidal warping effects of a close encounter with a companion).
References
- Ashby, Houck, & Matthews (1995) Ashby, M., Houck, J. R., & Matthews, K. 1995, ApJ, 447, 545
- Auriere et al. (1996) Auriere, M., Hecquet, J., Coupinot, G., Arthaud, R., & Mirabel, I. F. 1996, A&A, 312, 387
- Barger et al. (1998) Barger, A. J., Cowie, L. L., Sanders, D. B., Fulton, E., Taniguchi, Y., Sato, Y., Kawara, K., & Okuda, H. 1998, Nature, 394, 248
- Barger, Cowie, & Sanders (1999) Barger, A. J., Cowie, L. L., & Sanders, D. B. 1999, ApJ, 518, L5
- Blain et al. (1999) Blain, A. W., Smail, I., Ivison, R. J., & Kneib, J.-P. 1999, MNRAS, 302, 632
- Borne et al. (2000) Borne, K. D., Bushouse, H., Lucas, R. A., & Colina, L. 2000, ApJ, 529, L77
- Borne et al. (2001) Borne, K. D., Bushouse, H. A., Colina, L., & Lucas, R. A. 2001, ApJS, in preparation
- Boyce et al. (1996) Boyce, P. J., et al. 1996, ApJ, 473, 760
- Bushouse (1997) Bushouse, H. 1997, in The 1997 HST Calibration Workshop, ed. S. Casertano, R. Jedrzejewski, C. D. Keyes, & M. Stevens (Baltimore: STScI), 223
- Bushouse, Dickinson, & van der Marel (2000) Bushouse, H., Dickinson, M., & van der Marel, R. P. 2000, in ASP Conf. Ser. 216, Astronomical Data Analysis Software and Systems IX, ed. N. Manset, C. Veillet, & D. Crabtree (San Francisco: ASP), 531
- Clements et al. (1996a) Clements, D. L.,Sutherland, W. J., Saunders, W., Efstathiou, G. P., McMahon, R. G., Maddox, S., Lawrence, A., & Rowan-Robinson, M. 1996, MNRAS, 279, 459
- Clements et al. (1996b) Clements, D. L., Sutherland, W. J., McMahon, R. G., & Saunders, W. 1996, MNRAS, 279, 477
- Colina et al. (2001) Colina, L., et al. 2001, ApJ, in press
- Duc, Mirabel, & Maza (1997) Duc, P.-A., Mirabel, I. F., & Maza, J. 1997, A&AS, 124, 533
- Eales et al. (1999) Eales, S., Lilly, S., Gear, W., Dunne, L., Bond, J. R., Hammer, F., Le Fevre, O., & Crampton, D. 1999, ApJ, 515, 518
- Farrah et al. (2001) Farrah, D., et al. 2001, MNRAS, in press
- Fullmer & Lonsdale (1989) Fullmer, L., & Lonsdale, C. 1989, Cataloged Galaxies and Quasars Observed in the IRAS Survey, Version 2 (Pasadena:JPL)
- Genzel et al. (1998) Genzel, R., et al. 1998, ApJ, 498, 579
- Giavalisco et al. (1996) Giavalisco, M., Livio, M., Bohlin, R. C., Macchetto, F. D., & Stecher, T. P. 1996, AJ, 112, 369
- Holland et al. (1999) Holland, W. S., et al. 1999, MNRAS, 303, 659
- Hughes et al. (1998) Hughes, D. H., et al. 1998, Nature, 394, 241
- Kim (1995) Kim, D.-C. 1995, Ph.D. thesis, U. Hawaii
- Kim et al. (1995) Kim, D.-C., Sanders, D. B., Veilleux, S., Mazzarella, J. M., & Soifer, B. T. 1995, ApJS, 98, 129
- Kim, Veilleux, & Sanders (1998) Kim, D.-C., Veilleux, S., & Sanders, D. B. 1998, ApJ, 508, 627
- Klaas (1989) Klaas, U. 1989, A&AS, 157, 245
- Klass & Elsässer (1993) Klaas, U., & Elsässer, H. 1993, A&AS, 99, 71
- Lawrence et al. (1989) Lawrence, A., Rowan-Robinson, M., Leech, K. J., Jones, D. H. P., & Wall, J. V. 1989, MNRAS, 240, 329
- Lawrence et al. (1999) Lawrence, A. et al. 1999, MNRAS, 308, 897
- Leech et al. (1989) Leech, K. J., Penston, M. V., Terlevich, R. J., Lawrence, A., Rowan-Robinson, M., & Crawford, J. 1988, MNRAS, 240, 349
- Leech et al. (1994) Leech, K. J., Rowan-Robinson, M., Lawrence, A., & Hughes, J. D. 1994, MNRAS, 267, 253
- Lutz et al. (1998) Lutz, D., Spoon, H. W. W., Rigopoulou, D., Moorwood, A. F. M., & Genzel, R. 1998, ApJ, 505, L103
- Lutz, Veilleux, & Genzel (1999) Lutz, D., Veilleux, S., & Genzel, R. 1999, ApJ, 517, L13
- Melnick & Mirabel (1990) Melnick, J., & Mirabel, F. 1990, A&A, 231, L19
- Mihos & Bothun (1998) Mihos, J. C., & Bothun, G. D. 1998, ApJ, 500, 619
- Moshir et al. (1990) Moshir, M. et al. 1990, Infrared Astronomical Satellite Catalogs, The Faint Source Catalog, version 2 (Pasadena:JPL)
- Murphy et al. (1996) Murphy, T. W., Jr., Armus, L., Matthews, K., Sofier, B. T., Mazarrella, J. M., Shupe, D. L., Strauss, M. A., & Neugebauer, G. 1996, AJ, 111, 1025
- Rigopoulou et al. (1999) Rigopoulou, D., Spoon, H. W. W., Genzel, R., Lutz, D., Moorwood, A. F. M., & Tran, Q. D. 1999, AJ, 118, 2625
- Rowan-Robinson (1991) Rowan-Robinson, M. 1991, in Dynamics of Molecular Cloud Distributions, eds. F. Combes & F. Fasoli, 211 (Dordrecht: Kluwer)
- Sanders (2000) Sanders, D. B. 2000, in Ultraluminous Galaxies: Monsters or Babies?, in press
- Sanders & Mirabel (1996) Sanders, D. B., & Mirabel, I. F. 1996, ARA&A, 34, 749
- Sanders et al. (1988a) Sanders, D. B., Soifer, B. T., Elias, J. H., Madore, B. F., Matthews, K., Neugebauer, G., & Scoville, N. Z. 1988a, ApJ, 325, 74
- Sanders et al. (1988b) Sanders, D. B., Soifer, B. T., Elias, J. H., Neugebauer, G., & Matthews, K. 1988b, ApJ, 328, L35
- Sanders et al. (1989) Sanders, D. B., Phinney, E. S., Neugebauer, G., Soifer, B. T., & Matthews, K. 1989, ApJ, 347, 29
- Scoville et al. (2000) Scoville, N. Z., et al. 2000, AJ, 119, 991
- Smail, Ivison, & Blain (1997) Smail, I., Ivison, R. J., & Blain, A. W. 1997, ApJ, 490, L5
- Soifer et al. (1984) Soifer, B. T., et al. 1984, ApJ, 278, L71
- Soifer et al. (1987) Soifer, B. T., Sanders, D. B., Madore, B. F., Neugebauer, G., Danielson, G. E., Elias, J. H., Lonsdale, C. J., & Rice, W. L. 1987, ApJ, 320, 238
- Surace et al. (1998) Surace, J. A., Sanders, D. B., Vaca, W. D., Veilleux, S., & Mazzarella, J. M. 1998, ApJ, 492, 116
- Surace, Sanders, & Evans (2000) Surace, J. A., Sanders, D. B., & Evans, A. S. 2000, ApJ, 529, 170
- Veilleux et al. (1995) Veilleux, S., Kim, D.-C., Sanders, D. B., Mazzarella, J. M., & Soifer, B. T. 1995, ApJS, 98, 171
- Veilleux, Kim, & Sanders (1999) Veilleux, S., Kim, D.-C., & Sanders, D. B. 1999, ApJ, 522, 113
- Veilleux, Sanders, & Kim (1999) Veilleux, S., Sanders, D. B., & Kim, D.-C. 1999, ApJ, 522, 139
- Zenner & Lenzen (1993) Zenner, S., & Lenzen, R. 1993, A&AS, 101, 363
- Zheng et al. (1999) Zhen, Z., Wu, H., Mao, S., Xia, X.-Y., Deng, Z.-G., & Zou, Z.-L. 1999, A&A, 349, 735
- Zhenlong et al. (1991) Zhenlong, Z., Xiaoyong, X., Zugan, D., & Hongjun, S. 1991, MNRAS, 252, 593
| aa, assuming and . | Spectral | |||||||||
|---|---|---|---|---|---|---|---|---|---|---|
| Name | (Jy) | (Jy) | (Jy) | (Jy) | (log ) | / | ClassbbKey: SB = Starburst; LI = LINER; S1 = Seyfert 1; S2 = Seyfert 2. a,b - data for individual galaxies; a?b - data inconclusive for distinguishing between types; ab - data show type a dominant over type b; ab - data show characteristics of both types. | Ref. | ||
| IRAS 035386432 | 0.301 | 0.06 | 0.06 | 0.99 | 1.30 | 12.46 | 0.07 | 25.33 | ||
| IRAS 044132608 | 0.171 | 0.31 | 0.31 | 0.82 | 2.23 | 11.87 | 0.38 | S2 | 1 | 24.77 |
| IRAS 052332334 | 0.172 | 0.06 | 0.06 | 0.53 | 1.16 | 11.69 | 0.11 | 24.37 | ||
| IRAS 062066315 | 0.092 | 0.07 | 0.29 | 3.96 | 4.58 | 12.00 | 0.07 | S2 | 2 | 24.17 |
| IRAS 062683509 | 0.170 | 0.26 | 0.25 | 0.94 | 1.09 | 11.92 | 0.27 | 24.47 | ||
| IRAS 063616217 | 0.160 | 0.11 | 0.17 | 1.66 | 2.01 | 12.11 | 0.10 | 23.89 | ||
| IRAS 065611902 | 0.188 | 0.29 | 0.28 | 1.01 | 1.32 | 12.05 | 0.28 | 24.08 | ||
| IRAS 073813215 | 0.170 | 0.07 | 0.14 | 0.67 | 0.83 | 11.78 | 0.21 | 24.14 | ||
| IRAS 105583845 | 0.207 | 0.05 | 0.09 | 0.62 | 0.75 | 11.92 | 0.14 | 24.31 | ||
| IRAS 110950238 | 0.107 | 0.13 | 0.42 | 3.25 | 2.53 | 12.04 | 0.13 | LI | 2 | 23.00 |
| IRAS 133526402 | 0.237 | 0.06 | 0.08 | 0.99 | 1.43 | 12.24 | 0.08 | 23.91 | ||
| IRAS 134695833 | 0.158 | 0.05 | 0.07 | 1.27 | 1.73 | 11.99 | 0.06 | SB | 3 | 24.27 |
| IRAS 143783651 | 0.068 | 0.12 | 0.52 | 6.19 | 6.34 | 11.92 | 0.08 | S2 | 2 | 23.66 |
| IRAS 161590402 | 0.213 | 0.18 | 0.30 | 0.98 | 1.77 | 12.14 | 0.31 | 24.86 | ||
| IRAS 164554553 | 0.191 | 0.06 | 0.08 | 0.94 | 1.59 | 12.03 | 0.09 | 23.70 | ||
| IRAS 165415301 | 0.194 | 0.05 | 0.07 | 0.68 | 1.28 | 11.90 | 0.11 | S2 | 1 | 24.72 |
| IRAS 185806527 | 0.176 | 0.05 | 0.07 | 0.76 | 1.40 | 11.87 | 0.09 | S2,SB | 1 | 25.12 |
| IRAS 192970406 | 0.086 | 0.13 | 0.59 | 7.05 | 7.72 | 12.19 | 0.08 | SB | 4 | 24.09 |
| IRAS 200371547 | 0.192 | 0.13 | 0.28 | 1.65 | 1.98 | 12.28 | 0.17 | S1 | 1 | 26.28 |
| IRAS 200870308 | 0.106 | 0.13 | 0.24 | 4.70 | 6.54 | 12.20 | 0.05 | S2?LI | 2 | 24.51 |
| IRAS 201004156 | 0.130 | 0.13 | 0.34 | 5.23 | 5.16 | 12.42 | 0.07 | SBLI | 2 | 24.30 |
| IRAS 201093003 | 0.143 | 0.06 | 0.24 | 0.85 | 1.33 | 11.72 | 0.28 | 23.74 | ||
| IRAS 201764756 | 0.178 | 0.07 | 0.08 | 0.88 | 1.47 | 11.93 | 0.09 | 23.98 | ||
| IRAS 204141651 | 0.087 | 0.65 | 0.35 | 4.36 | 5.25 | 11.99 | 0.08 | LISB | 2 | 23.51 |
| IRAS 222062715 | 0.131 | 0.10 | 0.16 | 1.75 | 2.33 | 11.96 | 0.09 | SB | 3 | 24.27 |
| IRAS 231285919 | 0.045 | 0.24 | 1.59 | 10.80 | 10.99 | 11.80 | 0.15 | SB+LI+S2 | 2 | 23.81 |
| IRAS 232306926 | 0.106 | 0.06 | 0.29 | 3.74 | 3.42 | 12.10 | 0.08 | LI+SB | 2 | 23.80 |
References. — (1) Lawrence et al. 1999; (2) Duc, Mirabel, & Maza 1997; (3) Veilleux, Kim, & Sanders 1999; (4) Veilleux et al. 1995.
| Unresolved | |||
|---|---|---|---|
| Name | Global | NuclearaaFor systems designated as a pair, a nuclear morphology of “Single” indicates that each galaxy has a single nucleus. | Nucleus? |
| IRAS 035386432 | Single main body with tail | Double | no |
| IRAS 044132608 | Pair | Single | yes |
| IRAS 052332334 | Single in group | Single | no |
| IRAS 062066315 | Pair with tails | Single | no |
| IRAS 062683509 | Pair with tails | Single | no |
| IRAS 063616217 | Single with possible companion | Single | no |
| IRAS 065611902 | Pair | Single | no |
| IRAS 073813215 | Single | Single | no |
| IRAS 105583845 | Single main body | Double | no |
| IRAS 110950238 | Single main body with tails | Double | no |
| IRAS 133526402 | Pair with tail | Single | no |
| IRAS 134695833 | Pair with tails | Single | no |
| IRAS 143783651 | Single | Single | yes |
| IRAS 161590402 | Pair | Single | yes |
| IRAS 164554553 | Single with tails | Single | no |
| IRAS 165415301 | Pair | Single | yes |
| IRAS 185806527 | Group with tails | Multiple? | no |
| IRAS 192970406 | Single main body | Double | yes |
| IRAS 200371547 | Pair? | Single | yes |
| IRAS 200870308 | Single main body with tails | Single | no |
| IRAS 201004156 | Pair with tails | Single | no |
| IRAS 201093003 | Single with tails | Single | no |
| IRAS 201764756 | Single with possible companion | Single | no |
| IRAS 204141651 | Single with tidal debris | Double? | no |
| IRAS 222062715 | Pair with tails | Single | no |
| IRAS 231285919 | Pair with tails | Single | yes |
| IRAS 232306926 | Single main body with tails | Double | no |