THE CONTINUING RADIO EVOLUTION OF SN 1970G
Abstract
Using the Very Large Array, we have detected radio emission from the site of SN 1970G in the Sc galaxy M101. These observations are 31 years after the supernova event, making SN 1970G the longest monitored radio supernova. With flux densities of mJy at 6 cm and mJy at 20 cm, the spectral index of appears to have flattened somewhat when compared with the previously reported value of , taken in 1990. The radio emission at 20 cm has decayed since the 1990 observations with a power-law index of . We discuss the radio properties of this source and compare them to those of other Type II radio supernovae.
1 Introduction
SN 1970G, a Type II supernova (SN) in M101 (Lovas 1970; Kirshner et al. 1973), was the first SN to be detected in the radio Gottesman et al. (1972); Allen et al. (1976). It then faded from view Weiler et al. (1986) until it was recovered again in 1990 (Cowan, Goss & Sramek 1991; hereafter referred to as CGS). SN 1970G is one of a very rare group of SNe that have been recovered in the radio more than a decade following maximum optical light and is now - 31 years after outburst - the longest monitored such object.
Intermediate-age radio supernovae (RSNe) have been defined as having ages from 10–100 years old (Cowan & Branch 1985), spanning the period well after the optical emission fades (usually about 2 years) and before the turn-on of radio emission from the supernova remnant (SNR). Chevalier (1984) proposes that synchrotron radiation is produced in the region of interaction between the ejected supernova shell and the circumstellar shell that originated from the prior mass loss of the progenitor star. In such models the radio emission drops as the expanding shock wave propagates outward through the surrounding and decreasingly dense circumstellar material (CSM). Radio emission from SNRs is normally observed long after the supernova phase. Such factors as the density of the local interstellar medium affect the turn-on time in models such as those of Cowsik & Sarkar (1984) based upon the Gull (1973) piston model. These models typically suggest a minimum of 100 years for the formation and brightening of an SNR. The intermediate-age time period is, therefore, critical in understanding the later stages of stellar evolution. In particular, the circumstellar mass-loss rate for the supernova progenitors is a crucial component in the initiation and duration of radio emission in models, such as those of Chevalier (1984).
To study this transition period from SN to SNR, we and others have attempted to detect radio emission from intermediate-age SNe. While there have been a number of unsuccessful searches, a few supernovae have been detected in the radio more than a decade after explosion [SNe 1923A, 1950B & 1957D in M83 Cowan & Branch (1985); Cowan et al. (1994); Eck et al. (1998), SN 1961V in NGC 1058 Cowan et al. (1988); Stockdale et al. (2001), SN 1968D in NGC 6946 Hyman et al. (1995), and SN 1978K in NGC 1313 Ryder et al. (1993)]. One of the motivations for these studies has been that individual decades-old supernovae, such as SN 1970G, can undergo abrupt and rapid changes in flux densities on a timescale of only a few years. Such variability was seen in the radio emission from SN 1980K, which abruptly dropped after ten years of slow decline Weiler et al. (1992); Montes et al. (1998). Also the radio luminosity from SN 1979C, after declining steadily for years, has flattened and become relatively constant, perhaps as a result of the supernova shock wave hitting a denser region of the CSM Montes et al. (2000). Observations also indicate that SN 1957D, after being relatively constant ( 3 mJy), suddenly (in two years) faded below ( 1 mJy) the level of an associated H II region Cowan et al. (1994).
In this paper, we report new radio observations of SN 1970G, its current flux density and spectral index, and examine how its radio emission has varied during the time it has been monitored.
2 Observations and Results
The new Very Large Array111The National Radio Astronomy Observatory is a facility of the National Science Foundation operated under cooperative agreement by Associated Universities, Inc. (VLA) data on SN 1970G were taken from six observing runs. In the first three, SN 1970G was observed for 4.5 total hours on 4 and 6 November and 3 December 2000, at 20 cm (1.425 GHz) using the VLA’s most extended (A) configuration, with a maximum baseline of 34 km. During the second group of observing runs, SN 1970G was observed on 10 January 2001 with the VLA in its A configuration and on 5 and 21 February 2001 with VLA in its BnA configuration (maximum baseline of 24 km) at 6cm (4.860 GHz) for a total of 6.5 hours. These observations were done using the standard VLA continuum mode, obtaining a total of 100 MHz bandwidth in each of the two orthogonal circular polarizations. The phase calibrator was J1400+621 and 3C286 was used to set the flux density scale. In all observations the pointing center was and (J2000), and flux densities for 3C286 were taken from Perley, Butler, & Zijlstra (2001).
Data were Fourier transformed and deconvolved using the CLEAN algorithm as implemented in the AIPS routine IMAGR, with the Brigg’s robustness parameter of , which minimizes the point-spread function while maximizing sensitivity. The 20 cm and 6 cm observations of the region from 1990 were also re-analyzed using the same data reduction procedures and inputs as were used on the current data. The re-calculated results are presented in Table 1.
The 6 cm observations were combined using the AIPS routine DBCON, and a final 6 cm image was produced. The AIPS routine CONVL was used to correct for differences in the beam size and shape since they were taken in different array configurations. The 6 cm convolved beam size was set to be .
The peak flux density and position for SN 1970G were estimated in three ways using the AIPS routines IMFIT, JMFIT, and SLICE. SLICE produces a series of one dimensional plots of flux densities vs. position at constant right ascension and then at constant declination. The SLICE plots were examined for baseline offsets owing to the nearby H II region, NGC 5455 [centered from SN 1970G]. The results from the SLICE analysis are given in Table 1; the results from all three analysis methods agree to within the errors shown.
The position measured for SN 1970G, from the new images and the re-analysis of the 20 cm observations taken in 1990, is and . Uncertainties in the peak intensities are reported as the rms noise from the observations. At 20 cm, the beam size is , p.a. = , and the rms noise is 0.015 mJy beam-1. At 6 cm, the beam size is , p.a. = , and the rms noise is 0.020 mJy beam-1. The results of our analyses are presented in Table 1 and Figure 1.
3 Discussion and Conclusions
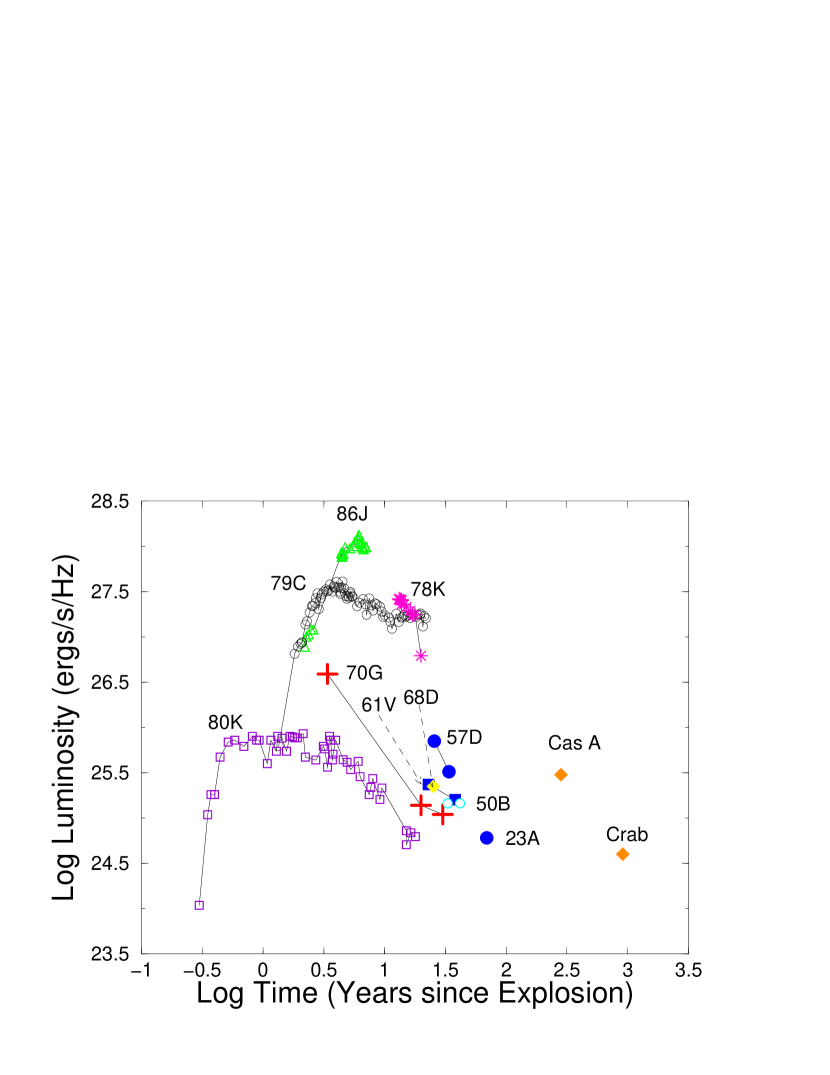
We have detected a radio source at the position of SN 1970G at 20 cm and 6 cm, coincident, within the error limits, with the CGS position. Our measured flux density at 20 cm indicates a reduction in the 20 cm flux density of only 11% from 1990 to 2000 (see Table 1). And, extrapolating from the 3.5 and 20 cm measurements reported by CGS, the 6 cm flux density in 1990 would have been 0.11 mJy, which is virtually identical to the current value of mJy (see Table 1). The CGS observations indicated that the flux density of SN 1970G had dropped between 1974 and 1990 with a power-law index () of at 20 cm. Assuming the CGS power-law decline and spectral index from 1990, we would expect a much lower 6cm flux density, 0.050 mJy, and 20 cm flux density, 0.090 mJy than we now measure. The radio light-curve for SN 1970G between 1990 and 2000 has flattened considerably and (based upon the 20 cm flux densities) the power-law index is now . We illustrate this dramatic change in slope in the radio evolution of SN 1970G in Figure 2; where we show the radio light curves of several intermediate-age SNe along with a few SNRs, plotting the time since supernova explosion versus the luminosity at 20 cm (i.e. the monochromatic luminosity).
As indicated in Table 1 (and shown in Figure 1), our new observations indicate that SN 1970G is still a (marginally) non-thermal radio source. The current spectral index, , of has flattened from the value of reported in 1990 by CGS, although the error bars are rather large. We might expect a possible flattening of the radio spectrum as the emission from SN 1970G continues to fade. Such was the case for SN 1957D, in M83, which had a very similar spectra index, , at a comparable age to SN 1970G (Cowan & Branch 1985). The thermal spectral index reported by Cowan et al. (1994) for SN 1957D is actually due to the associated H II region that is now brighter than the faded supernova. However, there has been no optical detection of an associated H II region coincident with SN 1970G, and thus it should be possible to continue to follow the time evolution of the flux density and the spectral index for this supernova for many years.
The current and previous values of the spectral index, luminosity, and decay index for SN 1970G are within a range of values reported for other intermediate-age RSNe at similar ages and wavelengths (See Table 1, Figure 2, and Stockdale et al. 2001). It is clear, for example, from Figure 2 that the radio luminosity of SN 1970G at an age of 30 years is very close to that of the Type II SNe 1950B and 1957D, in M83, SN1968D, in NGC 6946, and SN 1961V, in NGC 1058, at the same stage in their evolution (Cowan et al. 1994; Hyman et al. 1995; Stockdale et al. 2001). This correlation in luminosity also lends credence to the identification of SNe 1950B and 1961V as Type II SNe. In particular, there has been some uncertainty in the optical position of SN 1950B that prevented a conclusive identification of the supernovae with the radio source Cowan & Branch (1985); Cowan et al. (1994). In the case of SN 1961V, recent optical observations have caused some debate whether it was a supernova event or a luminous blue variable (LBV) Goodrich et al. (1989). On the other hand, recent radio observations of SNe 1961V strongly suggest a supernova interpretation for this event Stockdale et al. (2001).
The evolution of the radio flux density of SN 1970G is consistent with the current models for radio emission from SNe, which predict a general decline in radio luminosity with age and declining density of CSM. Figure 2 illustrates that trend for a number of intermediate-age RSNe, with a general flattening of the radio light curve 10-40 years after the supernova event. While SNe 1970G, 1961V, and 1950B are decaying at different rates, we note that all of their radio light curves are noticeably flatter than that of SN 1957D at similar epochs. The differences in the behavior of the individual SNe (e.g. the rates at which their radio luminosities fade) could therefore be explained in terms of the density of the material encountered by the supernova shock. Thus, for example, the shocks associated with some RSNe (e.g. SNe 1979C, 1970G, and 1961V) might be traveling through considerably denser CSM than other similarly-aged RSNe (e.g., SNe 1980K and 1957D). Consistent with this interpretation is the very rapid decline and disappearance of the radio emissions of Type Ib RSNe, e.g. SNe 1983N and 1984L, which presumably have lower density CSM than Type II SNe Weiler et al. (1986); Sramek et al. (1984); Panagia et al. (1986).
One scenario which might explain this increased density of CSM around some Type II RSNe could be that the progenitors underwent large-scale eruptions, akin to LBVs, prior to the supernova event. The mass loss rates during an LBV eruption can be 10—100 larger than the typical supergiant mass-loss rate Humphreys & Davidson (1994). The exact epoch at which this may have occurred depends on the ejection velocities of the CSM during these events, the rate of expansion of the supernova shock, and the density of the CSM. Unfortunately RSNe are too under-sampled to make any definitive statements as to the exact nature of such a possible outburst or mass loss. Clearly, additional radio monitoring of SN 1970G, and other RSNe, will be important in understanding the continuing evolution and nature of these relatively rare objects.
References
- Allen et al. (1976) Allen, R. J., Goss, W. M., Ekers, R. D., & de Bruyn, A. G. 1976, Astr. Ap., 48, 253
- Chevalier (1984) Chevalier, R. A. 1984, ApJ, 285, L63
- Cowan & Branch (1985) Cowan, J. J. & Branch, D., 1985, ApJ., 293, 400
- Cowan et al. (1991) Cowan J. J., Goss, W. M., & Sramek, R. A. 1991, ApJ, 379, L49
- Cowan et al. (1988) Cowan, J. J., Henry, R. B. C., & Branch, D. 1988, ApJ, 329, 116
- Cowan et al. (1994) Cowan, J. J., Roberts, D. A., & Branch, D. 1994, ApJ, 434, 128
- Cowsik & Sarkar (1984) Cowsik, R., & Sarkar, S. 1984, MNRAS, 207, 745
- Eck et al. (1998) Eck, C. R., Cowan, J. J., & Branch, D. 1998, ApJ, 508, 664
- Ferrarese et al. (1996) Ferrarese, L. et al. 1996, ApJ, 464, 568
- Goodrich et al. (1989) Goodrich, R. W., Stringfellow, G. S., Penrod, G. D., & Filippenko, A. V. 1989, ApJ, 342, 908
- Gottesman et al. (1972) Gottesman, S. T., Broderick, J. J., Brown, R. L., Balick, B., and Palmer, P. 1972, Ap. J., 174, 383
- Gull (1973) Gull, S. F. 1973, MNRAS, 161, 47
- Humphreys & Davidson (1994) Humphreys, R. A., & Davidson, K., 1994, PASP, 106, 1025
- Hyman et al. (1995) Hyman, S. D., Van Dyk, S. D., Weiler, K. W., & Sramek, R. A. 1995, ApJ, 443, L77
- Kelson et al. (1996) Kelson, D. et al. 1996, ApJ, 463, 26
- Kirshner et al. (1973) Kirshner, R. P., Oke, J. B., Penston, M. V., & Searle, L. 1973, ApJ, 185, 303
- Lovas (1970) Lovas, F. J. 1970, IAU Circ. 2269
- Montes et al. (1998) Montes, M. J., Van Dyk, S. D., Weiler, K. W., Sramek, R. A., & Panagia, N. 1998, ApJ, 506, 874
- Montes et al. (2000) Montes, M. J., Weiler, K. W., Van Dyk, S. D., Panagia, N., Lacey, C. K., Sramek, R. A., & Park, R. 2000, ApJ, 532, 1124
- Panagia et al. (1986) Panagia, N., Sramek, R. A., & Weiler, K. W. 1986, ApJ, 300, L55
- Pearly et al. (2001) Perley, R., Butler, B.J., & Zijlstra, A. 2001, in prep.
- Ryder et al. (1993) Ryder, S., Staveley-Smith, L., Dopita, M., Petre, R., Colbert, E., Malin, D., & Schlegel, E. 1993, ApJ, 416, 167
- Rupen et al. (1987) Rupen, M. P., van Gorkom, J. H., Knapp, G. R., & Gunn, J. E. 1987, AJ, 94, 61
- Saha et al. (1995) Saha, A., Sandage, A., Labhardt, L., Schwengler, H., Tammann, G. A., Panagia, N., & Macchetto, F. D. 1995, ApJ, 438, 8
- Schlegel et al. (1999) Schlegel, E. M., Ryder, S., Staveley-Smith, L., Petre, R., Colbert, E., Dopita, M., & Campbell-Wilson, D. 1999, AJ, 118, 2689
- Silbermann et al. (1996) Silbermann, N. A. et al. 1996, ApJ, 470, 1
- Sramek et al. (1984) Sramek, R. A., Panagia, N., & Weiler, K. W. 1984, ApJ, 285, L59
- Stockdale et al. (2001) Stockdale, C. J., Rupen, M. P., Cowan, J. J., Chu, Y.-H., & Jones, S. S. 2001, AJ, 122, 283
- Tully (1988) Tully, R. B. 1988, Nearby Galaxies Catalog (Cambridge: Cambridge Univ. Press)
- Weiler et al. (1990) Weiler, K. W., Panagia, N., & Sramek, R. A. 1990, ApJ, 364, 611
- Weiler et al. (1986) Weiler, K. W., Sramek, R. A., Panagia, N., van der Hulst, J. M., & Salvati, M. 1986, ApJ, 301, 790
- Weiler et al. (1992) Weiler, K. W., Van Dyk, S. D., Panagia, N., & Sramek, R. A. 1992, ApJ, 398, 248
- Weiler et al. (1991) Weiler, K. W., van Dyk, S. D., Panagia, N., Sramek, R. A., & Discenna, J. L. 1991, ApJ, 380, 161
| SN 1970G | SN 1961V | SN 1957D | SN 1950B | |
|---|---|---|---|---|
| Right Ascension (J2000) | ||||
| Declination (J2000) | ||||
| Distance (Mpc) | 7.4 | 9.3 | 4.1 | 4.1 |
| Most Recent 20 cm | ||||
| Flux density (mJy) | ||||
| Supernova age (years) | 30.29 | 37.76 | 34.04 | 41.80 |
| Luminosity (ergs s-1 Hz-1) | 1.1 | 1.5 | 2.4 | 1.4 |
| Early 20 cm | ||||
| Flux density (mJy) | ||||
| Supernova age (years) | 19.74 | 22.93 | 25.24 | 33.00 |
| Luminosity (ergs s-1 Hz-1) | 1.2 | 2.4 | 5.3 | 1.4 |
| Most Recent 6 cm | ||||
| Flux Density (mJy) | ||||
| Supernova age (years) | 30.50 | 38.12 | 32.82 | 40.58 |
| Luminosity (ergs s-1 Hz-1) | 7.9 | 6.5 | 2.8 | 7.4 |
| Most Recent Spectral Indexaa , measured between 20 cm and 6 cm, execept for the earlier SN 1970G which was measured between 20 cm and 3.5 cm | ||||
| Earlier Spectral Indexaa , measured between 20 cm and 6 cm, execept for the earlier SN 1970G which was measured between 20 cm and 3.5 cm | ||||
| Most Recent 20 cm Decay Indexbb |