Gamma-Ray Bursts as a Probe of Cosmology 11institutetext: Department of Astronomy & Astrophysics, University of Chicago, 5640 South Ellis Avenue, Chicago, IL 60637 22institutetext: Department of Astronomy, California Institute of Technology, Mail Code 105-24, 1201 East California Boulevard, Pasadena, CA 91125
Gamma-Ray Bursts as a Probe of Cosmology
Abstract
We show that, if the long GRBs are produced by the collapse of massive stars, GRBs and their afterglows may provide a powerful probe of cosmology and the early universe.
1 Introduction
There is increasingly strong evidence that gamma-ray bursts (GRBs) are associated with star-forming galaxies [1,2,3,4] and occur near or in the star-forming regions of these galaxies [2,3,4,5,6]. These associations provide indirect evidence that at least the long GRBs detected by BeppoSAX are a result of the collapse of massive stars. The discovery of what appear to be supernova components in the afterglows of GRBs 970228 [7,8] and 980326 [9] provides tantalizing direct evidence that at least some GRBs are related to the deaths of massive stars, as predicted by the widely-discussed collapsar model of GRBs [10,11,12,13,14]. If GRBs are indeed related to the collapse of massive stars, one expects the GRB rate to be approximately proportional to the star-formation rate (SFR).
2 Detectability of GRBs and Their Afterglows


We have calculated the limiting redshifts detectable by BATSE and HETE-2, and by Swift, for the sixteen GRBs with well-established redshifts and published peak photon number fluxes. In doing so, we have used the peak photon number fluxes given in Table 1 of [15], taken a detection threshold of 0.2 ph s-1 for BATSE and HETE-2 and 0.04 ph s-1 for Swift, and set km s-1 Mpc-1, , and (other cosmologies give similar results). Figure 1 displays the results. This figure shows that BATSE and HETE-2 would be able to detect half of these GRBs out to a redshift and 20% of them out to a redshift . Swift would be able to detect half of them out to redshifts , and 20% of them out to a redshift , although it is unlikely that GRBs occur at such extreme redshifts. Consequently, if GRBs occur at very high ( redshifts (VHRs), BATSE has probably already detected GRBs at these redshifts, and HETE-2 and Swift should detect them as well.
The soft X-ray, optical and infrared afterglows of GRBs are also detectable out to VHRs. The effects of distance and redshift tend to reduce the spectral flux in GRB afterglows in a given frequency band, but time dilation tends to increase it at a fixed time of observation after the GRB, since afterglow intensities tend to decrease with time. These effects combine to produce little or no decrease in the spectral energy flux of GRB afterglows in a given frequency band and at a fixed time of observation after the GRB with increasing redshift:
| (1) |
where is the intrinsic spectral luminosity of the GRB afterglow, which we assume applies even at early times, and is the comoving distance to the burst. Many afterglows fade like , which implies that in the simplest afterglow model, where [16]. In addition, increases very slowly with redshift at redshifts greater than a few. Consequently, there is little or no decrease in the spectral flux of GRB afterglows with increasing redshift beyond .
In fact, in the simplest afterglow model where , if the afterglow declines more rapidly than , the spectral flux actually increases as one moves the burst to higher redshifts! An example of this is the afterglow of GRB 000131. Its peak flux was in the top 5% of all BATSE bursts and the break energy in its spectrum was 164 keV, yet it occurred at a redshift . We have calculated the best-fit spectral flux distribution of the afterglow of GRB 000131 from [17], as observed three days after the burst, transformed to various redshifts. The transformation involves (1) dimming the afterglow, (2) redshifting its spectrum, (3) time dilating its light curve, and (4) extinguishing the spectrum using a model of the Ly forest (for details, see [15]). Finally, we have convolved the transformed spectra with a top hat smearing function of width . This models these spectra as they would be sampled photometrically, as opposed to spectroscopically; i.e., this transforms the model spectra into model spectral flux distributions.
Figure 2 shows the resulting spectral flux distribution. The spectral flux distribution of the afterglow is cut off by the Ly forest at progressively lower frequencies as one moves out in redshift. Thus high redshift afterglows are characterized by an optical “dropout” [4], and VHR afterglows by a near infrared “dropout.” We conclude that, if GRBs occur at very high redshifts, both they and their afterglows can be easily detected.
3 GRBs as a Probe of Cosmology and the Early Universe
Theoretical calculations show that the birth rate of Pop III stars produces a peak in the SFR in the universe at redshifts , while the birth rate of Pop II stars produces a much larger and broader peak at redshifts [18,19,20]. Therefore one expects GRBs to occur out to at least and possibly , redshifts that are far larger than those expected for the most distant quasars.
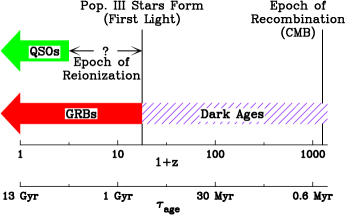
Figure 3 places GRBs in a cosmological context. At recombination, which occurs at redshift , the universe becomes transparent. The cosmic background radiation originates at this redshift. Shortly afterwards, the temperature of the cosmic background radiation falls below 3000 K and the universe enters the “dark ages” during which there is no visible light in the universe. “First light,” which occurs at , corresponds to the epoch when the first stars form. Ultraviolet radiation from these first stars and/or from the first active galactic nuclei re-ionizes the universe. Afterward, the universe is transparent in the ultraviolet.

QSOs are currently the most powerful probes of the high redshift universe. GRBs have several advantages relative to QSOs as probes of cosmology. First, GRBs are expected to occur out to , whereas QSOs occur out to only . Second, very high redshift GRB afterglows can be 100 - 1000 times brighter at early times than are high redshift QSOs. This makes possible very sensitive high dispersion spectroscopy of the metal absorption lines and the Lyman forest in the spectrum of the afterglows. Third, no “proximity effect” on intergalactic distances scales is expected for GRBs and their afterglows, in contrast to QSOs. Thus GRBs may be relatively “clean” probes of the intergalactic medium, the Lyman forest, and damped Lyman clouds, even in the vicinity of the GRBs.
The important cosmological questions that observations of GRBs and their afterglows may be able to address include the following:
Information about the epoch of “first light” and the earliest generations of stars from merely the detection of GRBs at very high redshifts;
Information about the growth of metallicity in the universe in the star-forming entities in which the bursts occur, in damped Lyman clouds, and in the Lyman forest from observations of the metal absorption line systems in the spectra of their afterglows;
Information about the large-scale structure of the universe at VHRs from the clustering of the Lyman forest lines and the metal absorption-line systems in the spectra of their afterglows; and
Information about the epoch of re-ionization from the depth of the Lyman break in the spectra of their afterglows.
Below we consider the first of these questions: the epoch of “first light” and the earliest generations of stars.
4 GRBs as a Probe of Star Formation
Observational estimates [21,22,23,24] indicate that the SFR in the universe was about 15 times larger at a redshift than it is today. The data at higher redshifts from the Hubble Deep Field (HDF) in the north suggests a peak in the SFR at [24], but the actual situation is highly uncertain.
In Figure 4, we have plotted the SFR versus redshift from a phenomenological fit [25] to the SFR derived from submillimeter, infrared, and UV data at redshifts , and from a numerical simulation by [18] at redshifts . The simulations done by [18] indicate that the SFR increases with increasing redshift until , at which point it levels off. The smaller peak in the SFR at corresponds to the formation of Population III stars, brought on by cooling by molecular hydrogen. Since GRBs are detectable at these VHRs and their redshifts may be measurable from the absorption-line systems and the Ly break in the afterglows [4], if the GRB rate is proportional to the SFR, then GRBs could provide unique information about the star-formation history of the VHR universe.

We have calculated the expected number of stars as a function of assuming (1) that the GRB rate is proportional to the SFR111This may underestimate the GRB rate at VHRs since it is generally thought that the initial mass function will be tilted toward a greater fraction of massive stars at VHRs because of less efficient cooling due to the lower metallicity of the universe at these early times., and (2) that the SFR is that given in Figure 4 (see [15] for details). The left panel of Figure 5 shows our results for for an assumed cosmology and (other cosmologies give similar results). The solid curve corresponds to the star-formation rate in Figure 4; the dashed curve corresponds to the star-formation rate derived by [24]. Figure 5 shows that peaks sharply at and then drops off fairly rapidly at higher , with a tail that extends out to . The rapid rise in out to is due to the rapidly increasing volume of space. The rapid decline beyond is due almost completely to the “edge” in the spatial distribution produced by the cosmology. In essence, the sharp peak in at reflects the fact that the SFR we have taken is fairly broad in , and consequently, the behavior of is dominated by the behavior of the co-moving volume ; i.e., the shape of is due almost entirely to cosmology. The right panel in Figure 5 shows the cumulative distribution of the number of stars expected as a function of redshift . The solid and dashed curves have the same meaning as in the upper panel. Figure 5 shows that for the particular SFR we have assumed, of all stars (and therefore of all GRBs) have redshifts .
5 Conclusions
If the long GRBs are indeed produced by the collapse of massive stars, one expects GRBs to occur out to , redshifts that are far larger than those expected for the most distant QSOs. We have shown that both GRBs and their afterglows are easily detected out to these VHRs. GRBs can therefore give us information about the star-formation history of the universe, including the earliest generations of stars. The absorption-line systems and the Ly forest visible in the spectra of GRB afterglows can be used to trace the evolution of metallicity in the universe, and to probe the large-scale structure of the universe at VHRs. Finally, measurement of the Ly break in the spectra of GRB afterglows can be used to constrain, or possibly measure, the epoch at which re-ionization of the universe occurred.
References
- (1) Castander, F. J., & Lamb, D. Q. 1999, ApJ, 523, 593
- (2) Fruchter, A. S., et al. 1999, ApJ, 516, 683
- (3) Kulkarni, S. R., et al. 1998, Nature, 395, 663
- (4) Fruchter, A. S. 1999, ApJ, 516, 683
- (5) Sahu, K. C., et al. 1997, Nature, 387, 476
- (6) Kulkarni, S. R., et al. 1999, Nature, 398, 389
- (7) Reichart, D. E., 1999, ApJ, 521, L111
- (8) Galama, T. J., et al. 2000, ApJ, 536, 185
- (9) Bloom, J. S., et al. 1999, Nature, 401, 453
- (10) Woosley, S. E. 1993, ApJ, 405, 273
- (11) Woosley, S. E. 1996, in Gamma-Ray Bursts, eds. C. A. Meegan, R. D. Preece, & T. M. Koshut (New York: AIP), 520
- (12) Paczyński, B. 1998, ApJ, 494, L45
- (13) MacFadyen, A. I., & Woosley, S. E. 1999, ApJ, 524, 262
- (14) Wheeler, J. C., et al. 2000, ApJ, 537, 810
- (15) Lamb, D. Q., & Reichart, D. E., 2000, ApJ, 536, 1
- (16) Wijers, R. A. M. J., Rees, M. J., & Mészáros, P. 1997, MNRAS, 288, L51
- (17) Andersen, M. I., et al. 2000, A&A, 364, L54
- (18) Ostriker, J. P., & Gnedin, N. Y. 1996, ApJ, 472, L63
- (19) Gnedin, N. Y., & Ostriker, J. P. 1997, ApJ, 486, 581
- (20) Valageas, P., & Silk, J. 1999, A&A, 347, 1
- (21) Gallego, J. 1995, ApJ, 455, L1
- (22) Lilly, S. J., et al. 1996, ApJ, 460, L1
- (23) Connolly, A. J. 1997, ApJ, 486, L11
- (24) Madau, P., Pozzetti, L., & Dickinson, M. 1998, ApJ, 498, 106
- (25) Rowan-Robinson, M. 1999, Ap&SS, 266, 291