New insights on the Draco dwarf spheroidal galaxy from SDSS: a larger radius and no tidal tails
Abstract
We have investigated the spatial extent and structure of the Draco dwarf spheroidal galaxy using deep wide-field multicolor CCD photometry from the Sloan Digital Sky Survey (SDSS). Our study covers an area of 27 square degrees around the center of the Draco dwarf and reaches two magnitudes below the level of Draco’s horizontal branch. The SDSS photometry allows very effective filtering in color-magnitude space. With such filtering the density of the foreground of Galactic field stars is decreased by more than an order of magnitude and the stellar population of the Draco dwarf galaxy thus stands out with much higher contrast than in former investigations. We show that the spatial distribution of Draco’s red giants, red horizontal branch stars and subgiants down to =21.7 mag does not provide evidence for the existence of tidally induced tails or a halo of unbound stars. The projected surface density of the dwarf galaxy is flattened with a nearly constant ellipticity of at position angle . The radial profile can be fit by King models as well as by a generalized exponential. Using the empirical King (1962) profile the core radius and the limiting (or tidal) radius along the major axis are and , respectively; the latter means that the size of the Draco dwarf galaxy is 40% larger than previously measured. Fitting the profile of King’s (1966) theoretical models yields a still larger limiting radius of . There is no clear indication of a tail-like extension of the Draco population beyond this radius. A break in the radial surface density profile which might indicate a halo of extratidal stars is also not found in our Draco data. We conclude that down to the above magnitude limit tidal effects can only exist at a level of of the central surface density of Draco or below. The regular structure of Draco found from the new data argues against it being a portion of an unbound tidal stream and lends support to the assumption of dynamical equilibrium which is the basis for mass estimation. The changes in the values for the core radius and limiting radius imply that the total mass of Draco is higher by more than a factor of two. Using a King (1966) spherical model of equivalent size as a reference and adopting a line-of-sight velocity dispersion of either 10.7 km s-1or 8.5 km s-1(Armandroff et al. 1995), we derive estimates of the total mass within radius of and , respectively. From the combined band flux of all possible Draco members that lie within major axis radius we determine the total luminosity of the Draco dwarf galaxy as . This includes corrections for the flux of the foreground stars and the unseen fainter part of the Draco population. We thus obtain overall mass-to-light ratios of or in solar units. In summary, our results strengthen the case for a strongly dark matter dominated, bound stellar system.
1 Introduction
The Milky Way is surrounded by a number of small faint companion galaxies
that are gravitationally bound to it.
Nine such Milky Way dwarf satellites at galactocentric distances
between 16 kpc and 250 kpc are presently known.
The dwarf spheroidal galaxy in Draco (hereafter called Draco dSph or
simply Draco), located at a distance of about 71 kpc (see § 5.1), is one
of the two least luminous of these companions.
Estimates of the dynamical masses of the Milky Way dwarf satellites
based on their spatial extent and internal velocity dispersion lead
to the conclusion that most of them have high mass-to-light ratios
(30 - 100) and hence must contain large amounts of dark matter (see
Mateo 1998 and references therein).
The parameters of the Draco dSph imply a particularly high mass-to-light
ratio of (Armandroff et al. 1995).
Thus Draco must be completely dominated by dark matter if the
underlying assumption of dynamical equilibrium holds.
However, even with a large fraction of dark matter the total masses
of dwarf spheroidal galaxies like Draco are at most a few
while their spatial extent is several hundred parsecs.
Therefore these systems are susceptible to perturbations by the tidal
forces of the Galactic potential if their orbits are sufficiently
eccentric to bring them to galactocentric distances of about 20 kpc
or closer. As the result of such perturbations, a dwarf galaxy may lose
significant amounts of mass and eventually be disrupted.
This has a number of important implications:
1. Tidal mass loss and disruption of dwarf galaxies can shed light on
the formation of the stellar Galactic halo and its spatial and kinematic
structure (Johnston et al. 1996, Johnston 1998, Helmi & White 1999).
2. The spatial distribution of tidal debris can provide constraints on the
space motions and orbits of the companions (e.g., Odenkirchen et al. 2001).
These would, e.g., be useful for testing the hypothesis that the Milky Way
satellites are grouped in certain streams (e.g., Lynden-Bell & Lynden-Bell
1995). Traces of the orbits of the dwarf galaxies would also provide
constraints on the gravitational potential of the Galactic halo
(e.g., Kuhn 1993, Johnston et al. 1999a).
3. If a dwarf galaxy is tidally perturbed it may be incorrect to estimate
its mass via the assumption of dynamical equilibrium. Kuhn & Miller (1989)
have argued that tidal heating can inflate the velocity dispersion of a dwarf
galaxy and hence lead to overestimated masses and mass-to-light ratios.
Numerical simulations by Klessen & Kroupa (1998) have shown that in the
extreme case of complete disruption the observed properties of local dwarf
galaxies may under certain conditions be explicable without any dark
matter. This point however is controversial (see Olszewski 1998 and
references therein). Piatek & Pryor (1995) found that even when tides
affect the structure and the kinematics of a dwarf spheroidal, they fail
to inflate the central mass-to-light ratio.
An impressive example of tidal interaction is given by the Sagittarius dwarf spheroidal, the closest companion of the Milky Way which is observed while being disrupted in a close encounter with the Galaxy (Ibata et al. 1997). Sagittarius has a very elongated and distorted shape and part of its stellar content is stretched out in a tidal stream along its orbit (Mateo et al. 1998, Majewski et al. 1999, Johnston et al. 1999b, Ibata et al. 2000). This shows that tidal effects can indeed play an important role. It is therefore desirable to find out if the other (more distant) dwarf satellites also reveal signs of tidal mass loss and disruption. Majewski et al. (2000) showed that the giants of the Carina dwarf spheroidal have an extended distribution that reaches beyond the estimated tidal limit and produces a break in the projected radial density profile. Martinez-Delgado et al. (2001) recently reported the detection of a tidal extension for the dwarf spheroidal in Ursa Minor.
From recent studies of Draco there seemed to be evidence that this dwarf
also has an extratidal stellar component. Irwin & Hatzidimitriou (1995;
hereafter IH95) investigated the spatial structure of all known dwarfs
except Sagittarius by means of star counts from digitized photographic
plates.
They found for Draco, as well as for most of the other dwarfs, significant
overdensities of stars outside the limiting radius of their best-fit King
profile.
Smith, Kuhn & Hawley (1997, hereafter SKH97) reported preliminary results
of CCD photometry in a number of fields along the major and minor axis of
the Draco dSph and claimed to see extratidal members out to
angular distance from the center of Draco in eastern direction.
Piatek et al. (2001) investigated Draco by analysing color-magnitude
diagrams of nine CCD fields at different positions and angular distances
from its center. They found evidence for Draco stars in those fields which
overlap with the standard limiting radius of given by IH95 and
reach somewhat beyond this limit.
Furthermore, they argued that there might be weak evidence for Draco stars
also in their more distant fields at about 1.3 degrees from the center of
Draco.
The Sloan Digital Sky Survey (SDSS; see York et al. 2000, Gunn et al. 1998,
Fukugita et al. 1996) has recently enabled us to investigate the Draco dSph
through multi-color CCD photometry in a large contiguous field. Hereby,
the distribution of its stellar content has been mapped more comprehensively
and in more detail. As we show in this paper, the SDSS data do not confirm
the conclusions from previous studies.
The paper is organized as follows:
§ 2 provides details of the SDSS data set and
describes our method for the photometric selection of Draco
members. In § 3 we present surface density maps for two samples
of member candidates and investigate them for signs of tail-like extensions.
In § 4 we discuss fits of ellipsoidal models to the observed distribution
of stars and determine the basic spatial parameters of the galaxy.
§ 5 presents revised estimates of the total mass, luminosity and
mass-to-light ratio. In § 6 we summarize the results and conclusions.
| Parameter | Value | Reference |
|---|---|---|
| (J2000) | , | |
| 71 kpc | Stetson (1979) + Carney et al. (1992) | |
| 293.3 km s-1 | Armandroff et al. (1995) | |
| 10.7 km s-1 | Armandroff et al. (1995) | |
| Fe/H | dex | Lehnert et al. (1992) |
2 Photometric selection of Draco candidates
SDSS is a multipurpose project which is designed to provide homogeneous,
deep CCD imaging in five passbands () with contiguous coverage
of square degrees in the Northern Galactic Cap.
The SDSS data are thus ideally suited for studies of Galactic structure
and local stellar systems (see, e.g., Yanny et al. 2000,
Ivezic et al. 2000, Odenkirchen et al. 2001, Chen et al. 2001)
even though the primary goal of SDSS lies in extragalactic and cosmological
research.
2.1 The data set
The field of Draco was observed in four neighboring great circle scans
made with the SDSS CCD mosaic camera on April 3/4, and April 5/6, 2000
(SDSS runs 1336, 1339, 1356, and 1359).
The observations cover a four degree wide band across the Draco dSph
galaxy and its surroundings and reach down to a limiting magnitude of
. Our study focusses on the declination range of
and on objects recognized as point
sources (based on their images being consistent with the local point
spread function (PSF)).
The so-defined sample of about 290,000 objects has been investigated
using PSF photometry from the standard SDSS data reduction pipeline
(Lupton et al. 2001).
The typical photometric accuracies in the data set (median internal errors)
are better than 0.03 mag in , , and for sources brighter
than 20.0 mag in these filter, and reach the level of 0.1 mag for source
brightnesses of , , , , and
.
The data are preliminary in the sense that the calibration of the
instrumental system onto to the nominal SDSS photometric system is still
in progress. Therefore, we use asterisks to designate the currently used
system of magnitudes (York et al. 2000).
The differences that may occur with respect to a later final calibration
will however be small (not larger than a few percent) and will thus not
affect the results of this study in a significant way.
The IR dust emission maps of Schlegel et al. (1998) show that some of
the regions around the Draco dSph galaxy have non-negligible and spatially
varying extinction. This is potentially dangerous for
our goal of detecting extended structures in the Draco population because
it creates spatially varying shifts in the colors of the stars.
The SDSS data include for each object and each filter an individual
extinction estimate which is derived from the reddening proposed
by the Schlegel et al. (1998) maps.
Depending on the filter and the position of the object, the estimated
extinction within our sample varies between 0.03 and 0.3 mag in
, and , with local peaks of 0.4 in .
To remove reddening effects, the estimated extinction values have been
subtracted from the measured magnitudes prior to any further analysis.
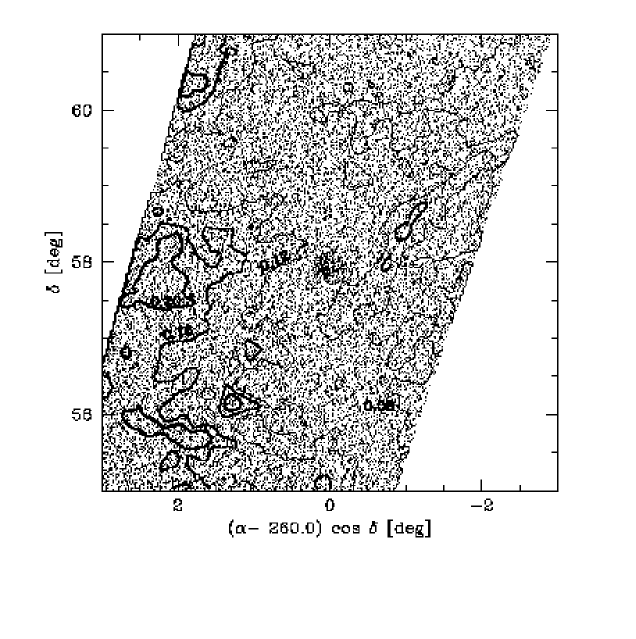
We show the estimated extinction, , in Fig. 1 as a function of
position on the sky. For the main body of Draco, is, on average
0.10 mag, while west of the galaxy and towards the southeast and the east
there are regions where increases above 0.16 mag or 0.2 mag.
The latter corresponds to a shift of about 0.05 mag in the color index
.
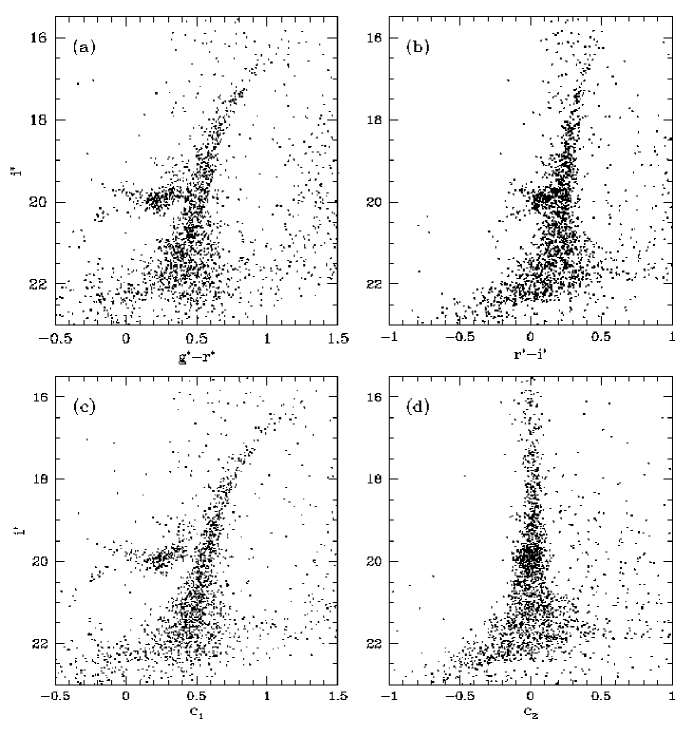
The crucial point in constructing a high-contrast map of a stellar system like Draco is efficient discrimination between the tracers of this system and the foreground field stars. Therefore, specific photometric selection criteria had to be worked out, using the central part of Draco as a training set. In order to determine the photometric characteristics of the Draco population in the SDSS system we analysed the stars in an ellipse of semi-major axis around the nominal center. These stars shown in Fig. 2. The members of the Draco dSph have colors in the range of and (see panels (a) and (b) of Fig. 2). The uncertainties of the , and magnitudes of these stars are approximately equal while the uncertainties of their and magnitudes are at least a factor of two higher. Thus the , , and magnitudes were identified as the most suitable quantities for photometric filtering. The Draco members show a strong correlation between the color indices and which can be expressed in a simple linear relation between these indices. This fact allowed us to facilitate the selection of Draco candidates by an orthogonal transformation from , to new indices , as given in Eq.(1), similar to the indices used by Odenkirchen et al. (2001).
| (1a) | |||||
| (1b) | |||||
Panels (c) and (d) of Fig. 2 present color-magnitude diagrams for the
central part of Draco using these indices.
The plane of shows the familiar pattern of an old stellar
population, i.e. red giant branch, subgiant branch and horizontal branch.
In the plane of the Draco stars simply scatter around .
This scatter is mainly due to photometric errors.
An adequate selection in was thus obtained by deriving the median
error of from the individual error estimates
in , and as a function of source brightness
and by imposing the constraint .
The distributions of the color indices and were found
to be rather diffuse and turned out to be of little use for the selection
of Draco candidates. Thus, for the reason of clarity,
these indices were not included into the selection process.
2.2 The color-magnitude mask
The most important means to discriminate Draco members from field
stars is the combination of source brightness ( in our case) and color
index . Our approach was to design an empirical filter mask in the
color-magnitude plane of with optimal adaptation to the
color-magnitude distributions of the Draco population and the field stars.
Fig. 3 shows the density distribution of Draco stars in the plane
of (Fig. 3a) and the corresponding distribution for
field stars (Fig. 3b).
These distributions were obtained through counts on a
0.01 mag 0.05 mag grid and subsequent weighted averaging within
a radius of five grid points.
To get reliable count rates and a truly representative sample
the distribution was derived from a relatively large area, i.e. an ellipse with semi-major axis (ellipticity 0.3, position
angle ) around the center of Draco.
The non-neglible, but well-defined, contribution from field stars in
this area was subtracted by means of .
The distribution was obtained from stars with
angular distance from the center of Draco. It exhibits two main
concentrations:
The brighter one (max. density at )
consists of slightly evolved thick disk stars and has little photometric
overlap with the Draco population, the fainter one (max. density at
) consists of halo stars at and somewhat below
the turn-off point of the subdwarf main-sequence.
(see Chen et al. 2001).111
A third major field component would be M-dwarfs of the thin and thick disk.
These do not appear in the diagram because they have and hence
are of no concern.
We assume that the Draco population and the field population follow the
distributions and in all parts of the field.
This is presumably true for the field stars, but not necessarily for the
Draco stars if there are population gradients. Nevertheless, one must adopt
homogeneity as a working hypothesis.
In Fig. 3c we show the population contrast as a function of
position in the plane of .
The maxima of delineate those regions in the color-magnitude plane
with the highest fraction of Draco stars. To construct a map of Draco,
both high contrast and large numbers of stars are necessary.
This suggests that a filter mask for the selection of Draco stars should
include all points with , with being a threshold that needs
to be optimized.
Variations in define a one-parameter family of filter masks, which
produce samples of different size and composition.
Supplementary choices had to be made to fix the lower limit of and
the upper limit of , which are not well constrained by the distribution
. For the color index we chose
a cut-off at mag since there are not many Draco stars beyond this
limit according to Fig. 2c.
In we imposed a limit of mag, because the data from
different observing runs have somewhat different limiting magnitudes and
completeness limits that begin to show up by spatial inhomogeneities
beyond mag.
To estimate the optimal threshold, , we computed the signal-to-noise ratio (SNR) for the number of Draco stars from basic Poisson statistics of number counts with background subtraction:
| (2) |
Here, is the total number of stars in the sample defined by and within a given region of Draco, the number of stars in the same sample, but in the region where the foreground field population is probed, and scales the angular extent of these two regions. Since the main goal was to determine the structure of the outer part of the Draco dSph, the SNR was computed and maximized for the annulus between and angular distance from the center of Draco. The maximum SNR was determined by scanning through a dense series of threshold values . In Fig. 3c we show the color-magnitude masks in three typical cases: the mid-level contour corresponds to the mask that yields the highest SNR. The masks that correspond to the low-level and high-level contours of Fig. 3c yield larger and smaller samples, respectively, but both with lower SNR.
3 The spatial distribution of “Draco-like” stars
We now discuss the distribution of Draco candidate stars in the plane of
the sky by means of two special samples.
The first sample (S1) has been obtained with the suboptimal filter given
by the lowest contour of Fig. 3c; the second one (S2) has been selected with
the optimal filter given by the mid-level contour of Fig. 3c.
S1 has twice as many field stars and 1.4 times as many Draco stars as S2.
The filters reduce the surface density of field stars from
2.57 arcmin-2 (unfiltered case) to 0.15 arcmin-2 (S1) and
0.074 arcmin-2 (S2), i.e. by factors of 17 and 35, respectively.
In turn, the contrast between the Draco population and the residual field
star population is strongly enhanced.
Without any filtering the central stellar density contrast
would be 5.7 (see Fig. 1), whereas for S1 and S2 it is 68.7 and 96.9,
respectively. Our samples thus reveal the spatial distribution of
Draco with 15 to 20 times higher contrast than the previous map
of IH95 which has a central density contrast of about 4.
We note that a few small areas (diameter ) in the central part of Draco show a pronounced lack of stars because the source detection and photometry has been hampered by the presence of a very bright foreground star. These regions have either been omitted from the analysis (e.g. in the fitting procedures) or else recovered by interpolation of the stellar density in the surroundings.
3.1 Surface density maps
The spatial distribution of the stars in S1 and S2 is
shown in Fig. 4. Individual stellar positions are plotted as dots.
Overlayed are contour lines of constant surface density. The surface density
has been derived through counts on by grid and subsequent
weighted averaging within a radius of two grid steps in the outer part and
one grid step in the inner part of the field.
The thin lines show contours at the level of 1 above the mean
background density. Here, is the rms of the background density
fluctuations, indicating the lowest level at which Draco stars could become
recognizable. This variance corresponds to surface densities of Draco stars
of 0.035 arcmin-2 for S1, and of 0.022 arcmin-2 for S2,
i.e. of the central surface density of Draco.
Any significant detection of the Draco population requires at least
2 above background, marked by the outermost thick contours in
Fig. 4.
Further contours are drawn at 5 and higher in
order to reveal the shape of the galaxy at different radii.
Both samples show that the overall distribution of Draco stars is
approximately ellipsoidal. With respect to the inner part the outer contours
at appear to be slightly deformed or shifted to the south-west
(see §4). Also, the contour lines for S2 are in general less smooth than
those for S1. Nevertheless, there are no clear deviations from
an elliptic shape down to the 2 contour. This contour reaches
out to angular distance from the center of Draco.
Strong departures from an elliptic shape are visible only at the
1 level. Here, the map for the sample S2 shows more extended
structures than the map for S1. There appear to be weak extensions in four
directions out to radii of about . The ones pointing to the north-east
and south-west are filamentary while those in the south-east and the
north-west are broader and may be described as a bar-like.
Beyond distance from the center of Draco the field is sprinkled
with numerous patches of 1 overdensities. About one third of
them are visible also on the 2 level. These patches are
distributed rather uniformly, and do not form large connected structures.
Altogether they cover an area of no more than 30% of the total field.
This suggests that these patches simply reflect random fluctuations
of the residual field star population.
A closer look at the statistics of the outer fields supports this view.
In Fig. 5 we show histograms and cumulative distributions of the local
S2 field star densities measured in non-overlapping grid cells of
and beyond distance from the
center of Draco. The open circles show Poisson distributions for
the observed mean values.
The measured fluctuations are in close agreement and indeed statistically
consistent with the corresponding Poisson models.
A Kolmogorov-Smirnow test shows that the opposite hypothesis,
namely that the empirical distribution is different from
the Poisson model, has in both cases a probability of not more than 2%.
Thus we conclude that the number of grid cells with surface densities
of e.g. 1 or 2 above the mean does not significantly
exceed the number expected from Poisson noise of a random distribution.
(cf. Fig. 5b). Hence there is no evidence, and indeed little room, for
overdensities that can be ascribed to Draco.
Another way to show that the density enhancements around
Draco in the maps of Fig. 4 are random fluctuations is by comparing the
observations with a random number generated star field of equal mean density.
Fig. 6 shows such a simulated field corresponding to sample S2. The surface
density has been derived using the same pixel grid and smoothing and the
density contours are drawn on the same levels as for S2 in Fig. 4b.
The and contours in the simulated map show structures
that are very similar in size and number to those in the maps drawn from
the observational data.
Density fluctuations of the field star population must of course also occur in the region where the Draco galaxy is seen. The superposition of these fluctuations with the low density of Draco stars in the outermost parts of the galaxy is likely to create distortions in the 1 contour around Draco. This is also nicely revealed by the simulated example of Fig. 6. Since the four weak extensions which are visible in Fig. 4b and which have been described above are not substantially larger than the sizes of the 1 patches in the outer field it is very likely that these extensions are also due to fluctuations in the density of residual field stars. At least, these structures are no significant indication of the presence of Draco stars.
In summary, we find that down to the level of 2 above the
background density of our maps the Draco dSph has a fairly regular
shape, and that there are no detectable traces of tail-like extensions down
to of the central density.
3.2 Mean surface densities along major and minor axis
The stringent non-detection of tidal tail features on our new Draco maps contradicts the previous conclusions of SKH97, who derived mean surface densities in fields of along the principal axes of Draco. For a direct comparison with the SKH97 results, we determined mean surface densities from our data in fields of the same size and position along the same axes (major axis at position angle ). These are plotted in Fig. 7 as a function of position along the major and minor axes with respect to the center of the galaxy. As in SKH97, the mean density in each field is normalized to the mean density in the central field, and an estimate of the foreground density is subtracted. Our estimate of the mean foreground density, however, relies not only on one remote field as in SKH97, but on all stars with more than distance from the center of Draco. The fields at mean angular distance from the center of Draco have scaled densities of about 0.15 with respect to the mean density of the central field, compared to 0.12 reported by SKH97. In contrast to SKH97, we do not observe significant overdensities along the major axis far from the center of Draco in either of our two samples. In the more distant fields, the mean density agrees with the density level of foreground stars within the statistical errors. There is no general difference between the mean densities measured along the major axis and those measured along the minor axis beyond a distance of from the center. However, there are of course statistical fluctuations in the mean densities of the individual fields along both axes. Fig. 7 shows that the reference foreground field for SKH97 (i.e., at north of Draco) is the one with the lowest mean density in our series of fields. We would obtain significant overdensities in most of the other fields if we chose this particular field as a reference. This suggests that the overdensities reported by SKH97 reflect to a large extent an underestimated foreground density. The resolution of this apparent discrepancy shows once more the power of wide area data.
4 Size and structure of the Draco dSph galaxy
To quantify the size, shape and orientation of the Draco dSph we fit two-dimensional models to the observed surface densities. Herein we use the empirical King profile (King 1962, hererafter K62; Eq. 3a), the theoretical King profile (King 1966, hereafter K66), and a generalized exponential (Sersic 1968; Eq. 3b):
| (3a) | |||
| (3b) | |||
In all cases is the elliptical radius and
the coordinate aligned with the major axis.
The profile Eq. 3a has a finite limiting radius which is meant to
describe tidal truncation. It is often used in simple models of globular
clusters.
The theoretical models of K66 have projected density profiles that resemble
those of Eq. 3a, but with a somewhat shallower decline towards the cut-off
radius. These profiles cannot be expressed explicitly and were generated by
numerical integration following the description by Binney & Tremaine
(1987, p.232).
The profile Eq. 3b is of infinite extent and has been found to fit
elliptical galaxies in a wide range of absolute magnitudes
(Young & Currie 1994, Jerjen & Binggeli 1997).
The three types of models were fit to the surface density distributions
of S1 and S2 by weighted least squares. The surface densities were sampled
on a grid of non-overlapping cells. A few cells which fell
on positions that are blended by bright stars were excluded from the fit.
Weights were derived from Poisson noise, with the expected number of stars
given by the fitted model.
The weights were iteratively adjusted to yield a consistent solution.
The best-fit parameters are given in Table 2 and the best fits are
shown in Figs. 8 and 9.
The values of in Table 2
222 denotes the degrees of freedom of the fit and is
. as well as the residuals plotted in
Figs. 8b,8d and the profiles in Fig. 9 demonstrate that the three types
of models all provide good fits.
Moreover, the model parameters obtained from the two different data
samples are consistent within their formal errors.
Hence the results do not depend critically on the particular choice of the
color-magnitude filter.
The best-fit ellipticity is , confirming earlier results of
IH95 and Hodge (1964).
The major axis position angle is (J2000.0), in slight
disagreement with the earlier determination of IH95 (see Table 2).
The most interesting parameters are those describing Draco’s size. Here our results differ substantially from those given by IH95. The fit of the K62 model yields for both samples a core radius that is about 15% smaller and, more importantly, a limiting, or tidal, radius that is about 40% larger than the previous standard value of IH95 (see Table 2). The latter has important consequences: (1) It shows that Draco is more extended and therefore also more massive than previously assumed (see §5). (2) It shows that some of the previous detections of Draco stars beyond the former standard radius of 283 are in fact not extratidal if we define the (actually unknown) tidal radius of the galaxy as usual by the limiting radius of the best-fit King profile.
To demonstrate the clear evidence for a larger spatial extent of Draco in our data, we show in Fig. 9 the observed radial density profiles for S1 and S2. The densities are tabulated in Table 3. The profiles were derived from star counts in elliptical annuli. The logarithm of the mean density above background is plotted versus the logarithm of the rms of the outer and inner radius of each annulus. The radii refer to the major axis. The mean background density was obtained as one of the parameters in the least-squares fitting of the two-dimensional model distributions where it is determined by the surface density data in the outer parts of the field. Error bars at each bin indicate the statistical count rate uncertainty (quadratically combined uncertainties of and ) and show that all bins except the outermost one have significant densities of Draco stars. Note that the counts in these bins trace the profile of the galaxy over three orders of magnitude and thus reflect a ten-fold increase in the dynamic range compared to IH95. Three relevant model curves are overlayed as lines in Figs. 9a and 9b: two King models (dashed lines) and one generalized exponential model (solid lines). Clearly, the K62 model of IH95 (short dashed lines) fails to describe our data, as there are four consecutive radial bins with significantly higher surface density. The new best-fit K62 models (long dashed lines) represent the observed densities (within their statistical uncertainties) down to the outermost bin. There are no hints for the existence of a break in the slope of the radial profile. The models with the K66 surface density profile fit the data with the same overall quality but provide a better approximation to the outermost significant bin () since the decline of the density profile is less steep. Extrapolation with the best-fit K66 profile thus yields a limiting radius of about instead of about from K62. The best-fit generalized exponential model is characterized by a radial scale length of (S1) or (S2) and an exponent . This profile fits the outermost significant bin in the same way as the best-fit K66 models. For sample S2 the fit of the generalized exponential even attains a slightly better overall . This reveals that there is no compelling evidence for a real cut-off in the radial profile of the Draco dSph within the current observational limits. In other words, despite the improved contrast of our density maps a distinct edge of the galaxy is possibly still undetected. Our result of from the best-fit K62 model may thus underestimate Draco’s real radius but it puts at least a firm lower limit on any possibly existing true density cut-off.
| Sample | Model | e | PA | |||||||
|---|---|---|---|---|---|---|---|---|---|---|
| S1 | King62 | 260055 | +57917 | 0.28 | 89∘ | 74 | 396 | - | - | 1.019 |
| 0.01 | 3 | 0.2 | 0.8 | - | - | - | ||||
| S1 | King66 | 260055 | +57917 | 0.28 | 89∘ | 83 | 496 | - | - | 1.018 |
| - | - | - | - | 0.2 | 1.3 | - | - | - | ||
| S1 | Sersic | 260055 | +57916 | 0.28 | 89∘ | - | - | 73 | 1.2 | 1.017 |
| 0.01 | 3 | - | - | 0.1 | 0.1 | - | ||||
| S2 | King62 | 260055 | +57915 | 0.30 | 88∘ | 77 | 401 | - | - | 0.995 |
| 0.02 | 3 | 0.2 | 0.9 | - | - | - | ||||
| S2 | King66 | 260055 | +57915 | 0.30 | 88∘ | 87 | 494 | - | - | 0.994 |
| - | - | - | - | 0.3 | 1.4 | - | - | - | ||
| S2 | Sersic | 260055 | +57915 | 0.30 | 88∘ | - | - | 76 | 1.2 | 0.988 |
| 0.02 | 3 | - | - | 0.1 | 0.1 | - | ||||
| IH95 | King62 | - | - | 0.29 | 82∘ | 90 | 283 | - | - | - |
| - | - | 0.01 | 1 | 0.7 | 2.4 | - | - | - |
Note that the meaning of for K62 and K66 is different and depends on the concentration of the model.
| S1 | S2 | |||||
|---|---|---|---|---|---|---|
| arcmin | arcmin-2 | arcmin-2 | ||||
| 0.0 | 1.0 | 0.71 | 10.250 | 2.137 | 7.181 | 1.795 |
| 1.0 | 2.0 | 1.58 | 8.467 | 1.121 | 5.087 | 0.872 |
| 2.0 | 3.0 | 2.55 | 7.219 | 0.802 | 4.937 | 0.666 |
| 3.0 | 4.0 | 3.54 | 7.448 | 0.689 | 4.937 | 0.563 |
| 4.0 | 5.0 | 4.53 | 7.130 | 0.594 | 4.388 | 0.468 |
| 5.0 | 6.0 | 5.52 | 4.740 | 0.438 | 3.142 | 0.358 |
| 6.0 | 7.0 | 6.52 | 5.142 | 0.420 | 3.452 | 0.345 |
| 7.0 | 8.0 | 7.52 | 3.654 | 0.329 | 2.723 | 0.285 |
| 8.0 | 10.0 | 9.06 | 3.181 | 0.198 | 2.132 | 0.163 |
| 10.0 | 12.0 | 11.05 | 2.380 | 0.155 | 1.642 | 0.129 |
| 12.0 | 14.0 | 13.04 | 1.363 | 0.108 | 0.941 | 0.090 |
| 14.0 | 16.0 | 15.03 | 1.099 | 0.090 | 0.778 | 0.076 |
| 16.0 | 18.0 | 17.03 | 0.629 | 0.064 | 0.442 | 0.054 |
| 18.0 | 22.0 | 20.10 | 0.485 | 0.037 | 0.278 | 0.028 |
| 22.0 | 28.0 | 25.18 | 0.300 | 0.021 | 0.180 | 0.016 |
| 28.0 | 34.0 | 31.14 | 0.193 | 0.015 | 0.110 | 0.012 |
| 34.0 | 40.0 | 37.12 | 0.165 | 0.013 | 0.088 | 0.009 |
| 40.0 | 60.0 | 50.99 | 0.150 | 0.006 | 0.078 | 0.004 |
Notes:
The “background” surface densities are:
arcmin-2 (S1)
arcmin-2 (S2)
The model fits provide a useful reference to identify peculiarities in the shape of the observed distribution of stars. In Figs. 8a and 8c we compare the contours of the observed density distribution with the elliptic contours of the best-fit exponential model. Apart from the filamentary and barlike extensions on the level (see § 3) one recognizes a less extended box-like deformation of the galaxy with respect to the model in the south-western quadrant. This feature shows up in both samples and is present also in the and contours. The residual maps (Figs. 8b and 8d) trace these deformations to two patches of enhanced surface density which are located about south and southwest of the center of Draco. Their significance might indicate real irregularities in the stellar distribution of Draco. In order to quantify the amount of asymmetry we counted the number of stars in two opposite sectors separated by a straight line through the center of the galaxy (bisector method). From the (background-subtracted) numbers in the two sectors one can define an asymmetry parameter as:
| (4) |
For , the uncertainty of is . In the inner part of Draco () both S1 and S2 yield no significant asymmetry (, ) for all position angles of the bisector. For we obtain maximum values of for sample S1 and for sample S2, both with bisector position angles of about . The outer part of Draco thus seems to have an asymmetric stellar distribution at the 10% level ( significance). Note that any tidal deformation is expected to be symmetrical with respect to the center.
5 Mass, luminosity and global mass-to-light ratio
5.1 Estimating the total mass
The new values for the spatial parameters of Draco
lead to a revised estimate of the total mass of the Draco dSph.
We estimate in the usual way by means of the mass of an equivalent
single-component King sphere. Following K66, this mass is given
by:
| (5) |
Herein denotes the normalized mass (see Eq. 38 of K66) which is only a function of the concentration of the system, the linear core radius, the observed line-of-sight velocity dispersion, and a correction factor to link the observed dispersion to King’s parameter . We recall that this way of estimating the mass of a stellar system relies on three basic assumptions: (1) dynamical equilibrium, (2) proportionality of mass and light distribution, and (3) the adequacy of a spherically symmetric and isotropic model in general and a King model in particular.
Our values for and from the best-fit K66 profile imply a
concentration of . The normalized mass
thus is (as opposed to used in IH95).
The core radius of the dynamical model is appropriately chosen as the
geometric mean since this preserves the
projected area of the system when replacing the observed ellipsoidal
system by the spherical model.
To determine the relative change in the mass that is due to changes in
and it suffices to evaluate the product , using
in angular measure. We thus find that increases by a factor of
2.5 when using the revised values of and instead of the former
ones. If the rest of Eq. 5 is to be kept unchanged, former estimates of
could be updated by just multiplying with this factor. However, we
consider it worthwhile to assess also the values of the other parameters
involved in Eq. 5.
The physical value of requires an estimate of Draco’s heliocentric
distance .
Adopting the apparent brightness of the red horizontal branch measured
by Stetson (1979) (, ), the
empirical HB luminosity relation of Carney, Storm & Jones (1992)
() and a mean metal abundance of
(see the compilation by Lehnert et al. 1992)
one obtains and hence kpc.333
The uncertainty of 0.2 mag in the distance modulus accounts for
discrepancies between horizontal branch luminosity relations derived
by different authors and methods.
This yields a linear core radius of pc (geometric mean).
From spectroscopic measurements of 91 Draco members, the most extensive
data set of radial velocities in Draco that is currently available,
Armandroff et al. (1995) derived line-of-sight velocity dispersions of
km s-1(complete sample) and km s-1(by omission
of three extreme velocities). Olszewski et al. (1996) showed that these
results are robust against contamination by orbital motion of binaries.
Most of the stars of this radial velocity sample are located within an
ellipse with semi-major axis of .
By Monte Carlo simulation of a K66 dynamical model with we find
that a correction factor applies if the line-of-sight
velocity dispersion is measured with stars that cover the range
. Inserting all these values into Eq. 5 we obtain
estimates of the total mass of the Draco dSph of
and
depending on which of the two velocity dispersions are used.
As expected, our result of exceeds some
of the previous estimates derived on the basis of the parameters of IH95,
but the increase is less than by the factor of 2.5 mentioned above.
Hargreaves et al. (1996), for example, obtained
with the same method of King model mass estimation, using and
from IH95 and a velocity dispersion very near to the 10.7 km s-1of
Armandroff et al., but with a different choice for .
Mateo (1998) and van den Bergh (2000) give the total mass of Draco as
referring to similar values for the spatial and
kinematic parameters, but without presenting their calculations in detail.
The mass estimate of given in IH95 is
substantially higher than ours and those by other authors.
This seems confusing but can be traced to their adopted dispersion
of 13.2 km s-1, which has been invalidated by the measurements of
Armandroff et al. and Hargreaves et al.
Our revised estimates of Draco’s mass benefit from an improved knowledge
of the spatial as well as of the kinematic parameters and hence are more
precise. Nevertheless, their validity remains limited to the point that
the underlying basic assumptions (see second paragraph of § 5.1)
must hold, at least approximately.
The assumption that “mass follows light” might be wrong in the sense that the dark matter component which is likely to exist and to dominate the matter content of Draco (see §5.2 and §6.2) could have a less concentrated distribution than the luminous matter, as is often found to be the case in stellar systems that contain dark matter. Thus it is interesting to see how the estimate of the total mass changes under such circumstances. In the most extreme case the dark matter component would have a constant density (out to radius ) and the stars would move as test particles in the harmonic potential of this homogeneous dark matter distribution. Here it is convenient to approximate the space density of the stars in the core region of Draco by a Gaussian radial density profile, i.e., , with scale length and for . From the Jeans equation (see Binney & Tremaine 1987, p.204) it follows that a system with Gaussian density profile in a harmonic potential has a velocity distribution with constant dispersion (see als0 Pryor & Kormendy 1990). Setting , the mass of the dark component out to radius and the ratio between this and the King mass of Eq.5 are
| (6) |
| (7) |
Putting the appropriate parameter values into Eq. 7 one finds . This example demonstrates that the mass estimate derived by Eq. 5, assuming that all matter in Draco follows the distribution of the stars, should be regarded as a lower limit because a more shallow distribution of the dark matter component would result in a considerably higher total mass.
5.2 Luminosity and mass-to-light ratio
We determined the total luminosity of the Draco dSph by (1) summing up
the band fluxes of all possible Draco members in the magnitude
interval , (2) subtracting the
expected contribution of flux from foreground stars, and (3)
adding an estimate of the missing flux from Draco stars at .
The flux integral was calculated in the region of the color-magnitude
plane that is outlined by the solid line in Fig. 10, and for
major axis radii varying from to . The foreground contribution
was estimated by an analogous integration in a ring around Draco extending
from to .
The foreground-corrected luminosity function of Draco is shown in Fig. 10b.
After foreground subtraction the integrated magnitude for Draco
converges to at a radius of .
At the integrated magnitude deviates by not more than
mag from this value.
The uncertainty of was estimated by splitting the fields into
four quadrants and calculating the flux integral for each quadrant
separately. The resulting rms was 15 %, implying an uncertainty of
0.08 mag for the determination of from the entire field.
As a further check we mention that an erroneous inclusion or omission of
up to three stars at the bright end of Draco’s giant branch ()
would change by not more than 0.04 mag, which is only half of
the quoted error bar.
The missing flux from faint stars beyond our magnitude cut-off was estimated by analysing deep HST observations of a small field near the center of Draco (Grillmair et al. 1998). We retrieved these observations from the HST archive and reduced them with the software package HSTphot (Dolphin 2000). The resulting photometry covers the magnitude range and has an overlap of 2.8 mag with the SDSS data in the range or . The luminosity function derived from the HST data is shown by the dashed line in Fig. 10b. We integrated the band counts from HST between and and extrapolated the integral to 444Deep HST observations of globular clusters by Piotto et al. (1997) show that the maximum of the luminosity function normally lies at about , i.e. for Draco. assuming a constant slope of the luminosity function. We then scaled the result with the ratio between the number of Draco stars in the (global) SDSS sample and the number in the (local) HST sample, both counted in the overlap interval. This yields an estimate for the missing flux in the SDSS data of 0.59 () mag. Correcting for the faint stars in Draco thus leads to for the total magnitude. By subtraction of the distance modulus (, see § 5.1) translates into a total absolute magnitude of . The uncertainty of the absolute magnitude is dominated by the uncertainty of the distance modulus of 0.2 mag.
For conversion to solar units we used basic photometric data for the Sun given in Landolt-Börnstein (1981) and an empirical transformation relation between standard photometry and SDSS photometry (Grebel et al. 2001):
| (8) |
This relation was derived by comparing SDSS data with
photometry in the photometric standard fields of Stetson (2000).
For the Sun we have and a color index
in the Johnson system, which,
according to the transformation formulae of Fernie (1983),
corresponds to in the Johnson-Cousins system.
Putting this into Eq. 8 one obtains .
Our result for the luminosity of Draco
thus reads .
This is in good agreement with earlier determinations of )
made in a different wavelength range, e.g. by IH95 who give the
luminosity of Draco as .
We emphasize that the determination of the luminosity does not depend on
critical assumptions and models and is in this sense
more general than the determination of the total mass.
Combining the luminosity and the mass estimates of § 5.1
we find total mass-to-light ratios of either
or in solar units. For comparison, the values of
given by Armandroff et al. (1995), were and in solar units
(with respect to the band).
As for the values for the total mass, the mass-to-light ratios are
valid only on the proviso that the assumptions mentioned in § 5.1
hold. Note however, that the true mass of the system would need to be
smaller by a factor of 30 or more in order to achieve a normal mass-to-light
ratio of 1 – 3 in solar units. On the other hand it has been shown that
a distribution of dark matter that is less concentrated than the
distribution of the stars would result in an increase of the total
mass by up to a factor of 45 and thus lead to a further increase of the
mass-to-light ratio.
An additional argument for a high mass-to-light ratio comes from the size limit that is imposed by the galactic tidal forces. This argument is independent from the above direct estimate of Draco’s total mass since it relies only on the observed maximum spatial extent and the luminosity. For a satellite of mass orbiting in a spherically symmetric potential at (constant) galactocentric distance there exists a well-defined theoretical size limit that is given by the Lagrange radius characterizing the force balance between internal gravity, differential centrifugal forces and the galactic tidal field. Taking a logarithmic potential with circular velocity km s-1as a standard model for the gravitational potential in the Galactic halo, the Lagrange radius is given by the relation:
| (9) |
Fig. 11 shows as a function of galactocentric distance for different satellite masses (dashed lines) and different mass-to-light ratios (solid lines), adopting the observed luminosity of Draco. The fact that no signs of tidal perturbation have been detected suggests that at least the currently observed part of Draco’s stellar distribution does not reach beyond the Lagrange radius. Therefore we have the condition . The measured limiting radius is drawn as the hatched bar in Fig. 11. The galactocentric radial velocity of Draco 555Note that the line of sight from the Sun to Draco is close to Draco’s galactocentric radius vector, which is near 100 km s-1, indicates that Draco is not on a circular orbit. Nevertheless, one can use for obtaining an approximate size limit. The appropriate distance at which to take is in this case however not evident; it might be the pericentric distance rather than the current distance . Since cannot be estimated without reliable information on the tangential velocity, one has to consider a wide range of distances . Fig. 11 reveals that for any such choice of a normal mass-to-light ratio of yields Lagrange radii that are substantially smaller than the observed limiting radius for which we here take the conservative value of or 820 pc. Hence a normal value of is ruled out within the context of our assumptions. Possible values of in the sense that holds for distances well below lie near or above . With , i.e. a satellite mass of about as derived by direct mass estimation with Eq. 5, the observed size of Draco remains below the theoretical limit of down to galactocentric distances of 20 to 25 kpc. This means that a mass-to-light ratio of about 100 or higher can prevent tidal stripping of stars from the outermost part of Draco even in relatively close approaches to the Milky Way. It must however be noted that this is a stationary picture. In reality a passage of the Galactic center on an elongated orbit could have the additional effect of heating the stellar population of the satellite due to the non-stationarity of the tidal forces. This kind of influence on the internal kinematics of the satellite system is not accounted for by the simple Lagrange radius criterion.
6 Discussion and conclusions
6.1 The missing extratidal component
From the results of previous studies, in particular those of IH95 and SKH97, one might have expected that a high contrast map of the Draco galaxy down to magnitude 22 would show clear signs of tidal features. Our analysis of the SDSS data shows that this is not the case. Structures which could be interpreted as indicating tail-like extensions appear only on the 1 level of our most sensitive map, i.e., at of the galaxy’s central density. Since these structures go into four different directions their interpretation in terms of tidal tails is problematic. The more bar-like structures seen towards the south-east and the north-west would appear as the preferred candidates for such tails. However, by statistical analysis of the density variations in the surrounding field we find that the observed amount of structure at 1 above background density is easily explicable by normal Poisson noise. Therefore, none of the extensions in the vicinity of the main body of Draco nor any of the overdense patches seen at larger angular distance are likely to be an external part of its stellar population.
On the other hand, the radial profile of the surface density shows that
the ordinary spatial extent of the Draco galaxy is substantially larger
than was revealed by previous measurements with lower contrast. Going down
to about of the central density, the observed radial density
profiles directly reveal that Draco extends to about .
The same is found by fitting ellipsoidal models to the observed surface
density distribution.
A K62 profile yields a best-fit of (S1) and
(S2), which is 1.4 times the previous determination (all radii referring to
the major axis). Using the profile of the K66 theoretical models one obtains
an even larger estimate of .
The observations do however not provide particular support for a
truncated radial profile.
We find that a model with generalized exponential profile and exponent
fits the surface density distribution equally well or even
slightly better.
Thus it is possible that the density profile of the galaxy continues
further outwards and that its true limit lies at densities that are below
the current observational noise level.
In the light of these results, Piatek et al.’s recent evidence for Draco
stars immediately beyond the border of the standard ellipse of semi-major
axis 283 (fields E1, W1, SE1 of Piatek et al. 2001) has to be
understood as a detection of the ordinary Draco population and is not an
indication of an extratidal component.
Piatek et al. claim that there is also weak evidence for Draco stars in
their fields E2 and W2, i.e. at angular distances of about
from the center.
However they say that one may disagree with this view because their data
are such that they can neither prove nor disprove the presence of Draco
stars at these larger radii. Our results indeed suggest that there is
no Draco component at large radii down to surface densities of
of the central density.
In the elliptical annulus with semi-major axis radii between and
we find mean surface densities above background that are
(S1) and (S2) of the central
density and compatible with zero within the statistical error.
IH95 however reported densities above background of the order of
times the central density in the distance range from
to (cf. panel 2 of their Fig. 2).
This result has often been regarded as a major piece of evidence for the
existence of an extratidal Draco component.
With a limiting magnitude of the IH95 study of Draco does
not comprise fainter stars than our SDSS samples. On the other
hand, above the limit of our sample S1 is unlikely to miss a
substantial fraction of the Draco population since the filter mask is
sufficiently wide (see Fig. 3c) to include all relevant parts of the
color-magnitude diagram. Yet, the color-magnitude filter provides us with
the advantage of a much higher contrast. Our counts of specifically
“Draco-like” stars thus prove that surface densities as high as those
reported by IH95, which are ten times higher than in our samples, cannot be
due to Draco members.
An extratidal Draco component with a surface density as given by IH95 is
clearly ruled out.
Instead, we attribute the counts of IH95 beyond to residual foreground
field stars.
The results of the study by SKH97, which also favored an extratidal
Draco component, have turned out to be at least doubtful.
A detailed comparison, for which mean densities were determined in the same
fields as observed by SKH97, revealed that their detection of overdensities
may be due to an accidental underestimation of the density of foreground
stars and thus spurious. We find that the field that was used to set
the foreground reference in SKH97 has an extraordinarily low surface density
of “Draco-like” stars which is not representative of other and more distant
fields. With respect to the mean density of stars at more than
distance from Draco we do not find significant overdensities
in the SKH97 fields.
In total, there remains no convincing evidence for an extratidal Draco
component. This however does not necessarily mean that such a component
is completely absent. For the magnitude range down to , i.e. the giant branch, horizontal branch and subgiant branch, our study
yields upper density limits of times the central
density (from the two-dimensional distributions) and of times
the central density (from the radial profiles). The latter limit
corresponds to a surface brightness of about 33.5 mag arcsec-2.
In a recent numerical study of the dynamical evolution of dwarf galaxies
in a Milky Way halo potential Mayer et al. (2001) found tidal
streams with a maximum surface brightness of 30 mag arcsec-2.
An extratidal Draco component on this level of surface brightness would
have shown up in our data and can therefore be ruled out.
Extratidal extensions with surface brightness below the above given limits
may however exist.
N-body simulations of the tidal disruption of dwarf galaxies
by Oh, Lin & Aarseth (1995) have indeed produced tidal tails with surface
densities between and of the central density of the dwarf.
Thus it may be that despite the significant improvement in surface density
contrast our maps of Draco are not yet sensitive enough to reach the level
at which tidally induced extensions turn up. At magnitudes beyond our
cut-off, nothing is known about signs of tidal perturbation because no
observations are available so far except for the very center of Draco.
Since one does not expect mass segregation to be present in such a
low-density system like Draco tidal effects should in this case not depend
on the brightness of the tracer population. Therefore the above given
limit in relative surface density should hold also for fainter stars.
However, fainter stars, i.e. in the region of the main-sequence turn-off
and below, have the advantage of being much more numerous than those on
the giant and subgiant branch (see the luminosity function Fig. 10b).
On the other hand the number of field stars
with colors in the range of the Draco turn-off will not increase
accordingly, because the contaminating stars in this part of the CMD
will be halo turn-off and main sequence stars at about the same
distance as Draco.
Thus, from the point of number statistics and contrast, Draco stars at and
beyond mag appear to be much better suited for an eventual
detection of an extratidal component. The goal of future wide-field studies
of Draco must therefore be to push the magnitude limit down to below the
main sequence turn-off.
Since there is no evidence for an extratidal component around Draco (down to the above limit of surface density) the question arises why other Milky Way dSph’s such as Sagittarius, Ursa Major and Carina do show tidal effects (see §1) while Draco does not. The clearest evidence of tidal perturbation undoubtedly exists for the Sagittarius dwarf. The case of Sagittarius is however not comparable to any of the other known Milky Way companions since it is much closer to the Galactic center ( kpc for Sagittarius, kpc for other MW dSph’s). Thus for Sagittarius one can directly infer from its current position that it must be subject to strong tidal forces whereas this is not certain for other more distant dwarf spheroidals as long as their orbits are unknown. In other words, it is by no means clear whether Draco or any of the other dSph’s has penetrated as deeply into the Galactic potential during its history as we presently observe it for the Sagittarius. The Ursa Major dSph is comparable to Draco in that its present galactocentric distance ( kpc, Mateo 1998) is similar to that of Draco, that it has a very low luminosity, and that a very high mass-to-light ratio (, Mateo 1998) is obtained via conventional mass estimation based on the central velocity dispersion. On the other hand, the morphology of the Ursa Major dSph is quite different from that of Draco because it is much more flattened (, IH95) and reveals a clumpy internal structure (IH95; Kleyna et al. 1998). These peculiarities suggest that the Ursa Major dSph has undergone much stronger tidal interactions with the Galaxy than Draco. It is then not so surprising that Ursa Major (in contrast to Draco) has a supposedly extratidal halo with a surface density of about of the central surface density as found by Martinez-Delgado et al. (2001). The reason might be that Ursa Major is on a galactic orbit that has smaller pericentric distance than the orbit of Draco. In this case it would however be unlikely that Draco and Ursa Major belong to the same great circle stream as proposed by Lynden-Bell & Lynden-Bell (1995). The key to answering these questions lies in precise measurements of the tangential velocities (see end of § 6.2). The case of the Carina dwarf spheroidal is difficult to understand as long as no information on its orbit is available. With a galactocentric distance of about 100 kpc (Mateo 1998) it is presently much more distant than Draco, so strong tidal perturbations seem a priori less likely. On the other hand, Majewski et al. (2000) have identified an extended distribution of Carina-like giants with a surface density on the level of about times the central surface density and a shallow radial profile which is thought to be rather typical of an extratidal component. The fact that Carina’s total mass as estimated in the usual way from its velocity dispersion and its surface density profile (, Mateo 1998) is a factor of two to three lower than the likewise estimated total mass of Draco is not sufficient to explain the apparently very different amounts of tidal mass loss from these objects. One may wonder whether the remarkably different star formation histories of Carina and Draco perhaps indicates fundamental differences in the evolution of the two galaxies that could have an impact also on the existence of an extratidal component.
6.2 Draco’s structure and basic parameters
Apart from setting a new and stringent upper limit on the surface density
of extratidal stars around Draco, the SDSS data provide us with improved
knowledge of the structure and the basic parameters of Draco’s main body.
We find that its spatial extent and projected shape is essentially that of
an ellipsoid with a core radius of about 160 pc (referring to a decline
to about 26% of the central surface density), an outer radius of at least
820 pc (both along major axis), and a radius-independent ellipticity of
0.29. There is possibly a 10% deviation from this simple symmetric structure
in the outer part.
The simplicity of the spatial structure of the Draco dSph is a very
important fact, as is the lack of evidence for an extratidal component
around it, because both findings lend support to the fundamental assumption
that the system is in dynamical equilibrium or at least close to it.
This is one of the key assumptions generally made in order to estimate the
dynamical masses of systems like the dwarf spheroidals.
The shape of Draco’s radial density profile further suggests that a King
model should indeed be an acceptable approximation of the system.
Under these assumptions and in combination with kinematic data the spatial
characteristics of the system imply that it has a total mass of
2.2 - 3.5. If the distribution of mass in Draco is
less spatially concentrated than is indicated by its luminous matter, the
total mass out to could be by up to a factor of 45 higher.
To check whether the equilibrium hypothesis and the dynamical model is
really adequate one would need detailed information on the velocity profile
of Draco, which is currently not known. A more definitive answer on the
question of the total mass of Draco must therefore still await future
detailed kinematic measurements.
The luminosity of Draco has been determined in a straightforward and
model-independent way by integrating the observed flux on Draco’s
giant branch, horizontal branch, and subgiant branch over the complete
volume of the galaxy.
For the residual luminosity from Draco stars beyond the magnitude limit of
the SDSS sample we also obtained a direct and almost assumption-free estimate
using supplementary Draco data from HST. The resulting total magnitude
of covers the complete range from the brightest
giants at down to the presumed maximum of the luminosity
function at . Thus there remains little room for
significant deficits due to still unaccounted contributions of light.
The total band luminosity is ,
clearly demonstrating that the Draco dSph is substantially less luminous
than the brightest globular clusters in our Galaxy although it is at least
a factor of 10 more spatially extended (in the sense of its linear diameter)
than those clusters.
The low luminosity is in obvious contrast with the estimated total mass of Draco. A total mass of 2.2 - 3.5 yields a global mass-to-light ratio of 92 - 146 with respect to the band, which lies at least 1.5 orders of magnitude above the normal values of the mass-to-light in systems with similar content of luminous matter, namely globular clusters ( 1 - 3 ). In the compilation of Mateo (1998, Table 4) the only other Local Group dwarf galaxy with a similarly high is Ursa Minor, while most other dSphs have estimated ratios . Taken at face value, the above mass-to-light ratio necessarily implies that Draco must be dominated by some sort of dark matter component. Even if our mass estimate were wrong by a factor of 2 - 5, the conclusion that a large fraction of the mass in Draco must come from a dark component is inescapable. A deviation from the assumption that “mass follows light”, in the sense that the dark matter component in Draco could – as in other galaxies – be less concentrated than the visible matter, would further increase the mass-to-light ratio.
Hence there exist essentially two possibilities: (a)
The conventional mass estimates must deviate strongly from the true mass
so that the real mass-to-light ratio is normal. This could be the case
if the system is very far from equilibrium or unbound.
(b) The Draco dwarf must contain a large fraction of its mass as dark
matter, whatever the exact quantity of this component may be.
The fact that the spatial structure of the Draco population does not reveal
any sign of a perturbation of its internal dynamics makes the first
possibility unlikely and points towards the second one.
Using a simple logarithmic halo potential we showed that constraints from the Galactic tidal field strongly support this conclusion. With a normal mass-to-light ratio, which means a total mass of not more than , the observed size of Draco would clearly exceed the Lagrange limit for any reasonable value of the galactocentric distance. Hence the outer part of Draco should be heavily affected by tidal stripping, which is not observed. How much higher the mass-to-light ratio has to be depends on how closely Draco’s orbit approaches the Milky Way. Taking twice the value of the radial velocity as a guess for the unknown tangential velocity yields a hypothetical pericentric distance of 48 kpc. To reach consistency between the measured radius and the Lagrange limit down to this pericentric distance a mass-to-light ratio of is required. Values near would enable Draco to maintain its current size even at pericentric distances of 25 kpc. Whether Draco is likely to come that close to the Galaxy can only be found out with very precise measurements of Draco’s absolute proper motion. The tangential velocity would in this case be about 120 km s-1and the (galactocentric) proper motion about 0.4 mas/a. The future astrometric satellite missions SIM and GAIA are expected to measure this motion with high accuracy so that firm constraints on Draco’s orbit and hence on the theoretical tidal boundary can then be obtained.
This paper has focussed on analysing the properties of the
Draco dwarf spheroidal galaxy as a whole. Apart from this the SDSS data
also enable us to investigate the stellar populations of Draco
(i.e., red giants, AGB stars, subgiants, red and blue horizontal branch
stars, and RR Lyrae variables) individually and to compare their
distribution.
This study is currently under way and will be described in
a future paper (Odenkirchen et al. 2001, in preparation).
The Sloan Digital Sky Survey (SDSS) is a joint project of The University of Chicago, Fermilab, the Institute for Advanced Study, the Japan Participation Group, The Johns Hopkins University, the Max-Planck-Institute for Astronomy (MPIA), the Max-Planck-Institute for Astrophysics (MPA), New Mexico State University, Princeton University, the United States Naval Observatory, and the University of Washington. Apache Point Observatory, site of the SDSS telescopes, is operated by the Astrophysical Research Consortium (ARC). Funding for the project has been provided by the Alfred P. Sloan Foundation, the SDSS member institutions, the National Aeronautics and Space Administration, the National Science Foundation, the U.S. Department of Energy, the Japanese Monbukagakusho, and the Max Planck Society. The SDSS Web site is http://www.sdss.org/.
Part of this work is based on observations with the NASA/ESA Hubble Space Telescope, obtained from the data archive at the Space Telescope Science Institute, which is operated by the Association of Universities for Research in Astronomy, Inc. under NASA contract No. NAS5-26555.
References
- (1) Armandroff, T.E., Olszewski, E.W., Pryor, C., 1995, AJ, 110, 2131
- (2) Azzopardi, M., Lequeux, J., Westerlund, B.E., A&A, 161, 232
- (3) Binney, J., Tremaine, S., 1987, Galactic Dynamics. Princeton University Press, Princeton, New Jersey
- (4) Carney, B.W., Seitzer, P., 1986, AJ, 92, 23
- (5) Carney, B.W., Storm, J., Jones, R.V., 1992, ApJ, 386, 663
- (6) Chen, B., Stoughton, C., Smith, J.A., Uomoto, A., Pier, J.R, et al., 2001, ApJ, 553, 184
- (7) Dolphin, A., 2000, PASP, 112, 1383
- (8) Landolt-Börnstein, Zahlenwerte und Funktionen, Vol. IV/2a, Springer, Heidelberg, 1981, p. 82
- (9) Fernie, J.D., 1983, PASP, 95, 782
- Fukugita et al. (1996) Fukugita, M., Ichikawa, T., Gunn, J.E., Doi, M., Shimasaku, K., & Schneider, D. P., 1996, AJ, 111, 1748
- (11) Grebel, E.K., Harbeck, D., Holtzman, J., Odenkirchen, M., et al., 2001, in preparation
- (12) Grillmair, C.J., Mould, J.R., Holtzman, J.A., et al., 1998, AJ, 115, 144
- Gunn et al. (1998) Gunn, J.E., Carr, M., Rockosi, C.M., et al., 1998, AJ, 116, 3040
- (14) Hargreaves, J.C., Gilmore, G., Irwin, M.J., Carter, D., 1996, MNRAS, 282, 305
- (15) Helmi, A., White, S.D.M., 1999, MNRAS, 307, 495
- (16) Hodge, P.W., 1964, AJ, 67, 853
- (17) Ibata, R., Wyse, R., Gilmore, R., Irwin, M.J., Suntzeff, N.B., 1997, AJ, 113, 634
- (18) Irwin, M., Hatzidimitriou, D., 1995, MNRAS, 277, 1354 (IH95)
- Ivezic et al. (2000) Ivezic, Z., Goldston, J., Finlator, K., et al., 2000, AJ, 120, 963
- (20) Jerjen, H., Binggeli, B., 1997, In: The Nature of Elliptical Galaxies, ASP Conf. Ser., Vol. 116, p. 239
- (21) Johnston, K.V., Hernquist, L., Bolte, M., 1996, ApJ, 465, 278
- (22) Johnston, K.V., 1998, ApJ, 495, 297
- (23) Johnston, K.V., Zhao, H., Spergel, D.N., Hernquist, L., 1999a, ApJ, 512, L109
- (24) Johnston, K.V., Majewski, S.R., Siegel, M.H., Reid, I.N., Kunkel, W.E., 1999b, AJ, 118, 1719
- (25) King, I.R., 1962, AJ, 67, 471
- (26) King, I.R., 1966, AJ, 71, 64
- (27) Kleyna, J.T., Geller, M.J., Kenyon, S.J., Kurtz, M.J., Thorstensen, J.R., 1998, AJ, 115, 2359
- (28) Kuhn, J.R, Miller, R.H., 1989, ApJ, 341, L41
- (29) Kuhn, J.R., 1993, ApJ, 409, L13
- (30) Kuhn J.R., Smith, H.A., Hawley S.L., 1996, ApJ, 469, L39
- (31) Lehnert, M.D., Bell, R.A., Hesser, J.E., Oke, J.B., 1992, ApJ, 395, 466
- (32) Lupton R.H., et al., 2001, in preparation
- (33) Lynden-Bell, D., Lynden-Bell, R.M., 1995, MNRAS, 275, 429
- (34) Martinez-Delgado, D., Alonso-Garcia, J., Aparicio, A., Gomez-Flechoso, M.A., 2001, ApJ, 549, L66
- (35) Mateo, M, 1998, ARA&A, 36, 435
- (36) Mateo, M., Olszewski, E.W., Morrison, H.L., 1998, ApJ, 508, L55
- (37) Mayer, L., Governato, F., Colpi, M., Moore, B., Quinn, T., Wadsley, J., Stadel, J., Lake, G., ApJ, 547, L123
- (38) Odenkirchen, M., Grebel E.K., Rockosi C.M., et al., 2001, ApJ, 548, L165
- (39) Odenkirchen M., Grebel, E.K., Rix, H.-W., et al., 2001, in preparation
- (40) Olszewski, E., 1998, In: Galactic Halos, ASP Conf. Ser., Vol. 136, p. 70
- (41) Piatek, S., Pryor, C., Armandroff, T.E., & Olszweski, E.W., 2001, AJ, 121, 841
- (42) Piotto, G., Cool, A.M., King, I.R., 1997, AJ, 113, 1345
- (43) Pryor, C., Kormendy, J., 1990, AJ, 100, 127
- Schlegel et al. (1998) Schlegel D.J., Finkbeiner D.P., & Davis M., 1998, ApJ, 500, 525
- (45) Sersic, J.L., 1968, Atlas de galaxias australes, Observatorio Astronomico, Cordoba
- (46) Smith H.A., Kuhn J.R., Hawley S.L., 1997, In: Proper Motions and Galactic Astronomy, ASP Conf. Ser., Vol. 127, p. 163 (SKH97)
- (47) Stetson, P.B., 1979, AJ, 84, 1149
- (48) Stetson, P.B., 2000, PASP, 112, 925
- (49) Van den Bergh, S., 2000, The Galaxies of the Local Group, Cambridge University Press, Cambridge, UK
- Yanny et al. (2000) Yanny, B., Newberg, H., Kent, S., et al., 2000, ApJ, 540, 825
- York et al. (2000) York, D.G., Adelman, J., Anderson, J.E., et al., 2000, AJ, 120, 1579
- (52) Young, C.K., Currie, M.J., 1994, MNRAS, 268, L11
- (53) Young, L.M., 1999, AJ, 117, 1758

![[Uncaptioned image]](/html/astro-ph/0108100/assets/x4.png)
Spatial distribution of photometrically selected Draco candidates. Dots represent individual stars, lines are contours of equal stellar surface density. The thin line shows the level of above mean background density, bold lines show levels of , and higher ( = rms background variation). (a): Sample S1, i.e., stars lying within the outermost contour line of Fig. 3c. Contour levels are 0.185, 0.22, 0.31, 0.6, and 1.6 arcmin-2. The mean density of the background is 0.154 arcmin-2. (b): Sample S2, i.e., stars lying within the middle contour of Fig. 2c. Contour levels are 0.097, 0.12, 0.18, 0.3, and 0.8 arcmin-2. The mean density of the background is 0.076 arcmin-2.
![[Uncaptioned image]](/html/astro-ph/0108100/assets/x5.png)
Statistics of the local surface density of field stars in the sample S2. (a) Normalized histograms of density values measured in pixels of (upper solid curve) and (lower solid curve) at angular distances of more than from the center of Draco. For comparison, Poisson distributions for the observed mean values are drawn (dashed lines). (b) Cumulative distributions corresponding to the histograms shown in (a). The fraction of pixels with densities above a given threshold is seen to agree with predictions for Poissonian fluctuations.
![[Uncaptioned image]](/html/astro-ph/0108100/assets/x6.png)
Monte-Carlo simulation of a star field with the same basic parameters as sample S2. The background has constant mean surface density of 0.076 arcmin-2, the Draco galaxy is modelled as an ellisoid with a generalized exponential profile (see §4 and Table 2). The surface density has been sampled and smoothed in exactly the same way as in the case of the observed samples shown in Fig. 4. The contour level are the same as those in panel (b) of Fig. 4.

![[Uncaptioned image]](/html/astro-ph/0108100/assets/x8.png)
Contour plots of the observed distribution of stars of Draco, the corresponding best-fit elliptical model distribution, and the residuals of this fit. (a) Surface density contours for sample S1: Thin solid lines show the observed surface density (the same as in Fig. 4). The three outermost contours are drawn at levels of , and above background, being the rms of the background variations. Thick dot-dashed lines show the contours of the best-fit exponential model (Sersic profile with ) at the same levels. (b) Residuals of the fit shown in panel (a), rescaled to the level of the mean background counts by means of the square root of the local amplitude of the model. Solid lines show positive residuals, dashed lines show negative ones. The contour levels correspond to and . (c): Same as (a), but for sample S2. (d): Same as (b), but for S2. For details on the samples and the models, see text.
![[Uncaptioned image]](/html/astro-ph/0108100/assets/x9.png)
Radial profiles of the surface density of stars in Draco. Data points with errorbars show the profile of the observed distribution (i.e., star counts in elliptical rings around the center of Draco, mean background subtracted). The lines show the profiles of different models, i.e. a K62 model with the parameter values given by IH95 (dotted), the new best-fit King models, K62 (short dashed) and K66 (long-dashed), and the best-fit Sersic model (solid, see also Fig. 7). Panel (a) is for sample S1, panel (b) for sample S2.
![[Uncaptioned image]](/html/astro-ph/0108100/assets/x10.png)
The luminosity function of Draco from SDSS and HST. Panel (a) specifies the region in SDSS color-magnitude space used to construct the bright part of the luminosity function. For comparison the dots show the stars in the core region of Draco, as in Fig. 1c. Panel (b) shows the luminosity function (solid line) that results from counting the SDSS stars in the region outlined in (a) within the tidal radius of Draco. The contribution from field stars has been subtracted. Error bars indicate combined uncertainties. The dashed line in panel (b) shows the luminosity function of fainter Draco stars derived from -band HST observations (see text). The magnitude bins are shifted by 0.4 mag to match the mean offset between and , the counts are rescaled such that the integrated numbers in the overlap interval () coincide.
![[Uncaptioned image]](/html/astro-ph/0108100/assets/x11.png)
Lagrange radius of the Draco dSph in a logarithmic spherical Galactic potential with circular velocity 220 km s-1, plotted as a function of galactocentric distance and for different satellite masses. The solid lines assume the observed luminosity of and mass-to-light ratios of 3, 30, and 100. The shaded region indicates the tidal radius of Draco as determined by the fit of the King (1962) profile (i.e. , corresponding to 820 pc). The current galactocentric distance of Draco is kpc. Its pericentric distance must clearly be smaller, since Draco has a galactocentric radial velocity of km s-1. Assuming, e.g., km s-1for the unknown tangential velocity component, the pericenter would be at kpc.