Far Ultraviolet and H Imaging of Nearby Spirals: The OB Stellar Population in the Diffuse Ionized Gas
Abstract
We have compared H and far ultraviolet (FUV) images of 10 nearby spirals, with the goal of understanding the contribution of field OB stars to the ionization of the diffuse ionized gas (DIG) in spiral galaxies. The FUV images were obtained by the Ultraviolet Imaging Telescope (UIT) and the H images were obtained using various ground-based telescopes. In all of the galaxies, the FHα/FUIT flux ratio is lower in the DIG than in the H II regions. This is likely an indication that the mean spectral type for OB stars in the field is later than that in H II regions. Comparison of the ratio with models of evolving stellar populations shows that the stellar population in the DIG is consistent with either an older single burst population or a steady state model with constant star formation and an initial mass function (IMF) slope steeper than =2.35. The steady state model is probably a more realistic representation of the stellar population outside of H II regions. The steep IMF slope simulates the steep present-day mass function slope expected for field OB stars, and does not necessarily indicate that IMF slope is actually steeper than =2.35. We compared the FHα/FUIT ratio in the DIG of these galaxies with that in M33, in which the field OB stellar population has previously been investigated using Hubble Space Telescope images. If the mean spectral types of stars in H II regions and in the DIG are the same as in M33, and the difference in extinction between DIG and H II regions is constant among galaxies, then the analysis suggests that field stars are important sources of ionization in most galaxies, and may be the dominant source in some galaxies. The FHα/FUIT ratio is correlated with H surface brightness in both DIG and H II regions, although there is a large scatter in faint H II regions, which may be due to undersampling the IMF in regions with a low total mass of stars formed. The FHα/FUIT ratio is often highest in the centers of galaxies and in the spiral arms, which is also where the DIG is brightest. This can be explained if the extinction is greater in these regions, or if the fraction of DIG ionized by leakage is lower in the inter-arm regions.
1 Introduction
The details of the relationship between massive stars and the ISM are crucial to understanding how galaxies evolve. One place where this interaction is critical, and not well understood, is in the diffuse ionized gas (DIG). This is the dominant component of ionized gas in terms of mass, contributing 95% of the ionized gas mass in the Milky Way (Reynolds, 1991), and requiring the equivalent of 30 to 50% of the ionizing photons of OB stars to remain ionized in almost all of the external spirals studied (Walterbos & Braun, 1996). The DIG is clearly an important physical manifestation of energy transfer from stars to gas, yet the mechanisms through which this transfer occurs remain unclear. The large energy requirement, the morphological association of DIG with H II regions (Walterbos & Braun, 1994; Ferguson et al., 1996; Hoopes, Walterbos, & Greenawalt, 1996; Greenawalt, 1998; Greenawalt et al., 1998), and the spectral properties of the DIG (Greenawalt, Walterbos, & Braun, 1997; Wang et al., 1997; Galarza, Walterbos, & Braun, 1999; Haffner, Reynolds, & Tufte, 1999) all very strongly suggest OB stars as the ionization source, although there are indications that other sources, such as old supernova remnants (Slavin, McKee, & Holenbach, 2000) or turbulent mixing layers (Slavin, Shull, & Begelman, 1993) also play a role (Wang et al., 1997). However, problems transporting the ionizing photons from OB stars to the DIG remain unsolved. Specifically, if the ionizing stars are in H II regions, are there enough density-bounded H II regions leaking ionizing photons, as well as paths through the in spiral disks, for these photons to reach the DIG?
An alternative is that field OB stars ionize some of the DIG, reducing the amount of leakage from H II regions required. Field OB stars have been studied in the Milky Way (Torres-Peimbert, Lazcano-Araujo, & Peimbert, 1974), the Magellanic Clouds (Massey et al., 1995b), and M33 (Patel & Wilson, 1995; Hoopes & Walterbos, 2000). There are several possible explanations for the presence of these OB stars outside of H II regions. They may form in H II regions, but then diffuse out of the H II region into the diffuse gas, or they may survive as an H II region is destroyed by supernovae (SNe) from other massive stars. Both of these processes would produce a population in the field that is weighted toward later-type ionizing stars. A late-type (B0-O9) ionizing star has a longer lifetime than an earlier-type star, increasing the probability that it will live long enough to move an appreciable distance from its birthplace, or survive as the H II region is destroyed when the more massive stars explode in SNe. Another possibility is that field OB stars actually form in the field, as suggested by Massey et al. (1995b) for the Magellanic Clouds. Those authors defined their sample of field stars so that it would not include stars which might have traveled out of an H II region. However, they also found that the initial mass function (IMF) for field stars has a steeper slope than in H II regions, making the very early-type OB stars rare. All of these mechanisms, then, lead to a field population dominated by later-type OB stars. These stars must ionize some fraction of the DIG, but since they are predominantly later-types, a large number is needed to explain all of the DIG. The presence of just one O3 star in the field is equivalent to 50 B0 stars.
A direct way to determine the fraction of DIG that is ionized by field OB stars is to look for OB stars in and out of H II regions, determine their spectral types and ionizing luminosities (NLyc), and compare this to the energy required to maintain the observed H luminosity. This was done for H II regions in the LMC, and several were found that may be leaky (Oey & Kennicutt, 1997). Hoopes & Walterbos (2000) studied OB stars in H II regions and DIG in M33, using Hubble Space Telescope (HST) far-ultraviolet (FUV) and optical images. The FUV information is crucial for assigning ionizing luminosities to massive stars, as there is a severe color degeneracy for hot stars at optical wavelengths (Massey, 1985; Massey et al., 1995a). Even in the FUV the color degeneracy is a problem, but when combined with the FUV and optical absolute magnitudes, the problem is reduced to a level where values of NLyc good to the equivalent of about spectral subtype can be obtained.
The current paper builds on the results of Hoopes & Walterbos (2000), so we briefly describe the analysis carried out in that paper. The goal was to determine the ionizing luminosities of stars in H II regions and in the field, in order to compare with ionizing luminosity inferred from the H emission in each environment. Magnitudes were measured from the WFPC2 images in four filters, F170W, F336W, F439W, and F555W, along with the statistical uncertainty and flat fielding uncertainty, for each star. Color magnitude diagrams (CMDs) for each H II region and DIG region were plotted and compared to theoretical CMDs (Schaerer, et al., 1993). The extinction correction required to place the observed main sequence on the theoretical main sequence was then determined, resulting in a mean extinction correction for each region. A conservative estimate of the uncertainty in determining this correction was combined with the previously measured uncertainty in the photometry.
The extinction corrected magnitudes in four bands for all of the stars were compared with the predicted magnitudes for massive stars from the CoStar models (Schaerer & de Koter, 1997), and NLyc from the best matching model was assigned to each star. The uncertainty in NLyc was determined by finding the models with the largest and smallest ionizing luminosities that matched within the 1 uncertainty in the magnitudes (which included statistical, flat-field, and extinction uncertainties). The NLyc values for all stars in a given H II region or DIG region were summed together, and compared with NLyc required by the H emission. In the regions of M33 that were investigated, OB stars outside of H II regions can ionize an appreciable amount of the DIG, , while the OB stars in H II regions account for of the observed H luminosity of the H II regions. The good agreement between the mean predictions and observations for H II regions gives confidence that the DIG result is not affected by systematic uncertainties. Thus, even though estimates of ionizing luminosities for individual stars have substantial uncertainty since spectral classification from photometry alone is not very accurate, the overall result seems robust. The sizable contribution of field OB stars to the ionization of the DIG relaxes somewhat the need for leaky H II regions, and emphasizes the fact that OB stars outside of H II regions have a large impact on the ISM.
In this paper we investigate whether the source of the DIG ionization in M33 is similar to other spirals. In more distant spirals HST cannot resolve individual stars. We have used images acquired by the Ultraviolet Imaging Telescope (UIT) to yield global FUV information, which can then be compared to M33, in which we have both HST and UIT data. The resolution of the UIT images is approximately 2′′ or 80 parsecs at the typical distances of our targets. Thus we can well resolve the FUV field. Comparing the spatial distribution of FUV emission to that of the H II regions (from narrow band H imaging) in our target galaxies will allow for an assessment of the sources of ionization in a manner similar to that done by Hoopes & Walterbos (2000).
2 Data Reduction and Analysis
The sample of galaxies for which we analyzed H and FUV images is described in Table 1. Ten galaxies were included, including M33 which was studied previously (Hoopes & Walterbos, 2000). The sample spans a range of Hubble types, but early-type spirals are under represented. Most of the galaxies are nearby, although NGC 1512 and NGC 1566 are beyond 15 Mpc. A metallicity estimate for each galaxy was taken from Zaritsky et al. (1994), using their value of 12+log(O/H) at a radius of 3 kpc from the nucleus.
Table 2 summarizes the H data for each galaxy. The reduction for M33 was described in Greenawalt (1998) and Hoopes & Walterbos (2000), M81 and M51 were discussed in Greenawalt et al. (1998), and M101, NGC 628, NGC 925, and NGC 2903 were discussed in Greenawalt (1998). Both line and nearby continuum images were obtained, and the continuum image was scaled to the line image by comparing the fluxes of foreground stars, and then subtracted to produce a line-only image. The calibration method for each galaxy is given in Table 2. Most were calibrated using observations of a standard star, but a few were calibrated using the R-band magnitude of the galaxy and the shape of the narrow band filter, and a few were calibrated by comparing the luminosities of specific H II regions to published values. Three galaxies, NGC 3031 (M81), NGC 5194 (M51) and NGC 5457 (M101) were observed through H filters wide enough to include a contribution from Å. In these cases, 20 to 30% of the luminosity my arise from . We have not corrected for this contamination, but it will be addressed in the relevant sections.
Table 3 summarizes the UIT data for the sample. Details of the UIT instrument and data characteristics can be found in Stecher et al. (1997). The UIT instrument was flown on two occasions: the Astro-1 mission aboard the space shuttle Columbia in December, 1990, and the Astro-2 mission aboard the space shuttle Endeavor in March, 1995. The galaxies were observed by the FUV ( 1500Å) camera, through one of two filters: B1 (1520Å, 354Å) and B5 (1615Å, 225Å). The images were originally produced on film, and later digitized on the ground. The images were calibrated by observing standards stars observed previously with the International Ultraviolet Explorer, and are estimated to be accurate to 15% (Stecher et al., 1997). Nonlinearity at low flux levels introduces further uncertainty. The effects of nonlinearity have been found to be as high as 20%, and the effects vary significantly between exposures (Bell & Kennicutt, 2001). We adopt 15% uncertainty for H II region UIT flux, and 25% (15% + 20% in quadrature) for the fainter DIG UIT flux. The UIT images have an angular resolution of about 2′′.
For each galaxy the DIG was isolated in the H image using the masking procedure described in Hoopes, Walterbos, & Greenawalt (1996). The H image was smoothed with a median filter using a linear length scale of 1 kpc. The smoothed version was subtracted from the original, leaving an image of the small scale structure only, the smoothly varying component having been subtracted away. On this image a mask was created by replacing pixels with values less than 50 pc cm-6 in emission measure with one, and pixels with values greater than 50 pc cm-6 with zero. The resulting mask thus has a value of zero in the bright, small scale structures (i.e. H II regions), and one everywhere else. The original (unsmoothed) H image was then multiplied by the mask image, leaving an image of only the DIG, with zeros over the H II regions. This is called the DIG H image. A DIG FUV image was also created by multiplying the FUV image with the same mask (the mask defined on the H image). An H II region mask was created by inverting the DIG mask, and this was multiplied with the H and FUV images, producing an H II region H image and an H II region FUV image.
Using the H II region H image, circular apertures were defined by eye for as many H II regions as possible. The fluxes of these regions were then measured on the original (unmasked) H and FUV images. The H II region image is used only to find the H II regions with no confusion from the DIG. A local background was defined for each H II region as the mode of the pixel values in an annulus around the aperture. This background was subtracted from each pixel in the aperture.
The DIG fluxes were measured in square 500500 pc apertures which covered the galaxy. The fluxes were measured on the DIG images with the H II regions masked out. A lower cutoff equal to the 1- noise level in the H image was applied to the resulting images, in order to remove apertures which did not include any DIG. For each galaxy there were a small number of apertures that contained H flux but no FUV flux (both DIG and H II regions after background subtraction). These were not included in the final analysis. These procedures follow exactly those used to analyze M33 in Hoopes & Walterbos (2000).
3 Results
3.1 The H/FUV Ratio
In Table 4 we list the observed H and FUV properties of the sample galaxies. The global FHα/FUIT DIG and H II region ratios were measured using the masked images. The diffuse fraction is the ratio of the DIG H luminosity (measured on the masked DIG image) to the total H luminosity of the galaxy. The FUV diffuse fraction is the fraction of the total FUV luminosity that arises in the DIG. The uncertainty in LHα and in the H diffuse fraction was found by varying the continuum scale factor by 3%. The uncertainty in the flux ratios is the combination of the uncertainty in LHα and the uncertainty in LUIT, which is the 15% calibration uncertainty in HII regions, and 25% (15% calibration and 20% nonlinearity) in DIG (Stecher et al., 1997; Bell & Kennicutt, 2001). For the ratio of total luminosities we conservatively use the 25% uncertainty for LUIT. In all cases except NGC 1512, the H diffuse fraction is roughly between 30 and 50%. The H/FUV ratios are higher in the DIG than in H II regions. This can also be seen in the FUV diffuse fraction, which is much higher than the H diffuse fraction for all of the galaxies. In the FUV, a greater fraction of light is found in the field than in H, due to the fact that the FUV band includes light from later-type B and A stars. In NGC 1512, 39% of the H flux is emitted by the nuclear star-forming ring. If this region is excluded, the H diffuse fraction rises to about 20%.
Figure 1 shows the histograms of the FHα/FUIT flux ratio for the galaxies observed in the B1 filter, and Figure 2 shows the galaxies observed through the B5 filter. The histograms show the observed values; no correction for extinction has been made at this point. M33 is shown twice because it was observed through both the B1 and B5 filters. The three galaxies with contamination are not noticeably different, but the correction to the ratio would be only about 0.1 in the logarithmic plots.
In all of the galaxies in the sample, H II regions have a higher FHα/FUIT ratio than DIG regions. Hoopes & Walterbos (2000) interpreted this trend seen in M33 as a hotter stellar population in the H II regions, and confirmed the interpretation through HST WFPC2 imaging of individual OB stars in H II regions and DIG. The H emission results from ionizing photons, so the FHα/FUIT ratio is really a ratio of ionizing/non-ionizing UV photons. The spectra of hotter stars will have a higher ratio of ionizing to non-ionizing photons (i.e. a bluer spectrum) than that of cooler stars. The difference suggests that the population of ionizing stars in the field is dominated by cooler, later-type OB stars, in qualitative agreement with the mechanisms for forming field stars discussed in section 1.
3.2 Comparison with Starburst99 Models
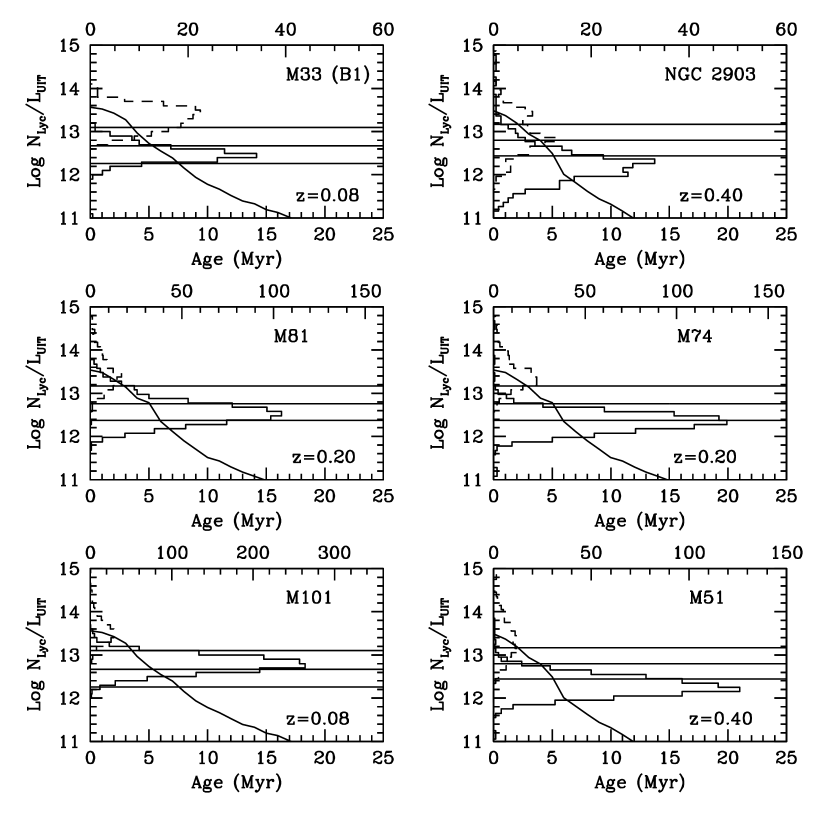
In this section we compare the FHα/FUIT ratios to models of evolving stellar populations, to see whether the observed ratios can be reproduced by a reasonable population of stars. Figures 3 and 4 show the same histograms as Figures 1 and 2, but now they are shown sideways for comparison with the models. We have also converted the H luminosity to the number of ionizing photons , assuming case B recombination (Osterbrock, 1989) and neglecting absorption of ionizing photons by dust. The histograms now include a rough extinction correction, which depends upon the models also shown in the figures. First we will describe the models, and then we will describe the correction for extinction.
The Starburst99 stellar population evolution model (Leitherer et al., 1999) was used to simulate the conditions in H II regions and in the field. This model simulates the evolution of a star cluster through time, and allows one to change parameters, such as the initial mass function (IMF), metallicity, and star formation rate. We ran two types of models. One set has a single burst of star formation, which represent an H II region. The other is a steady state model with constant star formation, which roughly approximates the conditions in the field, in which a relatively small population of young stars is superimposed on a much larger population of old stars.
The burst models begin with a high ratio, as the cluster is dominated by hot young stars with large ionizing luminosities. As the cluster ages and the most massive stars evolve and die, drops, while stays relatively constant since it contains emission from later-type B stars as well as O stars, so the ratio falls. Thus the ratio is a good indicator of the age of a burst population (Hill et al., 1995, 1998; Stewart et al., 2000). The steady state models reach an equilibrium value.
The metallicity of each type of model was varied to include LMC like abundances(z=0.08), solar (z=0.20) and twice solar (z=0.40). The metallicity chosen for each galaxy was based on the measurements of Zaritsky et al. (1994) in Table 1. We also varied the IMF slope to include =2.35, 3.00. and 3.50. The purpose was to simulate a steeper mass function slope, which might arise from the processes which that produce field OB stars (see section 1). The steeper mass function results in a lower ratio, as the most massive O stars become rare compared to the number of less massive OBA stars. For H II regions we show only the standard =2.35 IMF models, as there has been no indication of variation of the IMF in H II regions (Massey, 1998).
In order to make a rough estimate of the extinction in each galaxy, we assume that the single burst models are appropriate for the brightest H II regions in each galaxy (e.g. von Hippel & Bothun 1990). The brightest regions probably have the largest number of O stars, and thus the IMF is more likely to be well sampled. Under-sampling the IMF can have a large effect on the ratio, and this is likely to happen if the number of O stars is low. An extreme case is a single O3 star and no other UV emitting stars, resulting in a very high ratio. This is why we do not use the H II regions with the highest observed to define the extinction correction, as one might be tempted to do since the models predict that these should be the youngest H II regions.
For each galaxy we found the average of log for the ten brightest H II regions (only 3 for M33, which lacks very bright H II regions). The average value was compared to the prediction of the single burst model (for the metallicity of that galaxy) at 1 Myr. We chose this age based on the assumption that part of the reason these H II regions are bright is that they are young, since the models in Figures 3 and 4 show that after a few Myr the ionizing luminosity of a star cluster drops drastically as the most massive stars die. The difference between the mean log and the model value is the extinction correction for that galaxy. The histograms in Figures 3 and 4 have been corrected by that amount. Table 5 lists the shifts used for each galaxy, and the corresponding E(B-V) for two extinction laws. Since the magnitude of the correction was measured, the particular extinction law does not matter, but the values are shown for reference. Published values of E(B-V) for these galaxies are also listed in Table 5.
Correcting for extinction moves the histograms down in the plots, because the correction for is larger than that for (measured through H). We do not specifically correct the ionizing photon flux for absorption by dust, however making the H II regions equal to the model predictions should also correct for this. McKee & Williams (1997) find that about 25% of the ionizing photons emitted by stars in H II regions are absorbed by dust. The effect of absorption by dust on the observed histograms is to move them down, by making the lower, so the correction for this works in the opposite sense of correcting the H and FUV light for extinction. This may be part of the reason that the extinction values in Table 5 are lower than the previously determined values for those galaxies.
This is an average correction for all H II regions (and DIG). Part of the scatter in the histogram is probably due to differences in extinction from region to region, but we have no way to correct for this. A large assumption in this process is that the extinction in the DIG is the same as that for H II regions. In reality it is likely that the extinction is somewhat different due to several processes, an example being the destruction of large grains due to shocks in H II regions (Jones, Tielens & Hollenbach, 1996). In both M31 (Greenawalt, Walterbos, & Braun, 1997) and M33 (Hoopes & Walterbos, 2000) the difference has been small, about AV=0.3. This much difference would move the DIG histograms in Figures 3 and 4 up by 0.22 using the Milky Way extinction law, and 0.32 using the LMC extinction law. It is also possible that the fraction of absorbed by dust is different in the DIG. We will discuss the effects of a difference in extinction where it is relevant.
The extinction corrections for NGC 1313, NGC 1512, NGC 1566, and NGC 925, are particularly low. These are also the four galaxies (besides M33) that were observed through the B5 filter. The extinction correction derived for the two M33 observations are remarkably consistent, so there does not seem to be a problem with the B5 filter. There may be a calibration problem with the FUV images of these galaxies, or there may be a real difference between these and the other galaxies, such as a higher fraction of absorbed by dust. In any case, the results for these galaxies should be treated with caution.
After the extinction correction, most of the galaxies look very similar to M33. The DIG ratios are consistent with a steady state model, or with a single burst model older than that for H II regions. The steady state model seems like a more realistic model for the field stellar population than an older burst, as the steady state model represents a disk built up through star formation over several Gyr, with a much smaller population of young stars. The DIG histograms exhibit even better agreement with the steady state models with somewhat steeper IMF slopes, which was also seen in M33. As already stated, the steep IMF slopes in the models simulate a steep present-day mass function slope, which may be a result of the way H II region stars become field stars, and not necessarily an indication of how field stars actually form.
3.3 Analysis of the Observed Ratios
The comparison with the Starburst99 models supports the general conclusion that the field OB star populations in these galaxies are similar to that in M33, and that they are likely to ionize a similar fraction of the DIG. However, the differences that do exist between these galaxies may indicate real differences in the amount of leakage or field star ionization present. A comparison of the mean FHα/FUIT ratios may elucidate some of these differences or lack thereof. Instead of comparing to models, we will compare the observed FHα/FUIT ratios to those seen in M33, where we have independent information on the fraction of DIG ionized by field OB stars. In this section we use only the observed values, without the extinction correction described in the last section.
The analysis is complicated by the important effects of extinction at ultraviolet wavelengths, and the possible differences in stellar populations in the field and in H II regions due to varying star formation histories, metallicity, or IMF slopes. To mitigate these complicating factors, we will begin the analysis by making some simplifying assumptions. First we will assume that the H II region stellar population is the same among galaxies. This means that the mean intrinsic FHα/FUIT ratio in H II regions for all of the galaxies will be the same. The variation seen in the observed ratio (Table 5) is within the range that can be explained by differences in the amount of extinction, so we have no evidence that this assumption is false. Second, we assume that the relative extinction in H II regions and DIG is the same for all galaxies. By relative, we mean that there may be more or less extinction in DIG compared to H II regions, but the difference between H II region and DIG extinction will be constant for all galaxies. For M31 and M33, the only two galaxies where this has been measured, this assumption appears to be true (Greenawalt, Walterbos, & Braun, 1997; Hoopes & Walterbos, 2000).
With these assumptions we can then use the measured H II region ratio to anchor the DIG ratio, independent of extinction. The difference between the H II region ratio and the DIG ratio can then be compared among galaxies. This approach does not suffer from the effects of any errors that might have been made in the extinction correction made using the starburst models. Table 6 lists for each galaxy the differences in the logarithm of the mean observed FHα/FUIT ratios for H II and DIG. If the assumptions we have made are true, then the difference in this value for different galaxies is completely due to a difference in the FHα/FUIT ratio in the DIG, since we have assumed that the H II ratio is constant, and the H II/DIG relative comparison removes the effects of extinction.
The interpretation of these values is still complicated. Since the H II regions are ionized by local stars with no leakage of ionizing photons into the system, the simplest interpretation is to consider them as the zero-leakage reference point for the DIG. In this case differences between the H II region and DIG ratios would be interpreted as being due to leakage, with larger differences indicating more leakage. However, all of the DIG FHα/FUIT ratios are smaller than the H II region ratios. The largest differences arise from the smallest DIG ratios, so taking this scenario to the extreme means that a ratio of zero (i.e. no H emission) corresponds to maximum leakage. The key point is that leakage should always increase the FHα/FUIT ratio in the DIG by adding H flux but no FUV flux. Since the DIG ratios are always lower than the H II region ratios, leakage cannot be the only factor affecting the ratios.
The other factor is the stellar population in the field, which is different from that in H II regions. Hoopes & Walterbos (2000) found that the mean spectral type of stars in the field is later than that in H II regions, a conclusion also found for the LMC, SMC, and Milky Way (Massey et al., 1995b). Later type stars have lower ratios of LLyc/FUV luminosity (i.e. more FUV luminosity relative to their ionizing luminosity). This results in lower FHα/FUIT ratio for DIG than H II regions in the absence of leakage. Because of this fact, H II regions do not represent the zero-leakage reference point for DIG.
However, we can use the M33 ratio as a reference point for the DIG in other galaxies, since we know that field OB stars ionize % of the DIG in that galaxy (Hoopes & Walterbos, 2000). Table 6 shows the difference in the FHα/FUIT ratio relative to M33. Here we make another assumption: the mean spectral type of the field stars, while different from that in H II regions, is the same in all of the galaxies. Then the difference in the ratio can be understood as being due solely to a difference in the fraction of DIG ionized by leakage. The FHα/FUIT ratio for the DIG that is ionized only by field stars remains the same, independent of the number of field stars, since the mean spectral type is constant. Then any change in the DIG FHα/FUIT ratio is caused by the addition or subtraction of H flux from DIG ionized by leakage.
We illustrate this scenario using M51 as an example. The observed difference in the mean log FHα/FUIT ratio for DIG and H II regions for M51 is 1.09, while for M33 it is 0.81. Since this is a difference of logarithms it is actually a ratio, and if the intrinsic H II region FHα/FUIT ratios are the same for both galaxies, this difference means that the M51 FHα/FUIT ratio for DIG is 0.52 that in M33. We assume that this difference is totally due to a change in the fraction of DIG ionized by leakage. In M33, 40% of the DIG is ionized by field stars, so 60% of the observed H in the DIG come from leakage. The H flux from leakage in M51 has to be reduced to get the lower observed FHα/FUIT ratio, resulting in a fraction of DIG ionized by leakage of 23%, and 77% ionized by field OB stars. The fraction of DIG ionized by field stars for each galaxy based on these assumptions is shown in Table 6.
In this scenario, field OB stars dominate the ionization of the DIG in M51 and NGC 628, NGC 1313 and NGC 1512 have smaller contributions from field stars, and the other galaxies are similar to M33. The large H luminosities of M51 and NGC 628 indicate that they have both undergone recent galaxy-wide star formation events. If this is connected with the dominance of the field OB stars, it suggests that these events somehow enhance the creation of field OB stars, but do not affect the amount of DIG ionized by leakage. This is highly speculative however, since other galaxies in the sample have had recent star formation, but do not appear to exhibit this effect. The H filter used for M51 contains a contribution from , and the /H ratio is higher in the DIG, which may affect the observed difference. However, correcting for this would make the FHα/FUIT ratio lower in the DIG compared to H II regions, and make the difference between H II regions and DIG even larger, raising the predicted contribution of field OB stars even higher.
If the assumption that the field star populations are similar in spectral type in all galaxies is in error, the analysis becomes more complicated. In this case the FHα/FUIT ratio for DIG ionized by field stars will be different, higher in galaxies where the mean spectral type is earlier, and lower if the mean spectral type is later. Put another way, if the mean spectral type is earlier, then a field star population with a given amount of FUV luminosity can ionize more DIG (resulting in higher H luminosity) than in a galaxy with a later mean spectral type in the field. The FHα/FUIT ratio for DIG ionized by such a population of field OB stars would be closer to that in H II regions. In M51, for example, the large difference between the H II regions and DIG ratios suggests the DIG ratio is low, which in this scenario would imply a field OB star population with a later mean spectral type than in M33. Disentangling this effect from a change in the amount of leakage is not possible with these data, as the two have the same effects on the FHα/FUIT ratio.
3.4 Radial and Surface Brightness Variations
For the following analysis we selected four galaxies in order to make the figures easier to read. Figure 5 shows the FHα/FUIT as a function of H surface brightness for H II regions and DIG for four of the galaxies with the best FUV images: M33 (B1), M51, M81, and M101. The ratio is correlated with surface brightness in both environments. In the H II regions, a high FHα/FUIT can arise from either a hotter (i.e. younger) stellar population, or higher extinction. Although there is a trend for the FHα/FUIT to increase with H surface brightness, the brightest H II regions do not have the highest FHα/FUIT ratios (this is most apparent in M101 or M81, for example). In fact the scatter in the ratio tends to increase as the H intensity decreases from the brightest to moderately bright regions, so that the regions with the highest FHα/FUIT are only moderately bright regions, while the brightest regions have a more moderate ratio (although less so for M33). This scatter is larger than the uncertainty in the ratio, which even at a very conservative 30% in the low luminosity regions is only about 0.1 in the logarithmic plot. These high ratios may be caused by undersampling of the IMF in regions with low total mass of stars formed (e.g. Oey & Clarke 1998). If the undersampling causes the mass function to be top-heavy (more very massive early O stars and few or no less massive late O and B stars) a high FHα/FUIT ratio will result. Our choice to use the brightest H II regions to define the extinction correction for the histograms in Figures 3 and 4 rather than those with the highest FHα/FUIT ratio was designed to avoid these stochastic effects.
Figure 6 shows the FHα/FUIT ratio as a function of projected distance from the center of the galaxy. The higher ratios in the H II regions are clearly seen again, and several of the galaxies show higher ratios in the DIG toward the center of the galaxy, although it is not apparent in M101. In the total sample about half of the galaxies exhibit this trend. Possibly related to this effect is the fact that the DIG near the centers of spirals is usually brighter than DIG further out (Greenawalt 1998). The radial trend could be an effect of extinction. Higher extinction in the centers of galaxies would produce higher FHα/FUIT ratios.
Figure 7 shows the FHα/FUIT ratio in DIG regions as a function of projected distance from the nearest H II region. In general, it appears that at larger distances from H II regions, the DIG regions have lower FHα/FUIT, while near H II regions, the DIG regions can have low or high ratios (i.e. , the high ratio DIG regions are missing far from H II regions). A higher FHα/FUIT in the DIG can either mean that the field OB star population there is dominated by earlier-type stars, or it may indicate a larger fraction of leakage of ionizing photons into the region. Both scenarios seem possible near H II regions, and we cannot distinguish between the two with these data. We explore this further in Figure 8, which shows the FHα/FUIT for inter-arm and spiral arm DIG regions in M51. The inter-arm DIG regions generally have lower ratios than spiral arm DIG (with much overlap), but this may just be part of a continuous trend with H surface brightness. The faintest DIG regions are the inter-arm regions, but whether this is a result of the fewer ionizing photons or less gas to ionize is not clear.
One scenario that could plausibly explain the low FHα/FUIT ratios in the inter-arm DIG is that a lower fraction of the DIG is ionized by leakage in the inter-arm region. In a DIG region, the field OB stars emit FUV flux and ionizing photons, but there is an extra flux of ionizing photons from outside of the region (leaking into the DIG from an H II region). Reducing this extra component of NLyc would result in a lower FHα/FUIT ratio. If this is the case in the inter-arm regions, one would expect fainter DIG due to fewer available ionizing photons. One would also expect the field OB stars to also be more sparse in the inter-arm region, further reducing the DIG luminosity.
4 Discussion and Conclusions
We have compared the FUV and H images of 10 nearby spirals in order to investigate the field star populations and their contribution to the ionization of the DIG. We find that the FHα/FUIT ratio is lower in the DIG than in H II regions, an indication that the field OB stars are predominantly later-types. When roughly corrected for extinction and compared to models of evolving stellar populations, we find that the DIG FHα/FUIT most closely resemble a steady-state model, or a burst model at an older age than H II regions. Comparing the difference between the H II region and DIG ratios with that in M33, we find that field OB stars are important contributors to the DIG ionization in most of the galaxies, and in some galaxies they may be the dominant ionization source.
The similarity of the FHα/FUIT in the DIG of the sample of spirals studied here to that of M33 suggests that field OB stars in these galaxies are responsible for a similar fraction of the ionization of the DIG as in M33. Evidence for some variation in this amount is seen, with field stars perhaps dominating the emission in M51 and NGC 628, but contributing relatively little in NGC 1512 and NGC 1313 (but still 15% or more). Most of the galaxies are similar to M33, however, with field OB star contributions around 40%. The variation seen depends on many assumptions, and could be affected by varying extinction, or it could be a result of differences in the mean spectral type of the field star population. As a result, the precise contributions found for each galaxy may not be reliable, and the strongest result is that field OB stars appear to be an important ionization source in all of the galaxies. If the contribution is in fact around 40% for all spirals, this reduces by almost half the amount of leakage required from H II regions to power the DIG. There are indications that other sources such as shock ionization or turbulent mixing layers (Slavin, Shull, & Begelman, 1993) contribute as much as 20% of the ionization of the DIG in some galaxies (Greenawalt, Walterbos, & Braun, 1997; Wang et al., 1997), further reducing the amount of leakage from H II regions required. In fact, Slavin, McKee, & Holenbach (2000) calculate that cooling supernova remnants may account for 50% of the ionization of the DIG in the Milky Way. The combination of these mechanisms may almost eliminate the need for density-bounded H II regions.
Elmegreen (1997, 1998) presented a fractal model of the ISM, in which ionizing photons can travel at least twice as far as the Strömgren radius. Leakage of ionizing photons from H II regions is thus expected in this model, and it should have a large effect on the gas near H II regions. It is interesting that we see some indications that the fraction of DIG ionized by leakage may be lower far from H II regions. It seems natural to expect that the DIG near H II regions and in spiral arms is ionized by leakage, and the ionization of the DIG in the inter-arm region has a more important contribution from field OB stars. This scenario can be tested through spectroscopy of the DIG, particularly with the 5876Å and 5007+4959Å lines. These lines both require high energy photons emitted only by the earliest O stars, so they should be strongest in DIG ionized by leakage, since early O stars in H II regions would contribute to the ionizing spectrum. In the field, very early O stars are rare (Massey et al., 1995b; Hoopes & Walterbos, 2000), so these line should be weak. We plan to carry out this test in the near future.
The fact that field OB star ionization is viable in this sample of 10 spirals suggests that it may be a common feature of spirals. OB stars outside of H II regions appear to be fairly important in the energy balance of the ISM in spirals then, as the results suggest that at least 15% of the ionizing photons emitted by OB stars are not emitted in H II regions. This fraction may be higher if other sources contribute to the ionization of the DIG. Since they are in the diffuse ISM, the influence of these stars may extend much further than their counterparts in dense H II regions. By ionizing and heating the intercloud medium, they may prevent it from condensing, tempering the formation of molecular clouds, and thus star formation.
There is clearly a difference between the OB stellar population in the field and that in H II regions. The fact that the FHα/FUIT ratios are lower in the DIG in spite of the addition of ionizing photons through leakage from H II regions indicates that later type OB stars dominate in the field. This has bearing on the origin of this population. Since later-type OB stars have longer lives than earlier-types, they are more likely to live long enough to diffuse out of an H II region, or to survive when an H II region is destroyed by SNe from the more massive stars. In this case the mass function of field OB stars would be truncated at the stellar mass whose lifetime corresponds to the time it takes OB stars to become field stars. This time may not be the same for every star formation event, and since the field OB population is probably a mixture if stars from several star formation events, the composite IMF would appear steeper than that for H II regions. Thus while the mass function of the field OB population would be steeper than H II region stars, the initial mass function would not. However, if these stars formed in the field, then the paucity of early-type OB stars suggests that the initial mass function is steeper in the field, and that the process of star formation is fundamentally different in the field environment. In Hoopes & Walterbos (2000) and this paper, no distinction could be made between field stars that may have drifted out of H II regions and those that could only have formed in the field. The former category certainly exists, but whether it makes up all or only part of the field OB population is not clear. For LMC field OB stars, Massey et al. (1995b) carefully corrected for stars that were close enough to an H II region to have drifted out, and the mass function was still found to be steeper than in H II regions. Whether these stars may have originated in H II regions that no longer exist is not clear, but is very important in the interpretation of the mass function slope.
References
- Bell & Kennicutt (2001) Bell, E. F. & Kennicutt, R. C. 2001, ApJ, 548, 681
- Bresolin, Kennicutt, & Stetson (1996) Bresolin, F., Kennicutt, R. C., & Stetson, P. B. 1996, AJ, 112, 1009
- Buta (1988) Buta, R. 1988, ApJS, 66, 233
- Cardelli, Clayton, & Mathis (1989) Cardelli, J. A., Clayton, G. C., & Mathis, J. S. 1989, ApJ, 345, 245
- Cornett et al. (1994) Cornett, R. H. et al. 1994, ApJ, 426, 553
- Elmegreen (1997) Elmegreen, B. G. 1997, ApJ, 477, 196
- Elmegreen (1998) Elmegreen, B. G. 1998, PASA, 15, 74
- Ferguson et al. (1996) Ferguson, A. M. N., Wyse, R. F. G., Gallagher, J. S., Hunter, D. A. 1996, AJ, 111, 2265
- Galarza, Walterbos, & Braun (1999) Galarza, V. C., Walterbos, R. A. M., & Braun, R. 1999, AJ, 118, 2775
- Greenawalt (1998) Greenawalt, B. 1998, Ph.D. Thesis, New Mexico State University
- Greenawalt, Walterbos, & Braun (1997) Greenawalt, B., Walterbos, R. A. M., & Braun, R. 1997, ApJ, 483, 666
- Greenawalt et al. (1998) Greenawalt, B., Walterbos, R. A. M., Thilker, D. A., & Hoopes, C. G. 1998, ApJ, 506, 135
- Haffner, Reynolds, & Tufte (1999) Haffner, L. M., Reynolds, R. J., & Tufte, S. L. 1999, ApJ, 523, 223
- Heiles et al. (1995) Heiles, C., Koo, B., Levenson, N. A. & Reach, W. T. 1996, ApJ, 462, 326
- Hill et al. (1995) Hill, J. K. et al. 1995, ApJ, 438, 181
- Hill et al. (1998) Hill, R. S. et al. 1998, ApJ, 507, 179
- Hoopes & Walterbos (2000) Hoopes, C. G. & Walterbos, R. A. M. 2000, ApJ, 541, 597
- Hoopes, Walterbos, & Greenawalt (1996) Hoopes, C. G., Walterbos, R. A. M., & Greenawalt, B. 1996, AJ, 112, 1429
- Howarth (1983) Howarth, I. D. 1983, MNRAS, 203, 301
- Jones, Tielens & Hollenbach (1996) Jones, A. P., Tielens, A. G. G. M. & Hollenbach, D. J. 1996, ApJ, 469, 740
- Kaufman et al. (1987) Kaufman, M., Bash, F. N., Kennicutt, R. C., & Hodge, P. W. 1987, ApJ, 319, 61
- Leitherer et al. (1999) Leitherer, C., Schaerer, D. Goldader, J. D., González Delgado, R. M., Robert, C., Foo Kune, D., de Mello, D. F., Devost, D., & Heckman, T. M. 1999, ApJS, 123, 3
- Massey (1985) Massey, P. 1985, PASP, 97, 5
- Massey (1998) Massey, P. 1998, in ASP Conf. Proc. 142, The Stellar Initial Mass Function, ed. G. Gilmore & D. Howell (San Francisco:ASP), 17
- Massey et al. (1995a) Massey, P., Armandroff, T. E., Pyke, R., Patel, K., & Wilson, C. D. 1995a, AJ, 110, 2715
- Massey et al. (1995b) Massey, P., Lang, C. C., DeGioia-Eastwood, K., & Garmany, C. D. 1995b, ApJ, 438, 188
- McKee & Williams (1997) McKee, C. F. & Williams, J. P. 1997, ApJ, 476, 144
- Oey & Kennicutt (1997) Oey, M. S. & Kennicutt, R. C. 1997, MNRAS, 291, 827
- Oey & Clarke (1998) Oey, M. S. & Clarke, C. J. 1998, AJ, 115, 1543
- Osterbrock (1989) Osterbrock, D. E. 1989, Astrophysics of Gaseous Nebulae and Active Galactic Nuclei (Mill Valley: University Science Books)
- Patel & Wilson (1995) Patel, K., & Wilson, C. D. 1995, ApJ, 451, 607
- Petersen & Gammelgaard (1996) Petersen, L. & Gammelgaard, P. 1996, A&A, 308, 49
- Rand (1997) Rand, R. J. 1997, ApJ, 474, 129
- Quillen & Yukita (2001) Quillen, A. C. & Yukita, M. 2001, AJ, 121, 2095
- Reynolds (1991) Reynolds, R. J. 1991, in The Interstellar Disk-Halo Connection in Galaxies, IAU Symposium No. 144, edited by H. Bloemen (Dordrecht:Kluwer), 67
- Reynolds & Tufte (1995) Reynolds, R. J. & Tufte, S. L. 1995, ApJ, 439, L17
- Roy & Walsh (1986) Roy, J. & Walsh, J. R. 1986, MNRAS, 223, 39
- Schaerer & de Koter (1997) Schaerer, D. & de Koter, A. 1997, A&A, 322, 598
- Schaerer, et al. (1993) Schaerer, D., Meynet, G., Maeder, A., & Schaller, G. 1993, A&AS, 98, 523
- Slavin, McKee, & Holenbach (2000) Slavin, J. D., McKee, C. F., & Hollenbach, D. J. 2000, ApJ, 541, 218
- Slavin, Shull, & Begelman (1993) Slavin, J. D., Shull, J. M., & Begelman, M. C. 1993, ApJ, 407, 83
- Stecher et al. (1997) Stecher, T., et al. 1997, PASP, 109, 584
- Stewart et al. (2000) Stewart, S. G., et al. 2000, ApJ, 529, 201
- Torres-Peimbert, Lazcano-Araujo, & Peimbert (1974) Torres-Peimbert, S., Lazcano-Araujo, A., & Peimbert, M. 1974, ApJ, 191, 401
- von Hippel & Bothun (1990) von Hippel, T., & Bothun, G. 1990, AJ, 100, 403
- Walterbos & Braun (1994) Walterbos, R. A. M., & Braun, R. 1994, ApJ, 431, 156
- Walterbos & Braun (1996) Walterbos, R. A. M., & Braun, R. 1996, in ASP Conf. Proc. 106, The Minnesota Lectures on Extragalactic Neutral Hydrogen, ed. E. D. Skillman (San Francisco:ASP), 1
- Walsh & Roy (1997) Walsh, J. R. & Roy, J. -. 1997, MNRAS, 288, 726
- Wang et al. (1997) Wang, J., Heckman, T. M., & Lehnert, M. D. 1997, ApJ, 491, 114
- Zaritsky et al. (1994) Zaritsky, D., Kennicutt, R. C., & Huchra, J. P. 1994, ApJ, 420, 87


| Galaxy | Distance | Hubble Type | 12+log(O/H)aaOxygen abundance at 3 kpc radius, from Zaritsky et al. 1994. The metallicity of NGC 1512 was not found in the literature. |
|---|---|---|---|
| (Mpc) | |||
| NGC 598 (M33) | 0.84 | Scd | 8.700.06 |
| NGC 628 (M74) | 9.7 | Sc | 9.130.16 |
| NGC 925 | 9.3 | Sd | 8.680.11 |
| NGC 1313 | 4.5 | SBd | 8.330.11 |
| NGC 1512 | 16.6bbThe distance to NGC 1512 is uncertain. This value was taken from Buta (1988). | SBa | |
| NGC 1566 | 17.4 | Sbc | 9.100.40 |
| NGC 2903 | 6.3 | Sbc | 9.220.07 |
| NGC 3031 (M81) | 3.6 | Sab | 8.890.16 |
| NGC 5194 (M51) | 9.6 | Sbc | 9.280.11 |
| NGC 5457 (M101) | 7.4 | Scd | 8.760.05 |
| Galaxy | H Telescope | H Exposure Time | H Sensitivityaa1017erg s-1 cm-2 arcsec-2 | H Calibration |
|---|---|---|---|---|
| (seconds) | ||||
| NGC 598 (M33) | KPNO Schmidt | 20900 | 0.8 | R-mag |
| NGC 628 (M74) | KPNO 0.9m | 16900 | 0.9 | Standard |
| NGC 925 | KPNO 0.9m | 16900 | 1.3 | Standard |
| NGC 1313 | CTIO 0.9m | 2900 | 2.2 | Standard |
| NGC 1512 | CTIO 0.9m | 21400 | 1.6 | Standard |
| NGC 1566 | CTIO 0.9m | 21000 | 1.4 | Standard |
| NGC 2903 | KPNO 0.9m | 16900 | 0.7 | Standard |
| NGC 3031 (M81) | KPNO Schmidt | 14900 | 1.5 | Regions |
| NGC 5194 (M51) | KPNO 0.9m | 31200 | 2.7 | R-mag |
| NGC 5457 (M101) | KPNO Schmidt | 13900 | 1.6 | Regions |
| Galaxy | Exposure Time | FilteraaThe UIT B1 filter is 354Å wide with an effective wavelength of =1521Å, and the B5 filter is 225Å wide with =1615Å. | Sensitivitybb1017erg s-1 cm-2 arcsec-2 | ResolutionccSpatial resolution based on 2′′ angular resolution of UIT. | Mission |
|---|---|---|---|---|---|
| (seconds) | (parsecs) | ||||
| NGC 598 (M33) | 424 | B1 | 1.3 | 8 | Astro-1 |
| NGC 598 (M33) | 626 | B5 | 2.0 | 8 | Astro-2 |
| NGC 628 (M74) | 514 | B1 | 0.9 | 70 | Astro-1 |
| NGC 925 | 1590 | B5 | 0.7 | 90 | Astro-2 |
| NGC 1313 | 1070 | B5 | 1.0 | 44 | Astro-2 |
| NGC 1512 | 948 | B5 | 1.1 | 161 | Astro-2 |
| NGC 1566 | 1390 | B5 | 0.8 | 169 | Astro-2 |
| NGC 2903 | 548 | B1 | 1.0 | 61 | Astro-2 |
| NGC 3031 (M81) | 640 | B1 | 0.8 | 35 | Astro-1 |
| NGC 5194 (M51) | 1100 | B1 | 0.5 | 93 | Astro-2 |
| NGC 5457 (M101) | 1310 | B1 | 0.5 | 72 | Astro-2 |
| Galaxy | LHαaaThe H filter used for NGC 3031, NGC 5194, and NGC 5457 contains a contribution from . | H DFaaThe H filter used for NGC 3031, NGC 5194, and NGC 5457 contains a contribution from . | log LHα/LUIT Total | log LHα/LUIT | log LHα/LUIT DIG | FUV DFbbThe diffuse fraction (DF) is the ratio of the luminosity contributed by DIG to the total luminosity of the galaxy. |
|---|---|---|---|---|---|---|
| (erg s-1) | ||||||
| NGC 598 (B1) | 3.00.31040 | 0.380.03 | 1.750.10 | 2.060.07 | 1.470.10 | 0.730.21 |
| NGC 628 | 1.70.31041 | 0.430.05 | 1.640.11 | 2.410.09 | 1.310.11 | 0.910.26 |
| NGC 2903 | 6.51.81040 | 0.270.09 | 2.160.14 | 2.540.12 | 1.740.14 | 0.720.21 |
| NGC 3031 | 7.81.21040 | 0.490.08 | 2.120.11 | 2.650.08 | 1.870.11 | 0.870.25 |
| NGC 5194 | 3.10.31041 | 0.430.03 | 1.880.10 | 2.220.07 | 1.620.10 | 0.770.22 |
| NGC 5457 | 2.40.31041 | 0.430.04 | 1.410.11 | 1.950.08 | 1.110.11 | 0.840.24 |
| NGC 598 (B5) | 3.00.31040 | 0.380.03 | 1.510.10 | 1.990.07 | 1.170.10 | 0.840.24 |
| NGC 925 | 7.60.51040 | 0.370.05 | 1.700.10 | 2.300.06 | 1.330.10 | 0.860.25 |
| NGC 1313 | 2.70.51040 | 0.460.09 | 1.570.12 | 1.880.09 | 1.350.12 | 0.760.22 |
| NGC 1512 | 2.90.61040 | 0.150.03 | 1.250.12 | 2.200.10 | 0.470.12 | 0.910.26 |
| NGC 1566 | 3.20.61041 | 0.330.07 | 1.580.12 | 2.130.09 | 1.180.12 | 0.820.23 |
| Galaxy | Mean Observed Log | DifferenceaaThe difference between the observed Log and that predicted for a 1 Myr burst. | E(B-V) MWbbThe amount of extinction which would account for the difference. The Milky Way extinction law is from Cardelli et al. 1989, and the LMC extinction law is from Howarth 1983. | E(B-V) LMCbbThe amount of extinction which would account for the difference. The Milky Way extinction law is from Cardelli et al. 1989, and the LMC extinction law is from Howarth 1983. | Published E(B-V)ccReferences for published reddening: NGC 598 – Massey et al. 1995a; NGC 628 – Petersen & Gammelgaard 1996; NGC 2903, NGC 1512, NGC 5194 – Quillen & Yukita 2001; NGC 3031 – Kaufman et al. 1987; NGC 5457 – Bresolin, Kennicutt, & Stetson 1996; NGC 925 – Zaritsky et al. 1994; NGC 1313 – Walsh & Roy 1997; NGC 1566 – Roy & Walsh 1986 (c(H) was converted to E(B-V) for NGC 1566). |
|---|---|---|---|---|---|
| NGC 598 (B1) | 14.27 | 0.75 | 0.33 | 0.23 | |
| NGC 628 | 14.05 | 0.57 | 0.25 | 0.18 | |
| NGC 2903 | 14.35 | 0.98 | 0.44 | 0.31 | |
| NGC 3031 | 14.25 | 0.77 | 0.34 | 0.24 | |
| NGC 5194 | 13.96 | 0.59 | 0.27 | 0.19 | |
| NGC 5457 | 13.87 | 0.35 | 0.15 | 0.11 | |
| NGC 598 (B5) | 14.31 | 0.71 | 0.33 | 0.23 | |
| NGC 925 | 13.79 | 0.20 | 0.09 | 0.07 | |
| NGC 1313 | 13.65 | 0.05 | 0.02 | 0.02 | |
| NGC 1512 | 13.68 | 0.13 | 0.06 | 0.04 | |
| NGC 1566 | 13.61 | 0.06 | 0.03 | 0.02 |
| Galaxy | Log (mean FHα/FUIT) HII Log (mean FHα/FUIT) DIG | Fraction of M33 Ratio | Field Star Contribution (%) |
|---|---|---|---|
| NGC 598 (B1) | 0.810.10 | 0.400.12aaThe field OB star contribution given for M33 was that measured in Hoopes & Walterbos 2000. | |
| NGC 628 | 1.170.11 | 0.440.17 | 0.910.17 |
| NGC 2903 | 0.730.14 | 1.200.55 | 0.330.19 |
| NGC 3031 | 0.870.11 | 0.870.34 | 0.460.21 |
| NGC 5194 | 1.090.10 | 0.520.20 | 0.770.22 |
| NGC 5457 | 0.780.11 | 1.070.41 | 0.370.17 |
| NGC 598 (B5) | 1.160.10 | 0.400.12aaThe field OB star contribution given for M33 was that measured in Hoopes & Walterbos 2000. | |
| NGC 925 | 1.020.10 | 1.380.52 | 0.290.13 |
| NGC 1313 | 0.810.12 | 2.240.92 | 0.180.09 |
| NGC 1512 | 0.720.12 | 2.751.15 | 0.150.08 |
| NGC 1566 | 1.130.12 | 1.070.44 | 0.370.18 |