The Chandra Deep Field North Survey. VI. The Nature of the Optically Faint X-ray Source Population
Abstract
We provide constraints on the nature of the optically faint () X-ray source population from a 1 Ms Chandra exposure of a region within the Hawaii flanking-field area containing the Hubble Deep Field North region. We detect 47 ( deg) optically faint sources down to 0.5–2.0 keV and 2.0–8.0 keV fluxes of erg cm s and erg cm s, respectively; these sources contribute % and % of the 0.5–2.0 keV and 2.0–8.0 keV X-ray background radiation, respectively. The fraction of optically faint X-ray sources is approximately constant (at %) for 0.5–8.0 keV fluxes from ergs cm s down to the X-ray flux limit. A considerable fraction (30%) of the optically faint X-ray sources are Very Red Objects ( 4). Analysis of the optical and X-ray properties suggests a large number of optically faint X-ray sources are likely to host obscured AGN activity at 1–3. From these results we calculate that a significant fraction ( 5–45%) of the optically faint X-ray source population could be obscured QSOs (rest-frame unabsorbed 0.5–8.0 keV luminosity erg s) at . Given the number of X-ray sources without -band counterparts, there are unlikely to be more than 15 sources at . We provide evidence that the true number of sources is considerably lower.
We investigate the multi-wavelength properties of optically faint X-ray sources. Nine optically faint X-ray sources have Jy radio counterparts; % of the optically faint Jy radio sources in this region. The most likely origin of the X-ray emission in these X-ray detected, optically faint Jy radio sources is obscured AGN activity. However, two of these sources have been previously detected at sub-millimeter wavelengths and the X-ray emission from these sources could be due to luminous star formation activity. Assuming the spectral energy distribution of NGC 6240, we estimate the 175 m flux of a typical optically faint X-ray source to be mJy; however those sources with detectable sub-millimeter counterparts (i.e., 3 mJy) could be substantially brighter. Hence, most optically faint X-ray sources are unlikely to contribute significantly to the far-IR (140–240 m) background radiation. However, as expected for sources with AGN activity, the two optically faint X-ray sources within the most sensitive area of the ISOCAM HDF-N region have faint (50 Jy) 15 m counterparts.
We also provide constraints on the average X-ray properties of classes of optically faint sources not individually detected at X-ray energies. Stacking analyses of optically faint Jy radio sources not individually detected with X-ray emission yields a possible detection (at % confidence) in the 0.5–2.0 keV band; this X-ray emission could be produced by star formation activity at 1–3. None of the optically faint AGN-candidate sources in the HDF-N itself are detected at X-ray energies either individually or with stacking analyses, showing that these sources have low X-ray luminosities if they are indeed AGN.
The Astronomical Journal, 2001 November, astro-ph/0107450
1 Introduction
One of the key goals of X-ray astronomy during the last 40 years has been to determine the origin of the X-ray background (Giacconi et al. 1962). Surveys taken prior to the launch of the Chandra X-ray Observatory (hereafter Chandra; Weisskopf et al. 2000) performed in both the soft X-ray ( 0.5–2.0 keV) and hard X-ray ( 2.0–10.0 keV) bands showed that a significant fraction of the X-ray background is produced by discrete sources, primarily obscured and unobscured AGN (e.g., Hasinger et al. 1998; Ueda et al. 1998, 1999; Fiore et al. 1999; Akiyama et al. 2000; Lehmann et al. 2001). The improved sensitivity and sub-arcsecond resolution of Chandra is allowing deep X-ray surveys to resolve close to 100% of the 0.5–8.0 keV background (e.g., Mushotzky et al. 2000; Brandt et al. 2001a, hereafter Paper IV; Garmire et al. 2001, hereafter Paper III; Tozzi et al. 2001; Brandt et al. 2001b, hereafter Paper V). The optical spectroscopic identification of the optically brighter () X-ray sources is currently in progress, and the majority of the sources appear to be AGN at 1 (e.g., Hornschemeier et al. 2001, hereafter Paper II; Tozzi et al. 2001; A.J. Barger et al. , in preparation). However, a significant fraction (%) of the X-ray sources are too faint () for optical spectroscopic observations (e.g., Barger et al. 2001a; Paper II; Tozzi et al. 2001).
The combination of faint optical emission and bright X-ray emission suggests that many of these optically faint X-ray sources are powerful high-redshift AGN (e.g., Fabian et al. 2000; Barger et al. 2001a; Cowie et al. 2001; Schreier et al. 2001). The nature and properties of such sources are important for understanding moderate-to-high-redshift () accretion activity and the role of AGN activity in galaxy formation (e.g., Fabian 1999; Haiman & Loeb 1999; Cowie et al. 2001). Some optically faint X-ray sources have flat X-ray spectral slopes (e.g., Paper II; Cowie et al. 2001), suggesting they may be highly obscured AGN, and a number of the sources could be obscured QSOs (i.e., ergs). Although very few obscured QSOs have been detected locally, they are predicted to exist in large numbers at high redshift (e.g., Wilman, Fabian, & Nulsen 2000; Gilli, Salvati, & Hasinger 2001). If the origin of the obscuration in these sources are optically thick dusty tori (e.g., Antonucci 1993), they should also produce powerful infrared emission and may contribute significantly to the cosmic infrared background (e.g., Puget et al. 1996; Schlegel et al. 1998).
Significant numbers of optically faint X-ray sources have been detected in other X-ray surveys; however, the analysis of such sources has been either limited to detailed single object studies (e.g., Cowie et al. 2001) or combined within larger object identification studies (e.g., Mushotzky et al. 2000; Barger et al. 2001a; Paper II). We present here the first detailed analysis of the optically faint () X-ray source population with a 1 Ms Chandra observation of the HDF-N and surrounding Hawaii flanking-field area (i.e., Paper V).111The Hawaii flanking-field area is defined by the optical and near-IR observations presented in Barger et al. (1999). We have chosen the Hawaii flanking-field area in this study for a number of important reasons. First, we include the most sensitive and positionally accurate X-ray data as the HDF-N itself is at the aim-point of the Chandra observation. Second, the Hawaii flanking-field area has deep optical (Barger et al. 1999), radio (Richards et al. 1998; Richards 2000) and sub-millimeter (Barger, Cowie, & Richards 2000; Chapman et al. 2001; Barger et al. 2001b) coverage, and the properties of optically faint Jy radio sources within this region have been pursued by Richards et al. (1999). Finally, by including the HDF-N itself we guarantee very deep multi-wavelength coverage within the central region. The high surface density of sources means that Chandra is the only X-ray observatory with the positional accuracy to pin-point optically faint X-ray sources. The larger positional uncertainty of XMM-Newton detected sources will sometimes result in optically faint counterpart to an X-ray source.
In this study we compare the X-ray, optical and near-IR properties of the optically faint X-ray sources to those of the optically bright X-ray sources. We investigate the radio and infrared properties of optically faint X-ray sources, review the properties of the best-studied optically faint X-ray sources to date, estimate their redshifts and place constraints on the fraction of obscured QSOs in the optically faint X-ray source population. We also provide constraints on the X-ray emission properties of optically faint Jy radio sources (Richards et al. 1999) not individually detected at X-ray energies and optically faint AGN candidates (Jarvis & MacAlpine 1998; Conti et al. 1999) within the HDF-N itself.
The Galactic column density along this line of sight is cm (Stark et al. 1992), and km s Mpc and are adopted throughout this paper. All coordinates in this paper are J2000.
2 Chandra ACIS-I observations
The X-ray results reported in this paper were obtained with the 1 Ms Chandra Advanced CCD Imaging Spectrometer (ACIS; G.P. Garmire et al. , in preparation) survey of the HDF-N and its environs presented in Paper V. With the exception of a number of lower significance Chandra sources reported in §5.1, all the Chandra sources were taken from Paper V. Results for the HDF-N itself have been presented by Hornschemeier et al. (2000, hereafter Paper I) and in Paper IV for 164.5 ks and 479.7 ks exposures, respectively. Results obtained with a 221.9 ks exposure over the larger Caltech Faint Field Galaxy Redshift Survey Area (hereafter referred to as the “Caltech area”; e.g., Cohen et al. 2000; Hogg et al. 2000) centered on the HDF-N have been presented in Paper II. The area used in this study () is slightly smaller than the Hawaii Flanking Field area, and a large fraction of it overlaps with the Caltech area.222We have not used the full Hawaii flanking field area to avoid the lower optical and near-IR sensivity towards the edge of these images. Source detection in each standard X-ray band (see Paper V) was performed with wavdetect (Freeman et al. 2001) with a probability threshold of 10; we would expect spurious sources for each X-ray band over the entire region with this procedure. A lack of spurious faint X-ray sources is essential for this study since some sources may not have a detectable optical counterpart; we provide corroborating evidence for a low fraction of spurious optically faint X-ray sources in §3.2. All sources were inspected to ensure that they are not produced or affected by “cosmic ray afterglows” (Chandra X-ray Center 2000, private communication).
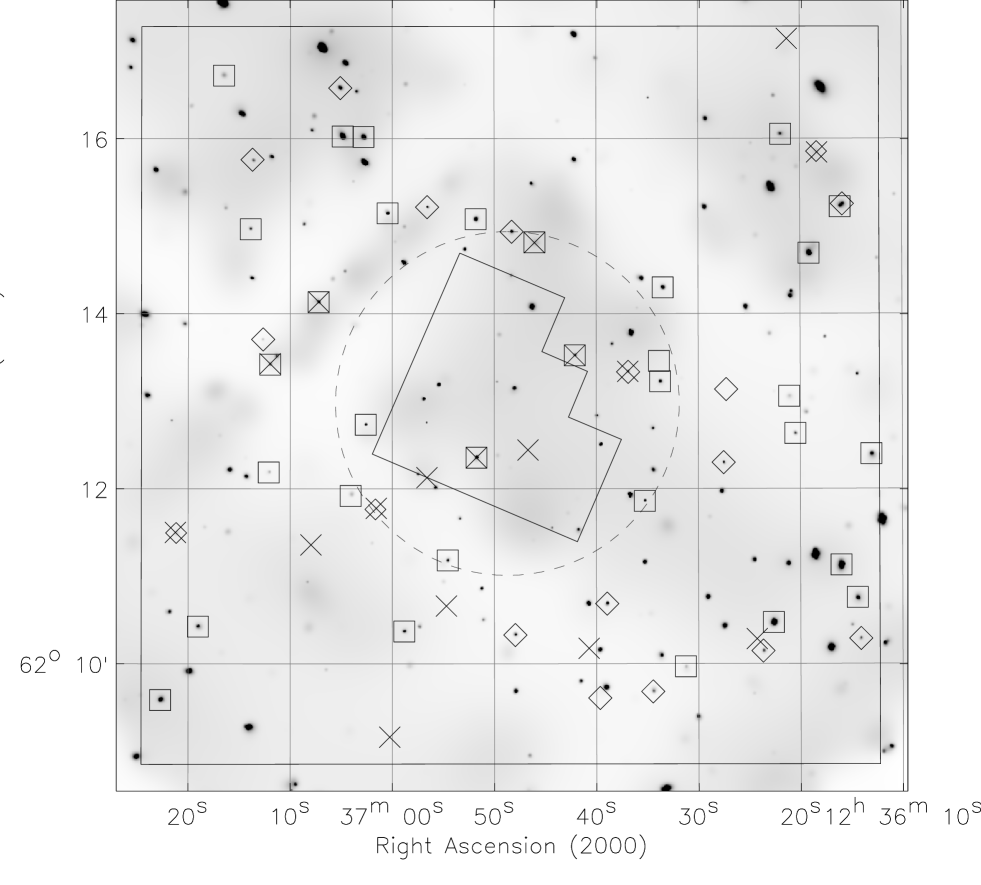
In total 141 sources (hereafter referred to as the entire X-ray sample) were detected in the region defined here: 136 in the full band (0.5–8.0 keV), 117 in the soft band (0.5–2.0 keV) and 102 in the hard band (2.0–8.0 keV). We show the Chandra image in Figure 1. The “effective” full-band exposure time per source, as derived from our exposure map, ranges from 644–945 ks with most sources (85%) having ks of exposure. Even with these long exposure times, the Chandra ACIS is entirely photon limited for point-source detection near the aim point. For a power-law model with photon index and the Galactic column density, our count soft-band and count hard-band detection limits correspond to flux limits of erg cm s and erg cm s, respectively. The absolute X-ray source positions within 5 of the aim point are accurate to 0.6; for sources outside this region, the positional errors rise to (see Paper V).
3 Basic optical and X-ray properties of the optically faint X-ray sources
3.1 Optical source magnitudes and spectroscopic identifications
There are published magnitudes for and sources over the entire region used in this study (Barger et al. 1999). We retrieved the publicly available images333These images are available at http://www.ifa.hawaii.edu/cowie/hdflank/hdflank.html. to search for fainter sources and determine magnitudes for X-ray sources down to limits of and using the sextractor photometry tool (Bertin & Arnouts 1996), assuming the “Best” magnitude criteria; see Table 1. We found good agreement ( magnitude deviations of 0.25 mags) with Barger et al. (1999) for the sources included in their catalog. While a large fraction of this region has additional optical-to-near-IR coverage (Hogg et al. 2000), we have not included analysis of this data since deeper multi-band optical photometry is currently being obtained (A.J. Barger et al. , in preparation). Although we only have two optical-to-near-IR magnitudes per source, the choice of -band and -band observations are useful as many sources have red optical-to-near-IR colors (see §4.1). The addition of deep shorter wavelength
![[Uncaptioned image]](/html/astro-ph/0107450/assets/x2.png)
The -band magnitude distribution of optical counterparts for the entire X-ray sample. The hatched blocks are the optically faint sources, and the unhatched blocks are the optically bright sources; the 15 sources without 2 -band counterparts are shown as upper limit arrows which correspond to . Compare to Figure 1 of Richards et al. (1999).
optical observations would also be useful and could provide strong constraints on source redshifts through the utilization of the band drop-out technique (e.g., Steidel et al. 1996; see §6.2).
We matched the X-ray sources to -band counterparts using a search radius of 1; the -band magnitude distribution of the entire X-ray sample is shown in Figure 2. This distribution can be compared to the Jy radio source -band magnitude distribution of Richards et al. (1999), whose survey covered approximately the same region. The -band magnitude distribution of the radio sources peaks with a median of and falls off at fainter magnitudes. At a population of optically faint Jy radio sources is detected; 30% of the Jy radio sources have . The median -band magnitude of the entire X-ray sample is also , although we do not see a decline to fainter optical magnitudes; in fact the distribution is reasonably flat for (16% have ).
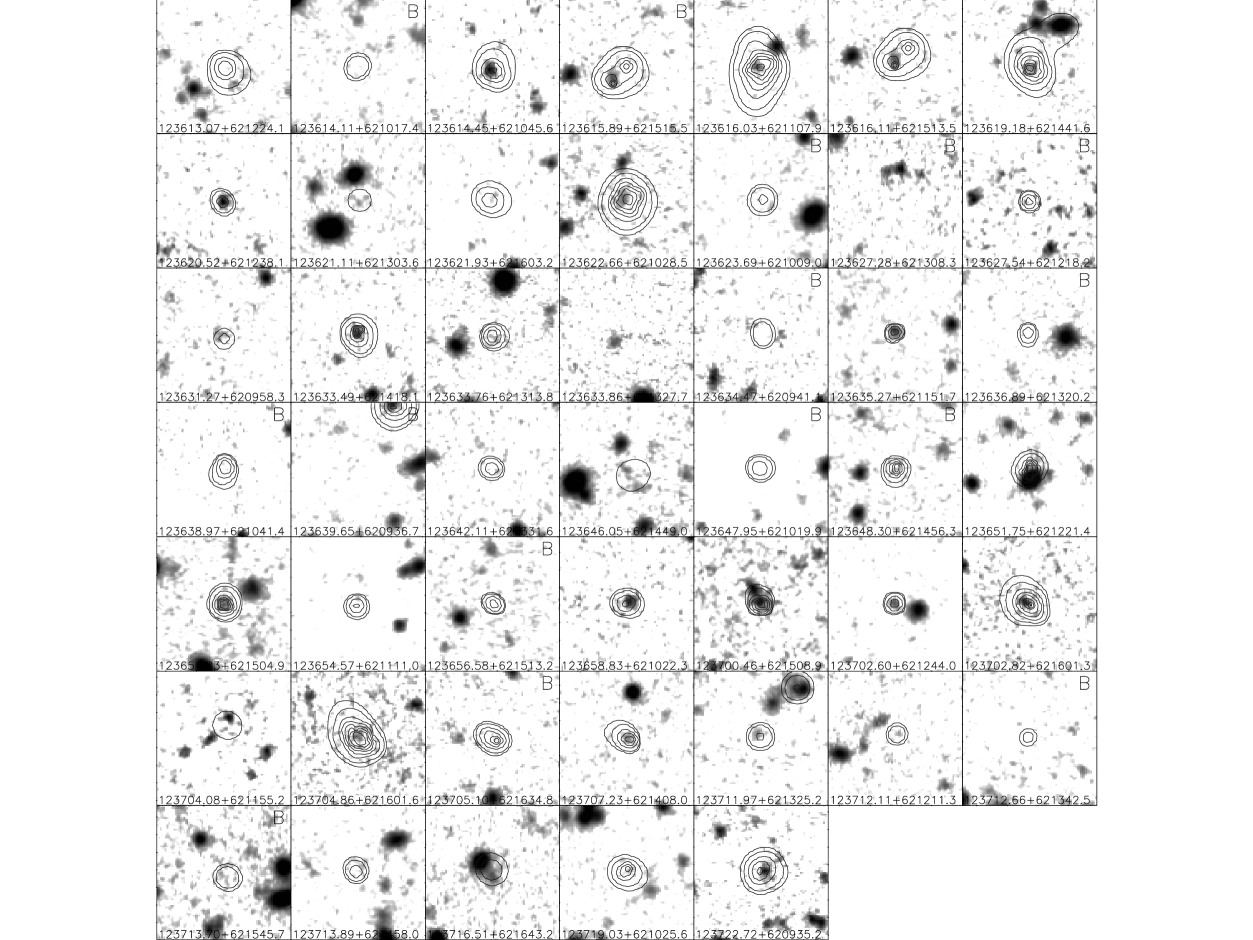
We have adopted as the definition of an optically faint source. This optical magnitude limit is fainter than that which can be reasonably achieved with optical spectroscopy on a 10-m class telescope, and therefore other techniques are required to determine the redshifts and nature of these sources. From the entire X-ray sample, 47 sources have (see Table 1) and 22 of these have an -band counterpart. These sources account for % of the X-ray sources detected in the entire X-ray sample.444Note that all errors are determined from Tables 1 and 2 of Gehrels (1986) and correspond to the level. Thumbnail images of all the optically faint X-ray sources are shown in Figure 3. None of the sources show evidence for extended emission (although also see §4.5); the slightly extended structure of CXOHDFN J123619.2+621442 is due to a nearby faint X-ray source. However, one source (CXOHDFN J123616.1+621514) appears to be associated with an optically blank X-ray source (see §6.2 for further discussion). Only one source (CXOHDFN J123651.8+621221; see Paper I and Paper IV) lies in the HDF-N itself; this source has an counterpart (M. Dickinson 2000, private communication).
Fifteen sources do not have 2 -band counterparts, setting an -band magnitude limit of , although four of these sources have counterparts. These sources are referred to as optically blank X-ray sources and remain a part of the optically faint X-ray source sample, although we test whether they are statistically different in §6.2. Given the surface density of sources there is an % chance that an X-ray source is coincidently matched to a source. Therefore we would expect optically faint X-ray sources to have been erroneously matched to an optically bright counterpart; as this is a small fraction of the optically faint X-ray source sample, this discrepancy will not affect our conclusions.
Published optical spectroscopic identifications are presently available for 61 (65%) of the optically bright () X-ray sources; these spectroscopic identifications were taken from Cohen et al. (2000), Paper II, and Dawson et al. (2001). For comparison, only two optically faint X-ray sources have spectroscopic identifications. One source (CXOHDFN J123633.5+621418) is a (see Cohen et al. 2000; Paper II) broad-line AGN (BLAGN) that is only marginally optically faint with our photometry (). The other source (CXOHDFN J123642.1+621332) is fainter and lies at a higher redshift (; Waddington et al. 1999; but also see §2.2 of Barger, Cowie, & Richards 2000). The spectroscopic and X-ray properties of this source strongly suggest it contains an AGN (Waddington et al. 1999; Paper IV).
To assist in the interpretation of the optically faint X-ray sample we have defined two sub-samples from the optically bright X-ray source sample. The first includes seven of the eight BLAGN reported in Paper II; the eighth source is optically faint with our photometry (see above). The second contains luminous narrow-line AGN (NLAGN) and includes the six narrow-line X-ray sources with 0.5–8.0 keV luminosities erg s reported in Paper II. Three of the narrow-lined sources have AGN signatures in their optical spectra, while the signal-to-noise in the optical spectroscopic observations of the other three sources is insufficient to detect high ionization AGN lines (although their high X-ray luminosities suggest they are NLAGN; Paper II). While NLAGN sources with X-ray luminosities lower than erg s were also reported in Paper II, we have chosen this definition of a NLAGN to minimize the potential contribution at X-ray energies from starburst activity. These samples are not complete, as a fraction of the unclassified optically bright X-ray sources are likely to be BLAGN or luminous NLAGN.
3.2 X-ray fluxes
The full-band X-ray flux distribution of the entire X-ray sample is shown in Figure 4. The optically faint sources are detected over a similar X-ray flux range to the optically bright sources, and clearly some optically faint sources are among the brightest X-ray sources in the entire X-ray sample (see also Figure 1). Similar percentages of optically faint and optically bright X-ray sources are detected in the full band (% for the optically faint sample versus % for the optically bright sample). A Kolmogorov-Smirnov (K-S) test shows that the full-band X-ray flux distributions of these sources are indistinguishable; the K-S test probability is 45%. This provides additional evidence that the number of spurious optically faint sources is low (see §2). The fraction of optically faint and optically bright X-ray sources detected in the hard band (% for the
![[Uncaptioned image]](/html/astro-ph/0107450/assets/x4.png)
The full-band flux distributions of (a) the optically faint X-ray sample and (b) the optically bright X-ray sample. The two X-ray flux distributions are not distinguishable according to the Kolmogorov-Smirnov (K-S) test. The solid blocks show the overlaid flux distribution of X-ray sources without 2 -band counterparts.
optically faint sample versus % for the optically bright sample) and soft band (% for the optically faint sample versus % for the optically bright sample) are statistically consistent, although the current uncertainties are large.
In Figure 5 we show the fraction of optically faint sources in the entire X-ray sample versus full-band flux. With the exception of the brightest X-ray flux bin, where only one optically bright X-ray source is detected, the data are consistent with an % fraction of optically faint sources for full-band fluxes of erg cm s. We have not detected any optically faint sources with soft-band X-ray fluxes erg cm s or hard-band fluxes erg cm s; however, optically faint X-ray sources with larger X-ray fluxes have been detected in other Chandra surveys (e.g., source 7 in Mushotzky et al. 2000 has a soft-band flux of erg cm s and a hard-band X-ray flux of erg cm s). Wide-field, shallow X-ray surveys such as the Chandra Multi-wavelength Project (ChaMP; Wilkes et al. 2001)555Details of the ChaMP project can be found at http://hea-www.harvard.edu/CHAMP/. will be well suited for determining the fraction of optically faint sources at brighter X-ray fluxes (i.e., full-band X-ray fluxes erg cm s).
![[Uncaptioned image]](/html/astro-ph/0107450/assets/x5.png)
The fraction of optically faint X-ray sources versus full-band flux. The width of each X-ray flux bin is shown as bars in the -axis direction. The 1 uncertainty in the fraction of optically faint X-ray sources is shown as bars in the -axis direction. The numbers plotted for each data point show the number of optically faint X-ray sources over the total number of X-ray sources for each X-ray flux bin. The dashed line shows the overall fraction of optically faint X-ray sources in the entire X-ray sample, and the dotted lines show the 1 uncertainty on this value. The fraction of optically faint X-ray sources is consistent with being constant (%) for full-band fluxes erg cm s.
3.3 X-ray background contribution
Due to the significant number of sources with upper limits in the soft or the hard X-ray bands, the most accurate determination of the X-ray background contribution from the optically faint X-ray sources is made by stacking the individual X-ray sources; see also Paper II and Paper IV for use of the stacking technique. The total number of counts for each source is measured in an aperture equal to the size of the point-spread function (see §3.2.1 in Paper V); the size and shape of the point-spread function is a function of off-axis angle. The average number of background counts is calculated and removed to give the net number of counts per source. The results from all sources are combined to give a total number of counts for both the optically faint and optically bright X-ray samples. The total flux for each sample is then calculated using the average X-ray band ratio (see §4.3), which was corrected for vignetting. To check this technique we determined the average band ratio of the whole sample; we found this to be , which corresponds to , similar to that found for the spectral slope of the X-ray background (e.g., compare to Tozzi et al. 2001). The optically faint X-ray sources contribute % of the total X-ray emission in the full band, % of the total X-ray emission in the soft band, and % of the total X-ray emission in the hard band. The uncertainties in these values have been determined assuming the limiting factor in these calculations is the small number of sources. We note, however, that “cosmic variance” is also likely to be important.
Based on the analysis of G.P. Garmire et al. , in preparation, which uses the normalization of Chen, Fabian, & Gendreau (1997), these HDF-N observations resolve % of the X-ray background in the soft band and % of the X-ray background in the hard band. Therefore, the optically faint X-ray source population contributes a non-negligible fraction (% in the soft band and % in the hard band) of the X-ray background.
4 Comparisons of the optically faint and optically bright X-ray source populations
In this section we provide constraints on the nature of the optically faint X-ray source population from a comparison to the optical, near-IR and X-ray properties of the optically bright X-ray source population.
4.1 Optical-to-near-IR colors
Deep X-ray surveys show a correlation between the optical faintness and optical-to-near-IR color of X-ray sources (e.g., Hasinger et al. 1998; Giacconi et al. 2001; Lehmann et al. 2001). In Figure 6 we show a plot of color versus -band magnitude for the entire X-ray sample; the -band magnitude was determined from following Barger et al. (1999). The correlation between the optical magnitude and optical-to-near-IR color of X-ray sources is clearly seen in our data. The Spearman and Kendall tests show a correlation is present with 99.99% confidence for the optically bright sources; we omitted the optically faint sources due to the larger uncertainties in the source magnitudes. With the exception of the BLAGN, the X-ray sources are among the reddest sources at a given optical magnitude, and the best linear fit to the non-BLAGN sources is very similar to that found for the Jy radio source population (Richards et al. 1999). Two obvious mechanisms can produce this reddening effect: (1) extinction of the optical continuum and/or, (2) the positive -corrections of a normal galaxy with increasing redshift (e.g., Pozzetti & Mannucci 2000). The expected redshifts of elliptical and spiral galaxies with are and respectively (e.g., Moriondo, Cimatti, & Daddi 2000; Pozzetti & Mannucci 2000; Barger et al. 2001a). The luminous NLAGN sources follow the trend found for the non-BLAGN sources showing that their optical-to-near-IR emission is probably dominated by the host galaxy. By comparison, the BLAGN have blue colors over a large range of redshifts ( for our sample), presumably due to the domination of the AGN emission at these wavelengths.
The majority of the optically faint X-ray sources have red optical-to-near-IR colors (), and nine (30%) of the 30 sources with measurable colors are very red objects (VROs; ); by comparison only one (1%) of the 94 optically bright X-ray sources is a VRO. A detailed analysis of the X-ray emission from VROs will be published elsewhere (D.M. Alexander et al. , in preparation). In general these colors are inconsistent with those expected for a normal BLAGN at 6 (i.e., before Lyman- leaves the -band; see Figure 6 and §6.2), although they are consistent with those expected for extremely high redshift BLAGN, reddened BLAGN (e.g., Webster et al. 1995; Barkhouse & Hall 2001), and comparitively normal galaxies that are either dust extincted and/or lie at .
![[Uncaptioned image]](/html/astro-ph/0107450/assets/x6.png)
color versus -band magnitude for the entire X-ray sample; the -band magnitude was determined from following Barger et al. (1999). The small dots are the field galaxy population (from Barger et al. 1999), the open circles are the unclassified Chandra sources, the filled triangles are the BLAGN sources, and the filled squares are the luminous NLAGN. The solid line shows the best linear fit to the non-BLAGN sources; this is comparable to the slope for the Jy radio sources shown in Figure 2 of Richards et al. (1999). The Spearman and Kendall tests show a correlation is present with 99.99% confidence. The BLAGN do not follow this trend; their average color stays roughly constant for . The long dashed line shows the expected colors for a QSO. The QSO colors were calculated from a standard quasar spectrum with (where ) and typical emission-line strengths. The colors correspond to that expected for an QSO, see Figure 12 for the equivalent redshifts; at , Lyman- leaves the -band leading to large colors. The vertical dotted line shows the optical magnitude distinction between optically bright () and optically faint () sources. The diagonal line of color upper limits is due to the magnitude limit.
4.2 X-ray-to-optical flux ratios
An important diagnostic of the nature of X-ray sources is the X-ray-to-optical flux ratio (e.g., Maccacaro et al. 1988; Stocke et al. 1991). Luminous AGN (both BLAGN and NLAGN) have typical X-ray-to-optical flux ratios, in both the soft and hard bands, of (e.g., Schmidt et al. 1998; Akiyama et al. 2000; Paper II; Lehmann et al. 2001). A large fraction of sources are also detected in the soft band with lower X-ray-to-optical flux ratios (i.e., ). These sources include normal galaxies, stars and low-luminosity AGN (e.g., Giacconi et al. 2001; Paper II; Lehmann et al. 2001; Paper IV; A.E. Hornschemeier et al. , in preparation); normal galaxies and stars generally have weak hard X-ray emission and consequently very small X-ray-to-optical ratios (i.e., ).
Previous studies have used either the -band or -band when determining the X-ray-to-optical flux ratios of sources whereas our study uses the -band magnitude (see Figure 7). The average of the X-ray sources reported in Paper II is 0.9 mags, which corresponds to a difference between and of only % once the zero points of the -band and -band magnitude scales are accounted for. The optically bright BLAGN and luminous NLAGN sources lie within the typical range of X-ray-to-optical flux ratios found for luminous AGN (see Figure 7). The other optically bright sources cover a large range of soft-band X-ray-to-optical flux ratios, and, although we have not classified all these sources with optical spectroscopy, a
![[Uncaptioned image]](/html/astro-ph/0107450/assets/x7.png)
(a) Soft-band and (b) hard-band fluxes versus -band magnitude; both individual Chandra sources and the results of stacking sources not individually detected by Chandra (see §5.1 and §5.2) are shown. The optically bright X-ray sources with upper limits are not plotted; both X-ray detections and X-ray upper limits are plotted for the optically faint X-ray sources. The dotted lines in the horizontal and vertical directions show the X-ray flux limits and the distinction between optically bright and optically faint sources respectively. The small open circles are the unclassified sources, the filled triangles are the BLAGN, and the filled squares are luminous NLAGN. The large cross is the stacking analysis limit for the Conti et al. (1999) optical AGN candidates, the large open circle is the stacking analysis limit for the Jarvis & MacAlpine (1998) optical AGN candidates, and the large star is the stacking analysis limit for the Richards et al. (1999) optically faint Jy radio sources. Three sources with extreme flux ratios are labeled. The source CXOHDFN J123651.8+621221 is likely to be an obscured QSO (see §6.2).
broad range of source types are detected (see Figure 7a).
It is clear that the optical magnitude threshold of the optically faint X-ray sample restricts the range of possible source types for this population, and we have probably not yet reached the X-ray sensitivity needed to detect optically faint non-AGN sources (see §5.1 for some possible exceptions). This point is further enforced in Figure 7b which shows that the optically faint sources have hard-band X-ray-to-optical flux ratios typical of AGN. Some optically faint sources are among the brightest X-ray sources in the entire X-ray sample, suggesting luminous AGN activity even at moderate redshift. For example, the two brightest X-ray sources (CXOHDFN J123616.0+621108 and CXOHDFN J123704.9+621602) would have QSO-level X-ray luminosities (rest-frame 0.5–8.0 keV unabsorbed luminosities of ergs s) at ; see §6.3.
4.3 X-ray band ratios
One of the key distinctions between the main classes of AGN is made from X-ray observations. Unobscured AGN are almost always BLAGN and have steep X-ray spectral slopes (e.g., ; George et al. 2000), while obscured AGN are predominantly NLAGN and have highly absorbed X-ray emission (e.g., ; see Risaliti, Maiolino, & Salvati 1999) and consequently flat X-ray spectral slopes (e.g., ). While AGN with steep X-ray spectral slopes are almost exclusively BLAGN, a number of source types other than NLAGN can have flat X-ray spectral slopes [e.g., Broad Absorption Line QSOs (BALQSOs) and other obscured Type 1 AGN; Gallagher et al. 1999; Comastri et al. 2001]. A comparison of the X-ray spectral slopes of the optically faint X-ray sources and the optically bright X-ray sources will therefore provide constraints on whether the majority of the AGN activity in the optically faint X-ray source population is obscured or unobscured.
In Figure 8 we show a plot of the X-ray band ratio, defined as the ratio of hard-band to soft-band counts, versus the soft-band count rate. The general trend toward flatter X-ray spectral slopes at fainter X-ray fluxes (e.g., Giacconi et al. 2001; Papers II–V; Tozzi et al. 2001) is seen. Clearly the optically faint and optically bright X-ray source populations have a distribution of soft and hard X-ray sources. To determine whether the optically faint sources have statistically flatter X-ray spectral slopes we used two techniques. First we stacked together the individual X-ray source observations in the same manner as in §3.3. The average band ratios from this stacking analysis, corrected for vignetting, are () for the optically faint sample and () for the optically bright sample. The flat X-ray spectral slope of the optically faint X-ray sources suggests the majority of these sources are obscured AGN; by comparison the average band ratio for the luminous NLAGN is (). Second we compared the band ratio distribution of the optically faint X-ray sources to the band ratio distribution of the optically bright X-ray sources (see Figure 9). It is clear from this plot that there is a larger fraction of optically faint sources with flat X-ray spectral slopes than found in the optically bright X-ray source population. The K-S test shows that these band ratio distributions are distinguishable at the 99.4% significance level. Assuming the underlying emission is an unabsorbed power-law source with , the average band ratio of the optically faint X-ray sources corresponds to an intrinsic absorption column density at (see §6.2) of cm. Although it is probable that the majority of these sources are NLAGN, without optical spectroscopic observations we cannot distinguish between NLAGN and other X-ray sources that can have flat X-ray spectral slopes (e.g., BALQSOs and other obscured Type 1 AGN).
Without high signal-to-noise X-ray spectral analysis we cannot directly show that the flattening of the X-ray spectral slopes in the optically faint X-ray source population is due to absorption. While in principle the signal-to-noise ratio of the X-ray emission from the stacked optically faint sources is high enough to allow spectral analysis, the probable broad range of source redshifts (see §6.2) will smear out the signature of absorption and other X-ray spectral features (e.g., iron K lines). We also note that when determining the average band ratios we have not made -corrections to the X-ray emission. As the effect of
![[Uncaptioned image]](/html/astro-ph/0107450/assets/x8.png)
X-ray band ratio, defined as the ratio of hard-band to soft-band counts, versus soft-band count rate. The open circles are the optically faint sources, the filled circles are the optically bright sources, the filled triangles are the BLAGN sources, and the filled squares are the luminous NLAGN. The large stars show the average band ratios for different soft-band count rates derived from stacking analyses of the optically faint X-ray sources (compare to Figure 12 in Paper V). The error bars on each stacked band ratio show the average size of the errors for a source of the given soft-band count rate; to reduce symbol crowding individual error bars have not been plotted. The equivalent photon indices () are shown on the left-hand side of the figure, and the equivalent column densities () for a = 2.0 power-law source at are shown on the right-hand side of the figure. These values were determined using the AO2 version of pimms (Mukai 2000). A trend toward flatter X-ray spectral slopes for fainter soft-band fluxes is seen (compare to Paper V).
redshifting sources of similar absorbing column densities leads to steeper X-ray spectral slopes at higher redshift, the probable higher redshifts of the optically faint X-ray sources (see §6.2) suggests that their intrinsic absorbing column densities are considerably higher than those found for the luminous NLAGN. A more detailed comparison is difficult as Chandra is more sensitive to absorbed sources at high redshift than at low redshift, and therefore poorly understood selection effects would also need to be considered.
4.4 X-ray variability
Another key signature of AGN activity is X-ray variability on timescales of minutes to years (e.g., Mushotzky, Done, & Pounds 1993). As this study concerns several observations taken over a 16-month period (see Paper V for observation dates and exposure times), we can test whether these sources show evidence for X-ray variability. A useful tool for detecting X-ray variability is the K-S test (see Paper IV). Variability was assessed in all the X-ray bands. We guarded against false variability by fitting a constant model to the data points of each source and accepting only those sources where the fit is rejected with 90% confidence. The source event extraction radius was taken to be twice the point spread function size to ensure that all the source counts were included in the testing. To further reduce the possibility of spurious detections of variability, we only included those sources with more than 100 full-band counts and where the K-S test showed evidence for X-ray variability at the 99.5% confidence level in at least one X-ray band. We would expect 0.14 spurious detections of variability over all bands at this confidence level. Four of the nine (%) optically faint
![[Uncaptioned image]](/html/astro-ph/0107450/assets/x9.png)
X-ray band ratio distributions of (a) the optically faint sample and (b) the optically bright sample. Clearly a larger fraction of optically faint X-ray sources have flat X-ray spectral slopes. The two X-ray band ratio distributions are distinguishable according to the K-S test at the 99.4% significance level. The solid blocks show the overlaid band ratio distribution of sources without 2 -band counterparts.
X-ray sources matching this criteria showed evidence for variability (see Figure 10). The evidence for variability in all of these sources is at the 99.9% level in the soft and full bands and at the 99% level in the hard band, with the exception of CXOHDFN J123722.7+620935 which shows evidence for hard band variability at the 95.4% confidence level. Of the three sources in Figure 7b with large hard band X-ray-to-optical flux ratios (i.e., ), only CXOHDFN J123651.8+621221 does not show evidence for variability. All of the X-ray variable sources have -band counterparts and, with the exception of CXOHDFN J123722.7+620935, red optical-to-near-IR colors (i.e., ).

The K-S test is more sensitive to detecting variability in bright sources. However, since the full-band flux distributions of the optically faint and optically bright X-ray samples are statistically consistent, we can compare the fraction of variable sources in both samples using the above criteria without undue bias. Within the optically bright X-ray sample, 13 (%) of the 29 sources with more than 100 full band counts showed evidence for variability with the above criteria; we would expect 0.4 spurious detections of variability over all bands at this confidence level. All (i.e., 100%) of the BLAGN and two (%) of the six luminous NLAGN with more than 100 full band counts were found to be variable. If the BLAGN and luminous NLAGN sources are removed from the optically bright X-ray sample then 5 (%) of the 17 sources showed evidence for variability. Therefore, although the statistics are limited, the lower fraction of variable sources in the optically faint X-ray sample (i.e., %) is more consistent with the majority of the optically faint X-ray source population being luminous NLAGN rather than BLAGN. These results are in good agreement with the optical-to-near-IR color (§4.1) and X-ray band ratio analyses (§4.3).
4.5 X-ray emission from galaxy clusters
We have not yet considered the possibility that the X-ray emission from some optically faint X-ray sources is cluster emission. Clusters can have X-ray-to-optical flux ratios as large as those observed for some of our optically faint X-ray sources (e.g., Stocke et al. 1991). Furthermore, the X-ray centroids of some clusters are offset from their optical centroids which can lead to even larger apparent X-ray-to-optical flux ratios. We searched the optical images around our optically faint X-ray sources, and none of the optically faint X-ray sources reside in an obvious cluster. Furthermore, none of the optically faint X-ray sources show evidence for extended X-ray emission.666The optically faint X-ray point sources CXOHDFN J123621.9+621603, CXOHDFN J123705.1+621635, and CXOHDFN J123618.4+621551 (also a Jy radio source; see §5.1) do however lie within diffuse X-ray emission (see F.E. Bauer et al. , in preparation). Finally, the generally flat X-ray spectra of the optically faint X-ray sources are inconsistent with the soft thermal X-ray emission produced by clusters. According to the luminosity-temperature relationship for clusters (e.g., Wu, Xue, & Fang 1999), a low-redshift cluster would need to have an X-ray luminosity of erg s in order to produce emission as hard as that observed from our softest optically faint X-ray sources. However, given this luminosity, a low-redshift cluster would have an X-ray flux much larger than observed from any of our optically faint X-ray sources. A cluster at higher redshift would need an even higher temperature (due to the redshifting of the X-ray spectrum) and thus an even greater luminosity according to the luminosity-temperature relationship; there is no self-consistent solution where a cluster can give both the observed band ratio and the observed X-ray flux for an optically faint X-ray source.
4.6 X-ray emission from optically faint Galactic objects
We have only considered the possibility that our optically faint X-ray sources are extragalactic objects, as it is unlikely that the optically faint X-ray source population is significantly contaminated by Galactic objects. Considering first normal stars, only extreme M stars could have X-ray-to-optical flux ratios as large as those observed (e.g., Maccacaro et al. 1988), however the generally large band ratios of our optically faint X-ray sources are not consistent with those expected for M stars. Isolated neutron stars can have extremely large X-ray-to-optical flux ratios (e.g., Treves et al. 2000) and would appear as optically blank sources at the depth of our X-ray survey; however, we would expect only 0.1 detectable isolated neutron stars in our field (e.g., Popov et al. 2000). Due to the fact that our survey is much deeper than those performed previously, it is difficult to rule out rigorously some contamination by a new, previously unknown class of Galactic object. However, known Galactic objects with large X-ray-to-optical flux ratios and hard X-ray spectra, such as low-mass X-ray binaries and cataclysmic variables, have much lower densities on the sky than observed for our optically faint X-ray sources (e.g., Howell & Szkody 1990; van Paradijs 1995), especially given the high Galactic latitude of for our field.
5 X-ray emission from other optically faint source populations
In §4, we considered the nature of optically faint X-ray sources. In this section, we investigate the X-ray properties of two other optically faint source populations: optically faint Jy radio sources and optically faint AGN candidate sources.
5.1 X-ray emission from the optically faint Jy radio source population
There are 17 optically faint Jy radio sources lying within the region of our study (Richards et al. 1999). We found six of these sources to be positionally coincident to within 1 of optically faint X-ray sources. We ran wavdetect (Freeman et al. 2001) with a probability threshold of 10 over the positions of the undetected optically faint Jy radio sources and detected a further 3 sources, see Table 2; we would expect 0.001 spurious sources in each X-ray band at this detection threshold. Three of these nine X-ray sources have been previously reported (see Table 2; Paper I; Paper II; Paper IV), and their flat X-ray spectral slopes and/or luminous X-ray emission suggest AGN activity. Of the 6 previously unreported sources, two have flat radio spectra (VLA J123707+621408; VLA J123721+621130) suggesting AGN activity (see Table 2; Richards 1999). The radio properties of the other sources are consistent with either AGN or starburst activity. With the exception of VLA J123651+621221 and VLA J123707+621408, the X-ray detected optically faint Jy radio sources have less than 25 full band counts, limiting the scope of X-ray analysis. However, we can stack the individual detections to provide a statistical measure of the X-ray spectral slope using the stacking technique described in §3.3. Excluding the two brighter sources mentioned above (both of which have good evidence for AGN activity), the stacked band ratio of the other 7 X-ray detected sources is found to be , corresponding to . This band ratio is similar to that found for the optically faint X-ray source population (see §4.3) and suggests that the origin of the X-ray emission in the majority of the X-ray detected optically faint Jy radio sources is obscured AGN activity. This further suggests that the X-ray detected optically faint Jy radio sources are the radio-bright analogs of the optically faint X-ray source population, and slightly deeper radio observations should uncover a significanly larger fraction of the optically faint X-ray source population.
Due to the extreme faintness of optically faint Jy radio sources, little is known of their nature. Richards et al. (1999) proposed that the source population could be composed of three main source types: (1) luminous dust-enshrouded starburst systems at 1–3, (2) luminous obscured AGN at 2, or (3) extreme redshift () AGN. Sub-millimeter observations have indeed shown that a large fraction (%) of this radio population appear to host dusty starbursts at 1–3 (e.g., Barger, Cowie, & Richards 2000; Chapman et al. 2001). Our observations have shown that a large fraction (%) of the population also has detectable X-ray emission. Whilst we have shown that the majority of the X-ray detected optically faint Jy radio sources host obscured AGN activity, the detection of sub-millimeter emission in two of the X-ray detected sources (VLA J123618+621550 and VLA J123646+621448; see Barger, Cowie, & Richards 2000) raises the question as to whether the X-ray emission in these two sources is due to luminous star formation activity. The soft-band fluxes of these sources are consistent with those expected from Arp 220 (e.g., Iwasawa et al. 2001), the archetypal dusty starburst galaxy, at or from NGC 3256 (Moran, Lehnert, & Helfand 1999; Lira et al. 2001), the most X-ray luminous local starburst galaxy, at . At the millimetric redshifts of these sources ( ; VLA J123618+621550 and ; VLA J123646+621448; see Barger et al. 2000), any star formation emission at X-ray energies would have to be at least as luminous as that found in NGC 3256.
There are 8 optically faint Jy radio sources in the Richards et al. (1999) catalog with no detectable X-ray emission. We can search for evidence of X-ray emission by stacking the individual sources in the same manner as was performed for the faint X-ray detected sources above. The results of the stacking analysis are given in Table 3. A possible detection (at the 98.3% confidence level) is found in the soft-band, corresponding to an average source flux of erg cm s, assuming . Significant detections are not found in the full and hard bands, giving 3 upper limits of erg cm s and erg cm s, respectively. The detected soft-band emission may be produced by AGN activity corresponding to rest-frame 0.5–2.0 keV luminosities of erg s at and erg s at . However, a large fraction of this emission may be produced by star formation activity. This average soft band flux corresponds to that expected from Arp 220 at or NGC 3256 at ; compare to the results found by Brandt et al. (2001c, hereafter Paper VII) for Lyman-break galaxies. These redshifts bracket those found using the millimetric technique (; e.g., Chapman et al. 2001) although without deeper optical, near-IR and X-ray observations we cannot distinguish between AGN and star formation scenarios.
5.2 X-ray constraints on the optically selected AGN candidates in the HDF-N
At the X-ray flux limit of our survey, the surface density of the optically faint X-ray source population is deg. Given the number density of sources in the HDF-N (e.g., Fernández-Soto, Lanzetta, & Yahil 1999), we detect X-ray emission from % of the optically faint source population; this should be considered an upper limit as a fraction of our sources probably have . The estimated fraction of optically selected AGN within the field galaxy population ranges from at least 2–10% (e.g., Huchra & Burg 1992; Tresse et al. 1996; Ho et al. 1997; Hammer et al. 1997), suggesting that a large fraction of optically faint AGN have not yet been detected in our Chandra observation. Within the HDF-N itself, Jarvis & MacAlpine (1998) identified 12 candidate optically faint high-redshift AGN (see their Table 1) and Conti et al. (1999) identified 8 candidate optically faint moderate-redshift AGN (see their Table 4). None of these sources have been detected individually with X-ray emission (see also Paper II); however, as these sources are extremely faint [ for the Jarvis & MacAlpine (1998) sources and for the Conti et al. (1999) sources], the upper limits on their X-ray-to-optical flux ratios are still consistent with AGN activity (see Figure 7).
We can place tighter constraints on their X-ray emission properties by stacking the individual sources in the same manner as was performed for the optically faint Jy radio sources in §5.1. The results of the stacking analyses are given in Table 3.777The Conti et al. (1999) source 94 lies too close to an X-ray source to be used in the stacking analysis. We do not obtain a significant detection in any X-ray band for either of the candidate source lists. Assuming a typical AGN X-ray power-law of , the 3 soft-band upper limits are erg cm s for both the Jarvis & MacAlpine (1998) and Conti et al. (1999) candidates. We can place constraints on the average luminosity of these sources as they all have photometric redshifts in the Fernández-Soto, Lanzetta, & Yahil (1999) catalog. The average redshifts are for the Jarvis & MacAlpine (1998) sources and for the Conti et al. (1999) sources.888Two of the Jarvis & MacAlpine (1998) sources have estimated redshifts of ; omitting these sources gives . The soft-band upper limits correspond to average rest-frame 0.5–2.0 keV luminosities of erg s for the Jarvis & MacAlpine (1998) sources and erg s for the Conti et al. (1999) sources. Therefore, any AGN activity must be intrinsically weak, in agreement with the low optical luminosities of the sources (, Jarvis & MacAlpine 1998; , Conti et al. 1999; compare to Ho et al. 1997; 2001). Of course, the lack of X-ray emission is also consistent with no AGN activity in some, or all, of these objects. Significantly deeper Chandra observations ( 5 Ms) are required to distinguish between these possibilities.
6 Discussion
The X-ray-to-optical flux ratios (see §4.2) of the optically faint X-ray sources suggest the X-ray emission is due to AGN activity in the majority of cases. The red optical-to-near-IR colors (see §4.1) suggest the majority of the optically faint X-ray sources are not normal BLAGN and reside in comparitively normal galaxies that are either dust extincted and/or lie at . The flat X-ray spectral slopes (see §4.3) and comparitively low incidence of X-ray variability (see §4.4) further suggests that AGN activity is obscured in the majority of the sources. As some optically faint X-ray sources are among the brightest X-ray sources detected, an appreciable fraction of the optically faint X-ray sources could be luminous obscured QSOs.
Many X-ray background synthesis models predict a large number of luminous obscured QSOs (i.e., erg s) at high redshift (e.g., Wilman, Fabian, & Nulsen 2000; Gilli et al. 2001), and obscured QSOs are expected within the unified model for AGN (e.g., Antonucci 1993). However, the number of confirmed obscured QSOs in the local Universe is small (e.g., Halpern et al. 1999; Franceschini et al. 2000; and references therein). At higher redshifts the situation is more promising as probable obscured QSOs have been detected in the Chandra Abell 1835 and Abell 2390 cluster fields and the Chandra Deep Field surveys (Crawford et al. 2000; Fabian et al. 2000; Paper I; Cowie et al. 2001; Norman et al. 2001). With the exception of the candidate obscured QSO in the Chandra Deep Field South (Norman et al. 2001) and some of the possible obscured QSOs in the cluster fields (Crawford et al. 2000), the candidate obscured QSOs are optically faint. Therefore, if a large number of obscured QSOs exist, many are likely be found within the optically faint X-ray source population. If the origin of the obscuration in these sources is absorption from gas and dust, they should produce powerful infrared emission and may contribute significantly to the infrared background radiation (e.g., Puget et al. 1996; Schlegel et al. 1998).
In this section we review the redshifts of the most intensively studied optically faint X-ray sources to date, determine the redshift range of the optically faint X-ray sources, place constraints on the fraction of obscured QSOs within the optically faint X-ray population, and estimate their infrared fluxes.
6.1 Redshifts of well-studied optically faint X-ray sources
The redshifts of optically faint X-ray sources are almost completely unknown. To date, only three optically faint X-ray sources have optical spectroscopic redshifts (CDFS J033208.3-274153 at ; CXOHDFN J123633.5+621418 at ; CXOHDFN J123642.1+621332 at ); the first source is in the Chandra Deep Field South survey (Schreier et al. 2001) and the latter two sources are within our optically faint X-ray source sample (see §3.1). The two optically faint X-ray sources with radio and sub-millimeter emission reported in §5.1 have millimetric redshifts (CXOHDFN J123618.4+621551 has and CXOHDFN J123646.1+621449 has ; see Barger et al. 2000). There are also two optically faint X-ray sources with multi-band photometric redshifts: the , (corrected for cluster lensing) source CXOU J215333.2+174211 (Cowie et al. 2001) and the , source CXOHDFN J123651.8+621221 (Dickinson 2000; Budavári et al. 2000; Paper I).999There are two ROSAT Ultra-Deep Survey sources that fall just outside our definition of an optically faint source and have ; these sources have photometric redshifts of and (Lehmann et al. 2001). The latter source is also within our optically faint X-ray sample. Both of these sources have been reported as obscured QSO candidates (Paper I; Cowie et al. 2001; Paper IV) although a photometric redshift fit for CXOHDFN J123651.8+621221 has never been published. Below we present our photometric redshift estimate of CXOHDFN J123651.8+621221 using the publicly available photometric redshift code hyperz Version 1.1 (Bolzonella, Miralles, & Pelló 2000).101010This code is available at http://webast.ast.obs-mip.fr/hyperz/.
The optical-to-near-IR photometry for CXOHDFN J123651.8+621221 was provided by M. Dickinson 2000, private communication. As CXOHDFN J123651.8+621221 is not in the Williams et al. (1996) catalog111111This source lies close to a bright optical galaxy and was discovered in the radio (Richards et al. 1999) and near-IR wavebands (Dickinson et al. 2000) before it was identified at optical wavelengths.; we determined the uncertainties in the magnitudes for each waveband from sources of similar magnitudes ( mags) in the Fernández-Soto, Lanzetta, & Yahil (1999) HDF-N source catalog. In performing the photometric redshift fitting, we used all the spectral templates provided with hyperz and allowed up to 1 mag of visual extinction. The best photometric redshift solution is found to be a young (1.4 Gyr old) elliptical galaxy at with 1 mag of visual extinction (see Figure 11); the uncertainities in the redshift determination correspond to the 90% confidence level. The fit is best constrained by the 4000 Å break, which falls between the -band and -band, and the Lyman limit, which enters the band and explains the non-detection of the source in that band. Similar fits in the same redshift range, although at a lower confidence level, were found for different spectral templates and different visual extinction constraints. Assuming and the column density of
![[Uncaptioned image]](/html/astro-ph/0107450/assets/x11.png)
The best-fitting photometric redshift solution for the HDF-N optically faint source CXOHDFN J123651.8+621221 found using hyperz Version 1.1 (Bolzonella, Miralles, & Pelló 2000). The solid curve shows the best-fit galaxy model, and the filled circles show the source photometry, (provided by M. Dickinson 2000, private communication). The uncertainties in the band magnitudes are the average measured uncertainties for sources in the Fernández-Soto, Lanzetta, & Yahil (1999) HDF-N catalog with similar band magnitudes (0.1 mag). The best-fit galaxy model is a young (1.4 Gyr old) elliptical galaxy with 1 mag of extinction at ; the uncertainties in the redshift determination correspond to the 90% confidence level.
absorption given in Paper IV, CXOHDFN J123651.8+621221 would have an unabsorbed 0.5–8.0 keV rest frame luminosity of erg s, consistent with its obscured QSO status.
The redshift, -band magnitude and X-ray luminosity of CXOHDFN J123651.8+621221 are similar to those of CXOU J215333.2+174211 (Cowie et al. 2001), suggesting they are very similar objects. By comparison CDFS J033208.3–274153 (Schreier et al. 2001), CXOHDFN J123642.1+621332 (Waddington et al. 1999; Paper IV), CXOHDFN J123618.4+621551 and CXOHDFN J123646.1+621449 are less luminous at X-ray energies and, unless their X-ray emission is Compton thick, are not obscured QSOs. CXOHDFN J123633.5+621418 is a BLAGN (see §3.1), has comparitively blue colors () and a steep X-ray spectral slope typical of BLAGN (i.e., ; see Table 2). Hence, because the majority of the optically faint X-ray sources have red optical-to-near-IR colors and/or flat X-ray spectral slopes, we do not believe that CXOHDFN J123633.5+621418 is a typical optically faint X-ray source.
Based on this limited sample, two (29%) of the seven optically faint X-ray sources with redshifts are probably obscured QSOs.
6.2 Optically faint X-ray source redshift estimation
Although we do not have sufficient photometric information to determine the redshifts of the optically faint X-ray sources on a source-by-source basis, we can estimate the probable
![[Uncaptioned image]](/html/astro-ph/0107450/assets/x12.png)
Chandra source redshifts compared to the redshifts for different source types. The small dots are the Chandra sources with spectroscopic redshifts, the filled triangles are the BLAGN, the filled squares are the luminous NLAGN, the open circles are optically faint X-ray sources with spectroscopic or photometric redshifts (see §6.1), and the stars are optically faint X-ray sources with millimetric redshifts (see §5.1). The filled circles are the average spectroscopic redshifts for the Chandra sources; the width of each magnitude bin is shown as bars in the -axis direction. The crosses are the average photometric redshifts for optical sources in the HDF-N (from Fernández-Soto, Lanzetta, & Yahil 1999). The solid, long-dashed and short-dashed curves are the redshift tracks of E, Sa and Sc host galaxies. The dotted curve is the redshift track of an QSO. The galactic -corrections were taken from Poggianti (1997), and the QSO -corrections were calculated with the QSO spectrum used in Figure 6. This figure suggests that if the optically faint X-ray sources are the high-redshift analogs of the optically bright X-ray sources, the majority should lie at 1–3; compare to Figure 7 of Barger et al. (2001a).
redshift range from a comparison to the properties of the optically bright X-ray sources. In Figure 12 we have plotted the spectroscopic redshifts of the X-ray sources versus -band magnitude (79% of these sources have spectroscopic redshifts); for the non-BLAGN sources we have calculated the average redshift for each optical magnitude between and . As a comparison to these data we have plotted the average photometric redshift for optical field galaxies for each optical magnitude between and using the Fernández-Soto, Lanzetta, & Yahil (1999) database of HDF-N photometric redshifts. We have also plotted the expected redshifts for spiral and elliptical host galaxies and an normal QSO.121212 is equivalent to the classical QSO threshold of (Schmidt & Green 1983), adjusted to our assumed cosmology.
Based on our analysis in §4, we suggested that the majority of the optically faint X-ray sources are obscured AGN. The optical emission from an obscured AGN is dominated by the emission from the host galaxy and therefore has little bearing on the power of the X-ray source. However, as can be seen in Figure 12, the optically bright luminous NLAGN sources follow the track expected for an host galaxy, showing that luminous obscured AGN reside in moderately luminous host galaxies. Assuming this trend continues to fainter optical magnitudes, the range in redshifts for the majority of the optically faint X-ray source population should be 1–3. This redshift range is in agreement with the red optical-to-near-IR colors of the majority of the optically faint X-ray sources (§4.1) and the redshifts of the sources in §6.1; this analysis is similar to that performed by Barger et al. (2001a), and quantitatively similar conclusions are reached. However, CXOHDFN J123642.1+621332 lies at a substantially higher redshift and shows that there can be exceptions.
Based on a simple hierarchial cold dark matter model and using constraints from the QSO X-ray luminosity function, Haiman & Loeb (1999) predicted QSOs (i.e., erg s) at at the depth and area of our survey. Any source at would have extremely weak -band emission due to Lyman- leaving the -band and consequently very red optical-to-near-IR colors (see Figure 6); an example of this is the -band drop-out source SDSSp J104433.04–012502.2 which lies at (Fan et al. 2000) and has . We have 15 optically faint X-ray sources without -band counterparts, exactly the number of sources predicted by Haiman & Loeb (1999). While none of these sources shows evidence for shorter wavelength counterparts in the Hogg et al. (2000) , -band images or the Barger et al. (1999) and -band images, these images are not sufficiently deep enough to provide strong constraints. However, it is unlikely that all of these sources lie at based on three simple constraints. First, the optically faint source in the HDF-N itself (CXOHDFN J123651.8+621221; see §6.1) has , 0.5 mags below the 2 -band limit of the majority of our sources and would probably appear optically blank if it lay outside the HDF-N.131313We also note that the optically faint source CXOU J215333.2+174211 (Cowie et al. 2001) in the Abell 2390 lensing cluster has and would also probably appear optically blank in our survey. Although the statistics are limited, based on the area of the HDF-N itself, we would expect such sources within our whole field, very similar to the number of actual optically blank X-ray sources found. Second, the optically blank X-ray source CXOHDFN J123615.9+621516 appears to be associated with an optically faint X-ray source (see Figure 3 and §3.1). Given the low surface density of optically faint X-ray sources the probability of a chance coincidence is extremely low (%) and therefore it is likely that the optically blank X-ray source lies at the same redshift as the optically faint X-ray source and hence at . Third, K-S tests of the X-ray band ratio and full-band flux distributions give 83% and 7% probabilities, respectively, that the optically blank and optically faint distributions are consistent (see Figure 4 and Figure 9). The consistency between the X-ray band ratio distributions suggests that both source populations contain the same object types (i.e., mostly obscured AGN) whilst the lower probability of consistency for the full-band flux distribution is probably due to the fact that the optically blank X-ray sources lie at fainter X-ray fluxes (see Figure 4). This evidence suggests that the majority of the optically blank X-ray sources are the extension of the optically faint X-ray source population to fainter -band magnitudes.
6.3 Limits on the number of obscured QSOs in the optically faint X-ray source population
On the assumption that the majority of the optically faint X-ray sources are obscured AGN at 1–3, we can constrain the number of obscured QSOs by determining the minimum redshift for each optically faint X-ray source to produce a QSO luminosity in the X-ray band. For our analysis here, the adopted luminosity threshold for a QSO source is a rest-frame, full-band, unabsorbed X-ray luminosity of erg s.
In Figure 13 we show the minimum redshift distribution for all the optically faint X-ray sources to produce an unabsorbed QSO luminosity. The effect of absorption on the observed X-ray flux has been corrected for on a source-by-source basis assuming that the observed X-ray spectral slope is due to absorption of an underlying power law. The full range of minimum redshifts is broad (); see also Table 1. From this estimation there can be 8 (%) obscured QSOs with and two (%) obscured QSOs with in the optically faint sample. However, this determination was made assuming the X-ray emission is obscured but seen directly. If some of these sources have Compton-thick absorption then the observed X-ray emission will be predominantly reflected, and the intrinsic X-ray luminosity could be at least an order of magnitude higher (e.g., Bassani et al. 1999). Indeed, observations of local obscured AGN suggest that % of the sources have Compton-thick absorption (e.g., Risaliti, Maiolino, & Salvati 1999). Of the two most convincing obscured QSO candidates, IRAS 09104+4109 (Franceschini et al. 2000; Iwasawa, Fabian, & Ettori 2001) almost certainly has Compton-thick absorption, and CDF-S 202 (Norman et al. 2001) possibly has Compton-thick absorption. In Figure 13 we also show the distribution of minimum redshifts for all the optically faint sources to produce a QSO X-ray luminosity assuming that each source is Compton thick. In this determination we have simply assumed that the scattering efficiency is 10% (e.g., Bassani et al. 1999) and that the scattered emission is not itself obscured. The full range of redshifts in this scenario is . From this estimation 21 (%) of the sources could be obscured QSOs at and 9 (%) could be obscured QSOs at . If 50% of the sources have Compton-thick absorption then the fraction of obscured QSOs will be somewhere between those given for the Compton-thin and Compton-thick cases. This is in reasonable agreement with our estimation based on a small sample of 7 optically faint X-ray sources with determined redshifts (i.e., 29%; see §6.1).
Clearly a fraction of the optically faint X-ray source population are likely to be obscured QSOs. The population synthesis model of Gilli et al. (2001) predicts that obscured QSOs contribute % of the hard X-ray background. We do not find good agreement with this prediction as the optically faint X-ray source population only contributes 21% of the hard X-ray background and only a fraction of these sources are likely to be obscured QSOs. However, this 1 Ms observation has not fully resolved the hard X-ray background and the on-going optical spectroscopic identifications of the optically bright X-ray
![[Uncaptioned image]](/html/astro-ph/0107450/assets/x13.png)
The distribution of minimum redshifts for the optically faint X-ray sources required to produce a rest-frame, full-band, unabsorbed X-ray luminosity of ergs s for (a) Compton thin sources and (b) Compton thick sources; a scattering efficiency of 10% is assumed. The vertical dotted line shows the minimum redshift for an -band drop-out source.