The Luminosity Function and Surface Brightness Distribution of H I Selected Galaxies
Abstract
We measure the -band optical luminosity function (LF) for galaxies selected in a blind H i survey. The total LF of the H i selected sample is flat, with Schechter parameters mag and , in good agreement with LFs of optically selected late-type galaxies. Bivariate distribution functions of several galaxy parameters show that the H i density in the local Universe is more widely spread over galaxies of different size, central surface brightness, and luminosity than is the optical luminosity density. The number density of very low surface brightness ( ) gas-rich galaxies is considerably lower than that found in optical surveys designed to detect dim galaxies. This suggests that only a part of the population of LSB galaxies is gas rich and that the rest must be gas poor. However, we show that this gas-poor population must be cosmologically insignificant in baryon content. The contribution of gas-rich LSB galaxies ( ) to the local cosmological gas and luminosity density is modest ( and per cent respectively); their contribution to is not well-determined, but probably 11 per cent. These values are in excellent agreement with the low redshift results from the Hubble Deep Field.
keywords:
galaxies: luminosity function, mass function – galaxies: statistics – galaxies: fundamental parameters1 Introduction
Understanding galaxy evolution requires well-determined local benchmarks. One of the most fundamental of these is the field galaxy luminosity function, the shape of which should be predicted by any reliable galaxy formation theory. In principle, the shape of the luminosity function is related to the power spectrum of primordial density fluctuations and complex processes such as gas cooling, star formation and feedback to the interstellar medium as well as the behaviour of dark matter as it undergoes gravitational collapse and merging in galaxy halos (see e.g., Cole et al. 2000 for a recent review). Reference points in the local Universe will help in developing a full understanding of these processes. Another motive for determination of the local luminosity function, is the problem of the faint blue galaxies. The normalisation of the luminosity function seems to be too low to be reconciled with no-evolution predictions based on intermediate redshift () surveys (Ellis 1997; Broadhurst, Ellis & Shanks 1988; Koo & Kron 1992), but to quantify this problem a reliable measurement of the faint end slope is essential.
The last few years have seen a proliferation of published luminosity functions from optical redshift surveys of the local () Universe (see e.g., Zucca et al. 1997; Ratcliffe et al. 1998; Folkes et al. 1999; and Blanton et al. (2001) for some recent examples). These surveys systematically produce samples of galaxies and are able to determine the luminosity function down to absolute magnitude limits of . However, considerable uncertainty remains about the exact shape and normalisation of the luminosity function. Especially the faint-end slope for the dwarf galaxies () is practically unconstrained (see discussion in Driver & Phillipps 1996).
A potential cause of the uncertainty in low galaxy counts is the surface brightness selection effect (Disney 1976; Disney & Phillips 1987). Sprayberry et al. (1997) specifically searched for the low surface brightness (LSB) galaxies in the APM survey (Impey et al. 1996), and concluded that including LSB galaxies in the low census steepens the field luminosity function, but still does not close the gap between number counts at moderate redshift and .
The discussion on LSB galaxies ties in directly with another important benchmark at : the distribution function of optical surface brightnesses. Based on photometry of 36 nearby spiral and S0 galaxies, Freeman (1970) concluded that per cent have a band central surface brightness in the range . The eight deviant galaxies consisted of one dwarf irregular LSB galaxy () and seven brighter galaxies of various morphological type. The majority opinion at the present moment seems to be that the distribution function is flat (McGaugh 1996; de Jong 1996; Dalcanton et al. 1997b; O’Neil & Bothun 2000; de Jong & Lacey 2000; Blanton et al. 2001; Cross et al. 2001), although Sprayberry et al. (1996) found a distribution function that peaks at . Tully & Verheijen (1997) have a dissenting view and present evidence for bimodality in the distribution of near-infrared surface brightnesses in the Ursa Major Cluster. This view has been contested by Bell & de Blok (2000) who claim that the data set is insufficient to establish the presence of a bimodal surface brightness distribution.
New insight in both issues can be obtained by selecting galaxies via a method that is free from optical selection effects. In this paper we measure for the first time the optical luminosity function and surface brightness distribution function of H i selected galaxies. This sample is the result of the Arecibo H i Strip Survey, a blind strip survey in the 21cm line. We stress that this sample is small (60 members) compared to those produced by modern redshift surveys, and large statistical errors are therefore unavoidable. This work should be regarded as the first step toward measuring these functions for H i selected galaxy samples. Much larger galaxy samples will be available in the near future (e.g. HIPASS, Staveley-Smith et al. 1996), and the measurements of optical luminosity functions, surface brightness functions and bivariate distributions will greatly improve.
We organise this paper as follows. First, in section 2, we briefly describe the sample. In section 3 we present the optical luminosity function of this H i selected galaxy sample, and discuss the distribution of luminosity density and H i gas density among different galaxies. In section 4 the surface brightness distribution function and the contribution of LSB galaxies to the mass density of the local Universe are discussed. Bivariate distribution functions of various galaxy parameters are presented in section 5. Finally, in section 6 we summarise the conclusions. Throughout this paper we use for calculating distance dependent quantities.
2 The data
The sample of galaxies used here to measure distribution functions of optical luminosity and central surface brightness is selected in the 21cm line, and it is therefore free from selection effects related to optical surface brightness. The sample is the result of the Arecibo H i Strip Survey (AHiSS), a blind extragalactic H i survey consisting of two strips of constant declination, together covering approximately 65 square degrees of sky over a depth of . The limiting column density for the central 3 arcmin wide strip (corresponding to the main beam of the Arecibo Telescope) was () per resolution element of 16 for gas filling the telescope beam. This sensitivity is unmatched by any other blind H i survey to date. Low resolution 21cm aperture synthesis observations of the AHiSS sample of 66 galaxies have been obtained with the NRAO Very Large Array (VLA). Details of the Arecibo survey and the VLA observations are described by Sorar (1994) and Zwaan et al. (1997).
Optical observations were confined to sources at Galactic latitudes to avoid severe Galactic extinction and confusion of foreground stars. This reduces the total number of accessible sources to 61. The optical data were obtained at the Isaac Newton Telescope of the Observatorio del Roqué de los Muchachos on the island of La Palma, Spain. The data collection was spread over four observing runs during the period 1995 October through 1997 March. Images were recorded at the Prime Focus camera with a thinned Tektronix pixel CCD. The Tektronix CCD has 24 m pixels, which give an image scale of 0.59′′ per pixel at prime focus. All images were taken through a standard Harris filter. Flatfields were taken in the twilight, and the residual background variations after flatfielding are typically per cent of the sky level. The photometric calibration was done by observing standard stars at several airmasses each night, and is accurate to 0.13 mag.
Total galaxy magnitudes were determined using aperture photometry on the reduced images. Correct aperture sizes were found using a curve-of-growth algorithm: aperture photometry was performed at a series of aperture radii, increasing in 1 arcsecond steps, until the integrated magnitudes levelled out at an asymptotic maximum. The first radius at which this maximum (brightest) integrated magnitude was reached was then chosen as the correct aperture size. Central surface brightnesses and disk scale lengths were determined by fitting exponential disk models to the azimuthically averaged radial surface brightness profiles. The centres of the galaxies were usually taken to be the maximum of the light distribution. Strong central concentrations were excluded from the exponential fits. The data for galaxy A44 turned out to be not usable, which leaves us with a total number of 60 galaxies for our analysis.
We have chosen to apply the internal extinction correction proposed by Tully et al. (1998) which is a function of absolute magnitude. The extinction correction can be written as , where . Since for our data set the central surface brightness is well correlated with absolute luminosity, the extinction correction implies a low correction for LSB galaxies and a higher correction for HSB galaxies. Galactic extinction corrections have been applied using the reddening maps of Burstein & Heiles (1982) and assuming that .
3 Luminosity functions
The luminosity function (LF) of galaxies is defined as the number of galaxies per cubic Mpc in a luminosity interval centred at magnitude . The interval is generally taken to be 1 mag. The most used parameterisation of the luminosity function is the Schechter (1976) function defined by
| (1) |
where is the faint-end slope, is the normalisation factor and is the characteristic absolute magnitude that defines the boundary between the exponential and power-law part.
3.1 Methods
Many different galaxy luminosity function estimators can be found in the literature. In Zwaan et al. (1997) we discuss different luminosity function estimators and conclude that the method is the preferred way to determine mass functions and luminosity functions for our sample. For this sample, we demonstrated that the determination of the H i mass function with the method is not very sensitive to density fluctuations due to large scale structure. The method consists of summing the reciprocals of the volumes corresponding to the maximum distances at which galaxies could be seen and still remain within the sample. Summing these values per bin in H i mass or absolute magnitude immediately gives the binned H i mass function or optical luminosity function. The advantages of the method are that it is automatically normalised and non-parametric; it recovers the amplitude and the shape of the luminosity function simultaneously, without using the Schechter function as an assumption about the intrinsic shape. An overview of the different galaxy luminosity function estimators is given by Willmer (1997), who tests the validity of different methods by means of Monte-Carlo simulations. Careful examination of his tables shows that the method (with binning in magnitudes) recovers the input luminosity function satisfactorily, and equally well as the more conventional parameterised maximum likelihood method (Sandage, Tammann & Yahil 1979) or the Stepwise Maximum Likelihood Method (SWLM, Efstathiou, Ellis & Peterson 1988). Supported by this, we choose to apply the method to evaluate the optical luminosity function. The details of the determination of the values of are described in Zwaan et al. (1997) and will not be repeated here. Note that the values of are derived from the original Arecibo H i survey parameters and are independent from the optical data.
3.2 Results
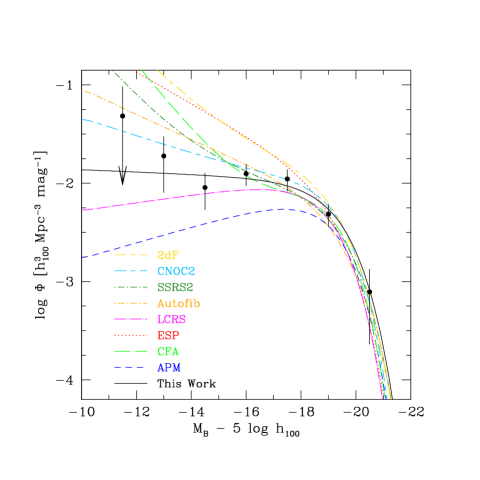
The resulting luminosity function is shown in Fig. 1 as solid dots with 1 errorbars. The data are binned per 1.5 mag in order to obtain a reasonable number of galaxies per bin, but scaled in such a way that represents number densities per magnitude bins. Furthermore, the data are multiplied by a factor 66/60 to account for the galaxies for which no optical information is available. To enable direct comparison with published luminosity functions, we choose to use the absolute magnitudes uncorrected for opacity effects in the galactic disk (see Leroy & Portilla 1998 for a discussion on the influence of optical depth effects on the shape of the luminosity function). The line indicates the best fit Schechter function which is determined by minimising for the expected number of galaxies per bin. The uncertainties in the best fit are indicated in the inset that shows the 1 and 2 error contours of the fit for and fitted jointly. As is usually the case in these fits, the parameters and are strongly correlated in the sense that steeper faint end slopes imply brighter values of . The best fit Schechter parameters are found to be , mag and , where the quoted errors are 1 one-parameter uncertainties. The uncertainties given here are solely the result of counting statistics, and therefore may understate the true uncertainties. Measurement errors in the parameters that define and measurement errors in also contribute to the uncertainties, but these are relatively small compared to the Poisson errors for this small sample.

The parameterisation in the form of a Schechter function is a satisfactory representation of luminosity function of the AHiSS galaxies. However, due to the small number of galaxies in the low luminosity bins, the value of the faint end slope is poorly constrained. Especially for magnitudes fainter than , the slope of the LF is almost unconstrained. There is no need for a modification of the LF, such as the Schechter function plus a power law, proposed by Sprayberry et al. (1997) for his sample of LSB galaxies, although our present sample does not rule out this extra component. We note that our measured LF parameters are in excellent agreement with those from a preliminary analysis of the HIPASS survey (Marquarding 2000).
3.3 Comparison with optical determinations of the LF
It is interesting to compare the luminosity function for H i selected galaxies to luminosity functions of optically selected galaxies. Recently, there has been much interest in steep faint-end slopes of the luminosity function, and the galaxies responsible for this steep part 1) are found to be of late morphological type (e.g., Marzke et al. 1998), 2) show strong emission lines indicative of active star formation (e.g., Zucca et al. 1997), and 3) have blue colours (Lin et al. 1999). These are the types of galaxies that are expected to contain high fractions of H i, and therefore should be represented in the AHiSS sample.
A vast number of luminosity functions based on optical redshift redshift surveys, is available in the literature. All these surveys contain typically a few thousand galaxies. When making a comparison with our luminosity function for H i selected galaxies, we will concentrate on those studies which have made a specific distinction between late and early type galaxies, or star forming and quiescent galaxies. We consider: the Stromlo-APM redshift survey (APM, Loveday et al. 1992), the Center for Astrophysics redshift survey (CfA, Marzke et al. 1994), the ESO Slice Project (ESP, Zucca at al. 1997), the Las Campanas Redshift Survey (LCRS, Lin et al. 1996), the Autofib Redshift Survey (ARS, Heyl et al. 1997), the Second Southern Sky Redshift Survey (SSRS2, Marzke et al. 1998), the CNOC Field Galaxy Redshift Survey (CNOC2, Lin et al. 1999) and preliminary results from the 2dF survey (Folkes et al. 1999).
Table 1 summarises the Schechter parameters of ‘late type’ luminosity functions of these surveys. In Fig. 2 these functions are represented, together with our measured points and the best fit Schechter function. The functions have been transformed to the filter using the conversions for the CfA, for the LCRS, and , and all functions are recalculated for .
| Sample | Selection | a | b | ||
| AHiSS | H i selected | 11.5 | |||
| APM (Loveday et al. 1992) | Sp/Irr | 10 | 6.7 | ||
| CfA (Marzke et al. 1994) | Sa-Sb | 8.7 | 8.9 | ||
| Sc-Sd | 4.4 | ||||
| Sm-Im | 0.6 | ||||
| ESP (Zucca et al. 1997) | Emission lines | 10 | 11.4 | ||
| LCRS (Lin et al. 1997) | Å | 13 | 7.7 | ||
| Autofib (Heyl et al. 1997) | Sab | 2.19 | 8.4 | ||
| Sbc | 2.80 | ||||
| Scd | 3.01 | ||||
| Sdm | 0.50 | ||||
| SSRS2 (Marzke et al. 1998) | Spirals | 8.0 | 9.2 | ||
| Irr/Pec | 0.2 | ||||
| CNOC2 (Lin et al. 1999)e | Intermediate type | 9.0 | 11.1 | ||
| Late type | 7.2 | ||||
| 2dF (Folkes et al. 1999) | Sab | 3.9 | 14.0 | ||
| Sbc | 5.3 | ||||
| Scd | 6.5 | ||||
| Sdm-Im | 2.1 |
-
a Units are
-
b Units are
-
c
-
d
-
e Values extrapolated to
The direct comparison of these luminosity functions is rather naive for a number of reasons. Firstly, different optical wave bands have been used in the selection of these galaxies. This effect can be corrected for by applying a magnitude correction, but this is most certainly a oversimplification of the problem. The use of different wave bands does not only have an influence on the luminosity of the selected galaxies but surely also on the morphological classifications. Secondly, the separation between late and early type galaxies has been made in different ways for each sample. In the CfA sample a detailed separation between morphological types has been made on the basis of the galaxies’ appearances on Palomar Sky Survey. Also the SSRS2 and the APM samples have been classified by visual inspection. The CNOC2 data is split into different populations using colour information of the galaxies. For the 2dF and Autofib surveys spectral information has been used to make the classifications. The selection criteria for the ESP and the LCRS samples has been the occurrence of emission lines in the spectra. In the LCRS sample a distinction has been made on basis of the criterion of [Oii] Å, in the EPS sample the selection was simply based on the detection the [Oii] line.
With these restrictions in mind, we can compare the different luminosity functions for optically selected galaxies with H i selected galaxies. What is particularly striking is that the values of the faint-end slope span a wide range from for the APM survey to for the ESP and 2dF surveys. Even for surveys that use comparable methods for classifying their different galaxy population, the differences in faint-end slope can be large. Evidently, the shape of the luminosity distribution of late type galaxies is still ill-constrained. On the other hand, the normalisation and the value that defines the knee are quite similar for all surveys; all functions cross approximately the same point at . The luminosity function for the AHiSS falls in between those of the optical samples. We therefore conclude that our estimate of the luminosity function is in good agreement with that of optically selected samples. Furthermore, there is no new population selected by H i surveys that adds significantly to the galaxy populations identified through optical surveys.
3.4 Luminosity density of gas-rich galaxies
A more fundamental parameter is the luminosity density, the integrated light from the whole population of galaxies. As is discussed by Lilly et al. (1996), this parameter is in principle less dependent on the details of galaxy evolution than the luminosity function. The integral luminosity density of late type galaxies can be determined by integrating the Schechter luminosity function weighted by luminosity, which gives , where is the Euler gamma function. The values of for late-type galaxies as determined by the different optical surveys is given in the last column of Table 1. It is remarkable that all values of are within from the value determined from the AHiSS. A notable exception is the 2dF survey that finds a value 60 per cent higher than the mean of the other surveys. Folkes et al. (1999) note that the 2dF results are preliminary, and that corrections for completeness, clustering, and Malmquist-bias have not been applied yet. It remains to be seen whether the final 2dF results will remain in excess of the AHiSS estimate of . A preliminary result from the SDSS (Blanton et al. 2001) has a substantially higher optical luminosity density than other recent surveys, but this increase appears to arise in a their photometric evaluation of each galaxy’s luminosity rather than an increase in the number density of objects.
The mean value of of all optically selected late-type galaxy samples is , while that for the AHiSS sample is . This latter value translates to , using the conversion of Lilly et al. (1996). This is approximately 50 per cent of the integral luminosity density of the local Universe as measured by the most recent optical redshift surveys using isophotal magnitudes (Folkes et al. 1999, Blanton et al. 2001). Blanton et al. (2001) find that increases significantly if extrapolated magnitudes are used.
3.5 Luminosity and H i mass distributions for different morphological types
A more detailed view of the relative importance of different morphological types to the H i and luminosity density can be made be transforming luminosity functions into H i mass functions, assuming correlations between H i mass and optical luminosity. Rao & Briggs (1993) used this method to determine the H i mass function and based on at that time available luminosity functions. They showed that by adopting the relation between H i mass and optical luminosity, the H i mass function can be written as
| (2) |
where , and and are the Schechter parameters of the luminosity functions.
Here we update the calculations by Rao & Briggs (1993) with more recent luminosity function parameters, and test if the results are in agreement with our measurements. For completeness, we present all possible ways of plotting the number density, the H i density, and the luminosity density as a function of absolute magnitude and H i mass. We adopt the Marzke et al. (1998) luminosity functions for different morphological types, and we fit linear regression lines to vs. taken from the Nearby Galaxy Catalog (Tully 1988) to find the values of and .
Fig. 3 shows the results. The solid grey lines are for all galaxy types, the black dashed lines are for spirals, the grey dashed lines for E and S0 types, and the grey dotted line for Irr/Pec types. The thin parts of each line are extrapolations beyond the confidence levels set by Marzke et al. (1998). The solid points plus errorbars are different representations of the AHiSS data. The results are basically the same as what Rao & Briggs (1993) found. We show here that the optical luminosity functions, combined with conversion factors from to , give excellent fits to our data. The H i density distribution matches the converted luminosity functions for all galaxy types summed, and the luminosity distribution is fitted satisfactorily with spiral and irregular population. It is no surprise that the luminosity density from ellipticals exceeds the measured values from the AHiSS, since these objects are not selected by H i surveys. This is especially clear in the middle right panel.
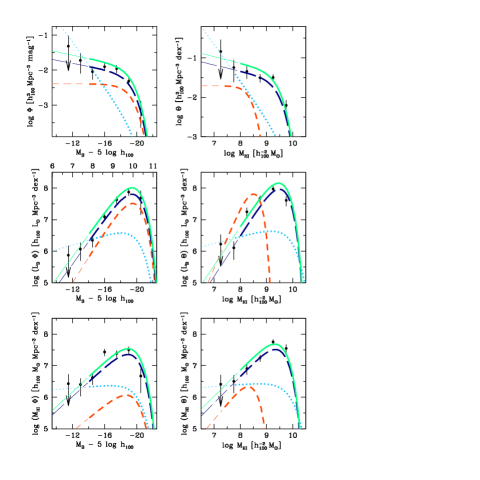
The integral H i density can be determined from a optical luminosity functions via
| (3) |
If we apply this to our adopted luminosity functions we find that spirals make up 62 per cent of the H i gas density, Irr and Pec types contribute 35 per cent, and E and S0 types only 3 per cent. Natarajan & Pettini (1997) apply this same method to measurements of the luminosity function at higher redshift in order to chart the evolution of the cosmic gas content between and . The viability of this result is unclear since the amount of evolution of the ratio of galaxies is presently unknown. Future deep H i surveys at redshifts are required to constrain the evolution.
4 Contribution of LSB galaxies to the cosmic mass budget
More than two decades after the seminal paper by Disney (1976) who defined the potential selection effects against LSB galaxies, the debate on the cosmological significance of LSB galaxies is still open. The AHiSS sample, which is not biased by the sky background, makes a valuable contribution to the discussion of the cosmological significance of LSB galaxies.
4.1 The surface brightness distribution function
The bottom panel of Fig. 4 shows a histogram of the distribution of -band surface brightnesses for the AHiSS galaxies. These surface brightnesses are corrected for dust extinction following the formalism described by Tully et al. (1998). The unshaded histogram shows the distribution for the full set of AHiSS galaxies, and the grey histograms show the distribution for the subset of AHiSS galaxies with inclinations for which the corrections to face-on values are modest. The galaxies with high inclinations () do not appear from their optical images to be very low surface brightness: they often exhibit bright central condensations and strong dust lanes, both features not normally found in extreme LSB galaxies (see McGaugh, Schombert, & Bothun 1995). It therefore seems possible that the true face-on surface brightness of these disks is brighter than those given by either the Tully et al. (1998) prescription or the assumption that the disks are fully transparent.
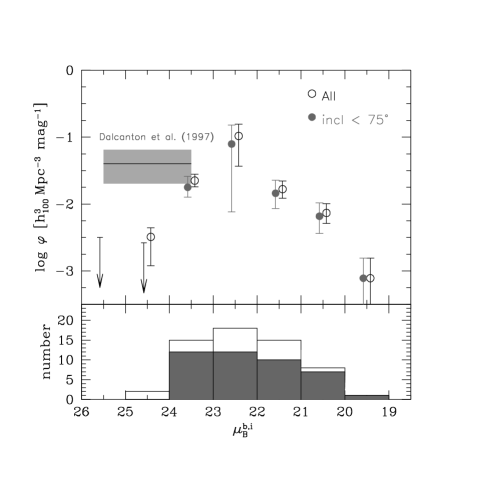
The top panel of Fig. 4 shows the volume-corrected surface brightness distribution function of AHiSS galaxies. This function is determined by summing values of per 1 mag bins of surface brightness. The errorbars indicate 68 per cent confidence levels and are determined from 100 bootstrap re-sample realizations of the data. The hollow symbols show the distribution for the complete set of AHiSS galaxies, and the solid symbols are limited to those AHiSS galaxies with . Note that the distribution function resembles the one found by Sprayberry et al. (1996) based on the APM survey.
4.2 A cutoff in surface brightness?
As Fig. 4 shows, the AHiSS detected no galaxies with reliably determined face-on central surface brightnesses fainter than . Even among the highly inclined galaxies with large (and possibly unreliable) corrections to face-on values, there are no galaxies with . The statistical significance of this results depends on the assumptions we make about the detectability of very LSB systems. We can make an estimate by calculating the average value of for the different surface brightness bins. We find that is mildly correlated with : dimmer galaxies can on average be detected over smaller volumes. This correlation arises because decreasing surface brightness correlates with decreasing total H i mass, and the sample selection is based on H i flux. If we extrapolate the correlation to the surface brightness bins in which we have no detections, we find that would be for the bin, and for the bin. The probability of finding objects when the mean is , is given by the Poisson distribution: The mean number of detected objects per mag is given by , where is the space density of objects as a function of surface brightness. Hence, the probability of finding zero sources in one bin is A 95 per cent confidence upper limit to can now be expressed as This equation is used for the upper limits that are indicated by arrows in Fig. 4.
This absence of extreme LSB galaxies suggests two things. First, the space density of massive, gas-rich, extremely LSB disks such as Malin 1 (Bothun et al. 1987) must be low, as previously shown by e.g., Briggs (1990, 1997), Driver & Cross (2000) and Blanton et al. (2001). Such a disk would have been easily detectable to the limit of 7500 of the AHiSS, so they must be intrinsically less common on average than 1 per (95 per cent confidence level, using the Poisson statistics). Second, optical surveys for LSB galaxies (Sprayberry et al. 1996; Dalcanton et al. 1997b; O’Neil et al. 1997) systematically find galaxies at lower surface brightnesses than , so there must be some reason why the present H i survey fails to detect any.
One possibility is that such galaxies have detectable amounts of neutral hydrogen but are extremely rare, so that it would not be expected to find one in the AHiSS search volume. Apart from a few special objects like Malin 1, this seems unlikely because optical surveys find these objects in significant numbers despite the relatively small volume limits imposed by optical surface brightness selection effects (McGaugh 1996). Specifically, Dalcanton et al. (1997b) find that the number density of galaxies with -band central surface brightnesses in the range is comparable to the number density of normal galaxies. For reference, we have indicated this estimated with a shaded box in Fig. 4, where we have adopted , a typical value for LSB galaxies (de Blok, van der Hulst & Bothun 1995).
The other possibility is that a significant number of galaxies exist in the AHiSS search volume with optical surface brightnesses , but that they do not contain enough H i to be detected by the AHiSS. This seems considerably more likely, as there are two ways such a population could come to exist: First, these very low density systems could have formed a first generation of stars and then either lost most of their remaining gas through supernova-driven winds (Babul & Rees 1992; Babul & Ferguson 1996) or consumed all their gas in vigorous star formation and since then faded to become LSB disks (Bell et al. 1999). Second, like the outskirts of normal spiral galaxies, LSB disks have low H i surface densities (de Blok, McGaugh & van der Hulst 1996), and as such, they are subject to ionization by the extragalactic UV background that produces the sharp cutoffs seen at the edges of normal spirals, for column densities below (e.g., Maloney 1993; Corbelli & Salpeter 1994; Dove & Shull 1994). Thus, much of the gas in LSB disks should become ionised, and thus be undetectable in 21cm surveys. This is consistent with the finding that no AHiSS galaxies were found with average H i column densities lower than (Zwaan et al. 1997). The average limiting column density of the AHiSS was () per 16 . Of course, for many galaxies in the AHiSS sample this number is not the minimal detectable H i column density averaged over the gas disk. Not all detected galaxies fill the beam of the Arecibo Telescope, and the velocity width of all detections is larger than 16 . A typical AHiSS galaxy fills 50 per cent of the beam and has a velocity width of 160 . With optimal smoothing applied, the minimal detectable column density of such a galaxy would be , still approximately an order of magnitude lower than the reported cut-off at in Zwaan et al. (1997). Moreover, the detection limit of very large galaxies or gas clouds that do fill the beam and have a similar velocity width of 160 would be even lower, approximately . None of these extended, low column density systems were detected.
At present there is insufficient data to distinguish between the two proposed hypotheses. Currently available studies of the stellar compositions of LSB galaxies (McGaugh & Bothun 1994; de Blok et al. 1995; Bell et al. 1999 and 2000) have concluded that gas-rich LSBs form stars slowly and continuously and therefore have fairly young stellar populations. Judging from their colours, the newly identified class of red LSB galaxies (O’Neil, Bothun & Schombert 2000) are consistent with a scenario in which they are simply a fading, passively evolving population (Bell et al. 1999). However, O’Neil et al. (2000) report that some of these galaxies have high values of , but they also note that 60 per cent of their LSB galaxy sample that was followed-up with Arecibo is undetected in H i, in sharp contrast to the high success rate in earlier LSB samples (e.g., Schneider et al. 1990). Moreover, a cross-correlation of the tables in O’Neil et al. (1997) and O’Neil et al. (2000) shows that the global colours of the undetected galaxies are on average 0.3 mag redder than the galaxies in which H i was found.
Multicolour photometry of galaxies with , in combination with deep H- imaging and deep 21cm observations should show whether the lowest surface brightness galaxies are consistent with a fading, passively evolving population.
4.3 The LSB contribution to the neutral gas density
To address the problem of the cosmological significance of gas-rich LSB galaxies in a meaningful way, an LSB galaxy should be well-defined. In the literature, different authors adopt different definitions for the critical surface brightness that separates galaxies into the ’normal’ and LSB classes. The critical value ranges from 21.65 (the ‘Freeman value’) to 23.5 . In the remainder of this paper we define an LSB galaxy as a galaxy with de-projected -band central surface brightness . This limits the LSB galaxies to those that are dimmer than the Freeman value.
The cumulative distribution of H i density among AHiSS galaxies of different surface brightness is presented in the top panel of Fig. 5. The H i density distribution can be fit satisfactorily with a Gaussian distribution. There is no fundamental physical motivation for using a Gaussian to parameterise the distribution function, but Dalcanton, Spergel & Summers (1997a) note that a galaxy formation scenario based on a log-normal distribution of the spin parameter , produces a (nearly) Gaussian function of luminosity density vs. surface brightness (see also de Jong & Lacey 2000). The inset in Fig. 5 gives and confidence ellipses for the Gaussian fits, the horizontal axis shows the centre of the distribution, the vertical axis the dispersion (). The actual fitting was done on the binned data, not on the cumulative distribution.
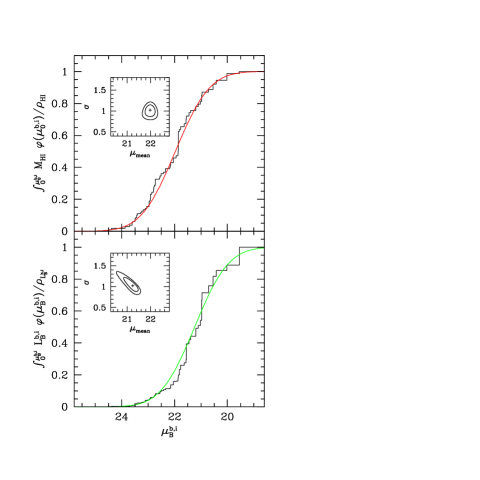
The H i mass density of the local Universe is dominated by galaxies dimmer than the Freeman (1970) value of 21.7 . The peak of the differential distribution is at 22.0 , the width is 1.0 . Low surface brightness galaxies contribute a minor fraction to the H i density, galaxies fainter than 23.0 make up per cent of the H i mass density in the local Universe (the quoted errors have been determined using bootstrap re-sampling and mark the 68 per cent confidence levels).
4.4 The LSB contribution to the luminosity density
The lower panel of Fig. 5 shows the cumulative distribution of luminosity density against surface brightnesses. The peak of the differential distribution is at 21.2 , the 1 dispersion is . This implies that while most of the H i resides in galaxies dimmer than the Freeman value, most of the light in gas-holding galaxies in the local Universe is in galaxies 0.5 mag brighter than the Freeman value. The contribution of LSB galaxies is insignificant; galaxies with constitute no more than per cent to the luminosity density.
We stress that this result only holds for gas-rich LSB galaxies. The contribution of gas-free LSB galaxies is unconstrained by our survey. Sprayberry et al. (1997) conclude that optically selected LSB galaxies contribute about 30 per cent to the field galaxy luminosity density, a result very consistent with ours, since their definition of an LSB galaxy is . De Jong & Lacey (2000) find that the luminosity density of optically selected galaxies is dominated by , which compares to 21.0 in the -band (using their value of ). They estimate that approximately 4 per cent of the luminosity density is provided by galaxies with . Driver (1999) defines a volume limited subsample of 47 galaxies at from the Hubble Deep Field and derives that LSB galaxies (mean surface brightness within the effective radius ) contribute per cent to the luminosity density. All these results are in good agreement with our estimates. This fact implies that if a population of very LSB, gas-free LSB galaxies exists (as was discussed in Section 4.2), their contribution to the luminosity density must be negligible.
4.5 The LSB contribution to
The contribution of LSB galaxies to the total mass budget of the local Universe is a longstanding question. The calculation critically depends on the assumptions one makes on the dependence of the dynamical on central surface brightness. A zeroth order approximation is to assume that is equal for all galaxies, independent of central surface brightness. This assumption follows naturally from the observation that surface brightness is not a parameter in the Tully-Fisher relation (Sprayberry et al. 1995; Zwaan et al. 1995; Verheijen 1997). Moreover, Verheijen (1997) shows that it is possible to use one model for the dark matter halo to fit the rotation curves of three galaxies, all at equal position in the Tully-Fisher relation, but with different surface brightness. In the terminology of McGaugh & de Blok (1998) this invariant would be the ‘same halo hypothesis.’ It is consistent with the idea that all galaxies of equal luminosity form in the same mass halo, but the angular momentum of an LSB disk is higher, which causes the disk to be less centrally concentrated (Dalcanton et al. 1997a). Combined with the result on the luminosity density from section 4.4, this assumption leads to the conclusion that is 5 per cent of the total (i.e., equal to the contribution to the luminosity density).
Van den Bosch & Dalcanton (2000) show that their semi-analytical galaxy models are consistent with (Zwaan et al. 1995), where is the central surface brightness in linear units. ratios are calculated via , where is the maximum rotational velocity and is a characteristic size of the dark halo, which is assumed to be directly proportional to the scale length of the optical disk. If we, like Driver (1999), adopt this relation for we find that the LSB contribution to rises to per cent. If we apply the calculations of directly to our AHiSS data set, we find per cent. Both values are in excellent agreement with the per cent that Driver finds.
At present it is unclear what the true dependence of the dynamical on optical surface brightness is. Clearly, high precision measurements of rotation curves of LSB systems are needed (see Swaters, Madore & Trewhella 2000; van den Bosch & Swaters 2000; van den Bosch et al. 2000). At the moment we adopt as a conservative estimate that gas-rich LSB galaxies contribute no more than 11 per cent to , the dynamical mass contained in galaxies.
5 Bivariate distributions
A more detailed view of the distribution of baryons among galaxies of different size and brightness can be obtained by calculating bivariate distribution functions. The importance of this way of looking at galaxy parameters is stressed by van der Kruit (1987, 1989), de Jong (1996), and most recently by de Jong & Lacey (2000) who study galaxies with types Sb to Sdm. First, the bivariate distribution function is a important constraint for galaxy formation theories, as any theory should not only produce the integrated luminosity function (and integrated distribution functions of other structural parameters), but also higher dimensional distribution functions. Second, bivariate distribution functions help to clarify the selection effects that influence the determination of (e.g.) the luminosity function.
The aim of the present work is 1) to test whether an H i selected galaxy sample yields qualitatively the same bivariate distribution function, and, 2) extend the bivariate distribution functions to the distribution of H i properties. The sample we study here is small, and, as is discussed by de Jong & Lacey (1999) and Minchin (1999), at least galaxies are required to avoid problems with small number statistics. We only intend to make qualitative comparisons and care should be taken with the interpretation of the results. We also stress that the sample that we use here might be biased against galaxies with very low values of , just like optical samples are biased to those with high values of .
5.1 Results
In Fig. 6 we present bivariate distributions of several fundamental parameters. Our aim is to show the distribution of H i mass density and luminosity density as a function of galaxy luminosity, gas mass, size, and surface brightness.
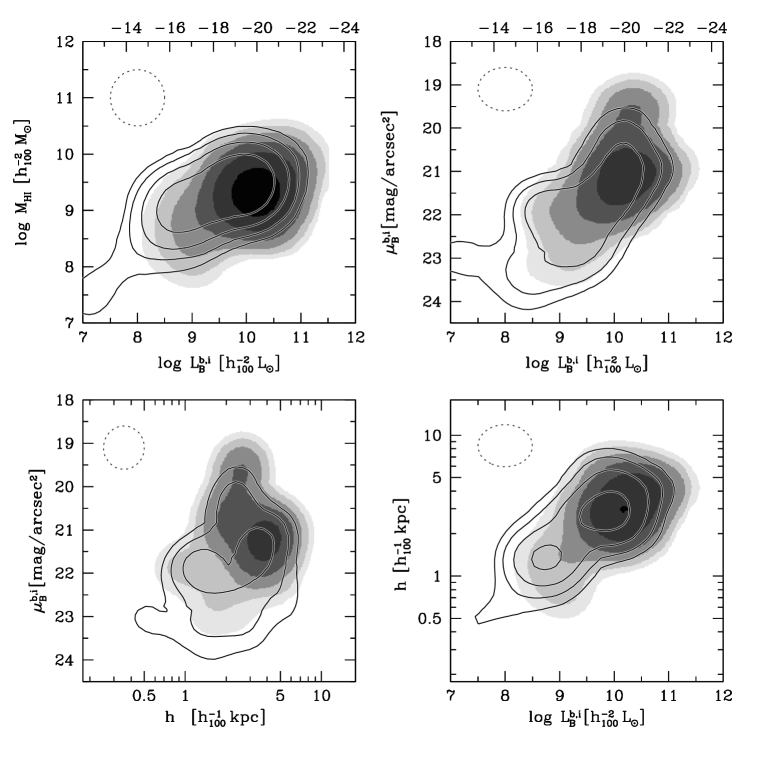
The figures are calculated by distributing values of and over a fine grid with 0.1 dex resolution for and , 0.1 mag resolution for central surface brightness , and 0.05 dex resolution for disk scale length . Next, the images were smoothed with a Gaussian filter, of which the FWHM values are indicated by the dashed ellipses in the upper left corners of each panel. The H i density distributions are shown as contours, the luminosity density distribution as grey-scales. Steps in intensity are in logarithmic intervals of 0.25 dex.
The first thing to notice is that the general trends are the same for the gas density and the luminosity density, but the maximum of the gas density is shifted towards less luminous, lower surface brightness galaxies. The second point is that the luminosity density is more strongly concentrated towards large, luminous HSB galaxies, whereas the H i density is more widely distributed.
What is obvious from the top right panel is that both the luminosity and the H i mass distribution are strongly dependent on optical surface brightness in the sense that both functions are shifted towards fainter absolute magnitudes for lower surface brightness galaxies. This fact was also observed by de Jong (1996), and the peak of the distribution, at and agrees well with his determination. The same trend is observed by Cross et al. (2001) who present a bivariate distribution function based on a a preliminary subsample of galaxies from the 2dF survey and by Blanton et al. (2001) who use a sample of galaxies from the SDSS commissioning data.
A similar effect can be seen in the lower right panel: the luminosity and the H i mass distribution are shifted towards fainter absolute magnitudes for smaller galaxies. This correlation has been studied in detail by de Jong & Lacey (2000), who discuss the predictions of hierarchical galaxy formation theories and conclude that the observed distribution is in qualitative agreement with theory, but the distribution in disk size is narrower than predicted.
6 Conclusions
We have presented several volume corrected distribution functions for galaxies that have been selected in the H i 21cm line. The conclusions are the following:
1. The luminosity function of the H i selected galaxies is in agreement with other determinations based on late-type, or star-forming galaxies. The integral luminosity density of gas-rich, late-type, or star-forming galaxies is well determined and equals . This is approximately 50 per cent of the integral luminosity density of the local Universe.
2. The contribution of low surface brightness (LSB) galaxies to the integral luminosity density and H i density is modest, 5 and 18 per cent, respectively. This in in good agreement with calculation based on optically selected galaxies. The fraction of that resides in LSB galaxies is at present not well determined, but probably less than 11 per cent.
3. We observe a lower limit to the surface brightness of gas-rich galaxies: no galaxies were found with de-projected central surface brightness in the -band. It will be interesting to test whether this result stands up with future large H i surveys, such as the HIPASS survey (Staveley-Smith et al. 1996).
4. Bivariate distributions of various fundamental galaxy parameters show that the H i density in the local Universe is more diffusely spread over galaxies with different size, surface brightness, and luminosity than the luminosity density. The luminosity density is concentrated towards bright, large, high surface brightness disks.
Acknowledgements
We thank L. Staveley-Smith, R. Webster and B. Koribalski for helpful comments. The Isaac Newton Telescope is operated by the Royal Greenwich Observatory in the Spanish Observatorio del Roque de los Muchachos of the Instituto de Astrofisica de Canarias. The National Radio Astronomy Observatory is a facility of the National Science Foundation operated under cooperative agreement by Associated Universities, Inc. The Arecibo Observatory is part of the National Astronomy and Ionosphere Center, which is operated by Cornell University under a cooperative agreement with the National Science Foundation. The National Radio Astronomy Observatory is a facility of the National Science Foundation operated under cooperative agreement by Associated Universities, Inc.
References
- [] Babul, A. & Ferguson, H. C. 1996, ApJ, 458, 100
- [] Babul, A. & Rees, M. J. 1992, MNRAS, 255, 346
- [] Bell, E. F., Bower, R. G., de Jong, R. S., Hereld, M., & Rauscher, B. J. 1999, MNRAS, 302, L55
- [] Bell, E. F., Barnaby, D., Bower, R. G., de Jong, R. S., Harper, D. A., Hereld, M., Loewenstein, R. F. & Rauscher, B. J. 2000, MNRAS, 312
- [] Bell, E. F. & de Blok, W. J. G. 2000, 311, 668
- [] Blanton, M. R., et al. 2001, AJ, 121, 2358
- [] Bothun, G. D., Impey, C. D., Malin, D. F., Mould, J. R. 1987, AJ, 94, 23
- [] Briggs, F. H. 1990, AJ, 100, 999
- [] Briggs, F. H. 1997, ApJ, 484, 618
- [] Broadhurst, T. J., Ellis, R. S., Shanks, T. 1988, MNRAS, 235, 827
- [] Burstein, D. & Heiles, C, 1982, AJ, 87, 1165
- [] Cole, S., Lacey, C. G., Baugh, C. M., & Frenk, C. S. 2000, MNRAS, 319, 168
- [] Corbelli, E. & Salpeter, E. E. 1993, ApJ, 419, 104
- [] Cross, N., et al. 2001, MNRAS, 324, 825
- [] Dalcanton, J. J., Spergel, D. N., Gunn, J. E., Schmidt, M., & Schneider, D. P. 1997b, AJ, 114, 635
- [] Dalcanton, J. J., Spergel, D. N., & Summers, F. J. 1997a, ApJ, 482, 659
- [] de Blok, W. J. G., van der Hulst, J. M., & Bothun, G. D. 1995, MNRAS, 274, 235
- [] de Blok, W. J. G., McGaugh, S. S., & van der Hulst, J. M. 1996, MNRAS, 283, 18
- [] de Jong, R. S. 1996, A&A, 313, 45
- [] de Jong, R. S. & Lacey, C. 1999, in Impey C. & Phillipps S. eds. ASP Conf. Ser. Vol. 170, The Low Surface Brightness Universe, Astron. Soc. Pac., San Francisco, p.52
- [] de Jong, R. S. & Lacey, C. 2000, ApJ, 545, 781
- [] Disney, M. J. 1976, Nature, 263, 573
- [] Disney, M. J. & Phillipps, S. 1987, Nature, 329, 203
- [] Dove, J. B. & Shull, J. M. 1994, ApJ, 423, 196
- [] Driver, S. P. & Phillipps, S. 1996, ApJ, 469, 529
- [] Driver, S. P. 1999, ApJ, 526, L69
- [] Driver, S. P. & Cross, N. 2000, in Kraan-Korteweg R.C., Hennning P.A., Andernach H., eds, ASP Conf. Ser. Vol. 218, Mapping the Hidden Universe, Astron. Soc. Pac., San Francisco, p. 309
- [] Efstathiou, G., Ellis, R. S., Peterson, B. A. 1988, MNRAS, 231, 479
- [] Ellis, R. S. 1997, ARA&A, 35, 389
- [] Fisher, J. R., Tully, R. B. 1975, A&A, 44, 151
- [] Folkes, S. et al. 1999, MNRAS, 308, 159
- [] Freeman, K. C. 1970, ApJ, 160, 811
- [] Heyl, J., Colless, M., Ellis, R. S., Broadhurst, T. 1997, ApJ, 489, 67
- [] Impey, C. D., Sprayberry, D., Irwin, M. J., Bothun, G. D. 1996, ApJS, 105, 209
- [] Koo, D. C. & Kron, R. G. 1992, ARA&A, 30, 613
- [] Leroy, P. & Portilla, M. 1998 A&A, 329, 840
- [] Lilly, S. J., Le Fevre, O., Hammer, F., Crampton, D. 1996, ApJ, 460, 1
- [] Lin, H., Kirshner, R. P., Shectman, S. A., Landy, S. D, Oemler, A., Tucker, D. L., Schechter, P. L. 1996, ApJ, 464, 60
- [] Lin, H., Yee, H. K. C., Carlberg, R. G., Morris, S. L., Sawicki, M., Patton, D. R., Wirth, G. & Shepherd, C. W. 1999, ApJ, 518, 533
- [] Loveday, J., Peterson, B. A., Efstathiou, G., Maddox, S. J. 1992, ApJ, 390, 338
- [] Maloney, P. 1993, ApJ, 414, 41
- [] Marquarding, M. 2000, MSc thesis, University of Melbourne
- [] Marzke, R. O., Geller, M. J., Huchra, J. P., Corwin, H. G. 1994, AJ, 108, 437
- [] Marzke, R. O., da Costa, L. N., Pellegrini, P. S., Willmer, C. N. A. & Geller, M. J. 1998, ApJ, 503, 617
- [] McGaugh, S. S. 1996, MNRAS, 280, 337
- [] McGaugh, S. S. & Bothun, G. D. 1994, AJ, 107, 530
- [] McGaugh, S. S. & de Blok, W. J. G. 1998, 499, 41
- [] McGaugh, S. S., Schombert, J. M. & Bothun, G. D. 1995, AJ, 109, 2019
- [] Minchin, R. F. 1999, PASA, 16, 12
- [] Natarajan, P. & Pettini, M. 1997, MNRAS, 291, 28
- [] O’Neil, K., Bothun, G. D., Schombert, J., Cornell, M. E., & Impey, C. D. 1997, AJ, 114, 2448
- [] O’Neil, K. & Bothun, G. D. 2000, ApJ, 529, 811
- [] O’Neil, K., Bothun, G. D. & Schombert, J. 2000, AJ, 119, 136
- [] Rao, S. & Briggs, F. H. 1993, ApJ, 419, 515
- [] Ratcliffe, A., Shanks, T., Parker, Q. A., & Fong, R. 1998, MNRAS, 293, 197
- [] Sandage, A., Tammann, G. A., & Yahil, A. 1979, ApJ, 232, 352
- [] Schechter, P. 1976, ApJ, 203, 297
- [] Schneider, S. E., Thuan, T. X., Magri, C., & Wadiak, J. E. 1990, ApJS, 72, 245
- [] Sprayberry, D., Bernstein, G. M., Impey, C. D., & Bothun, G. D. 1995, ApJ, 438, 72
- [] Sprayberry, D., Impey, C. D., & Irwin, M. J., 1996, ApJ, 463, 535
- [] Sprayberry, D., Impey, C. D., Irwin, M. J., & Bothun, G. D. 1997, ApJ, 482, 104
- [] Staveley-Smith, L., Wilson, W. E., Bird, T. S., Disney, M. J., Ekers, R. D., Freeman, K. C., Haynes, R. F., Sinclair, M. W., Vaile, R. A., Webster, R. L., & Wright, A. E. 1996, PASA, 13, 243
- [] Swaters, R. A., Madore, B. F., & Trewhella, M. 2000, ApJ, 531, L107
- [] Tully, R. B. 1988, Nearby Galaxies Catalog, Cambridge and New York, Cambridge University Press, 1988
- [] Tully, R. B. & Verheijen, M. A. W. 1997 ApJ, 484, 145
- [] Tully, R. B., Pierce, M. J., Huang, J., Saunders, W., Verheijen, M. A. W. & Witchalls, P. L. 1998, AJ, 115, 2264
- [] van den Bosch, F. C. & Dalcanton, J. J. 2000 ApJ, 534, 146
- [] van den Bosch, F. C., Robertson, B. E., Dalcanton, J. J., & de Blok, W. J. G. 2000, AJ, 119, 1579
- [] van den Bosch, F. C. & Swaters, R. A. 2000, astro-ph/0006048
- [] van der Kruit, P. C. 1987, A&A, 173, 59
- [] van der Kruit, P. C. 1989, in Gilmore, G., King, I. & van der Kruit, P.: The Milky Way as a Galaxy, (Geneva Observatory, Switzerland), p. 257
- [] Verheijen, M. A. W. 1997, Ph.D. Thesis, University of Groningen
- [] Willmer, C. N. A. 1997, AJ, 114, 898
- [] Zucca, E. et al. 1997, A&A 326, 477
- [] Zwaan, M. A., van der Hulst, J. M., de Blok, W.J.G., & McGaugh, S. S. 1995, MNRAS, 273, L35
- [] Zwaan, M. A., Briggs, F. H., Sprayberry, D. & Sorar, E. 1997, ApJ, 490, 173