The Angular Correlation Function of Galaxies from Early SDSS Data
Abstract
The Sloan Digital Sky Survey is one of the first multicolor photometric and spectroscopic surveys designed to measure the statistical properties of galaxies within the local Universe. In this Letter we present some of the initial results on the angular 2-point correlation function measured from the early SDSS galaxy data. The form of the correlation function, over the magnitude interval , is shown to be consistent with results from existing wide-field, photographic-based surveys and narrower CCD galaxy surveys. On scales between 1 arcminute and 1 degree the correlation function is well described by a power-law with an exponent of . The amplitude of the correlation function, within this angular interval, decreases with fainter magnitudes in good agreement with analyses from existing galaxy surveys. There is a characteristic break in the correlation function on scales of approximately 1–2 degrees. On small scales, 1’, the SDSS correlation function does not appear to be consistent with the power-law form fitted to the data.
With a data set that is less than 2% of the full SDSS survey area, we have obtained high precision measurements of the power-law angular correlation function on angular scales , which are robust to systematic uncertainties. Because of the limited area and the highly correlated nature of the error covariance matrix, these initial results do not yet provide a definitive characterization of departures from the power-law form at smaller and larger angles. In the near future, however, the area of the SDSS imaging survey will be sufficient to allow detailed analysis of the small and large scale regimes, measurements of higher-order correlations, and studies of angular clustering as a function of redshift and galaxy type.
1 Introduction
From the earliest wide field photographic-plate surveys (Shane & Wirtanen 1967) the statistics of point processes (Totsuji & Kihara 1969) have been used to characterize the angular clustering of galaxies and its evolution as a function of magnitude and redshift. One of the simplest of these statistics is the 2-point correlation function, which measures the excess of pairs of galaxies as a function of separation when compared to a random distribution. For the case of a Gaussian random field, the 2-point correlation function and its Fourier transform pair, the power spectrum, provide a complete representation of the statistical fluctuations in the distribution of galaxies. Even for the case of non-Gaussianity, the 2-point function provides a simple and important statistical test of galaxy formation models.
At bright magnitudes, the angular 2-point function has been studied from large galaxy surveys such as the Lick survey (Groth & Peebles 1977), the Automated Plate Measuring galaxy survey (APM; Maddox et al. 1990), and the Edinburgh Durham Southern Galaxy Catalogue (EDSGC; Collins et al. 1992), which cover several thousand square degrees of the sky. From these surveys the correlation function has been characterized on scales of a few tens of arcseconds to several degrees (corresponding to physical scales up to about 15 Mpc.) The correlation function, within these galaxy surveys, is consistently found to be a power law on small scales, with a break at approximately 2 degrees (for a survey with an apparent magnitude limit of ), beyond which it falls off more steeply. On scales smaller than the break, the exponent of the power law, defined by , has a value (Peebles 1980). Deeper surveys, either from photographic plates or CCD cameras, show that the power-law form of the small-scale correlation function remains with the amplitude decreasing with fainter magnitudes (Stevenson et al. 1985, Couch et al. 1993, Roche et al. 1993, Hudon & Lilly 1996, Postman et al. 1998).
While these surveys have provided a powerful description of the angular clustering of galaxies, they were either based on visual or machine scans of photographic plates or were limited to a relatively small areal coverage. In this paper, we report the first results from a series of studies of the angular clustering of galaxies from the commissioning data of the Sloan Digital Sky Survey (SDSS; Stoughton et al. 20001, York et al. 2001). This represents the first systematic, wide-field, CCD survey, specifically designed to measure the statistical properties of galaxies within the local Universe. The present results use data from 160 square degrees. In the following sections, we describe the imaging data used to construct the angular correlation function and the statistical analyses applied to these data. We compare the resultant angular correlation functions with those published in the literature and show that even with less than 2% of the final survey data, the clustering statistics are of comparable precision to those previously published.
In a series of companion papers to this short communication, led by the crucial precursor paper that provides the detailed tests for systematic effects within the photometric data (Scranton et al., 2001), we discuss a measurement of the galaxy angular power spectrum that complements our measurements by better characterizing fluctuations on large scales (Tegmark et al., 2001). An inversion of the angular correlation function and angular power spectrum to infer the 3-dimensional galaxy power spectrum is discussed by Dodelson et al. 2001. Szalay et al. (2001) use the angular galaxy distribution to constrain power spectrum parameters by a maximum-likelihood technique. A first analysis of clustering in the SDSS redshift survey appears in Zehavi et al. (2001). Future papers will examine higher order correlations in the angular and redshift data (Szapudi et al., 2001) and the impact of gravitational lensing on the galaxy angular correlation function (Jain et al., 2001).
2 The Sloan Digital Sky Survey
The Sloan Digital Sky Survey is a wide-field photometric and spectroscopic survey being undertaken by the Astrophysical Research Consortium at the Apache Point Observatory in New Mexico (York et al. 2000). The completed survey will cover approximately 10,000 square degrees. CCD imaging with the SDSS camera (Gunn et al. 1998) will image galaxies in five colors (, , , , and ; see Fukugita et al. 1996) to a detection limit,of approximately at signal-to-noise ratio. From these data, 1 million galaxies will be selected for spectroscopic followup (Strauss et al. 2001, Eisenstein et al. 2001). In this Letter, we focus on the analysis of a small subset of the final survey volume that were taken during the commissioning of the survey telescope in 1999.
The results presented here are based on two nights of imaging data (designated Runs 752 and 756) taken on the 20th and 21st of March 1999. These interleaved scans are centered on the Celestial Equator covering a stripe with declination and Right Ascension ranging from to . Within this stripe, regions of data where the imaging quality had seeing values better than (as measured in the band) were extracted and a Bayesian star-galaxy separation algorithm applied (Scranton et al. 2001, Lupton et al. 2001b). The photometric pipeline (Lupton et al. 2001a) was used to calculate magnitudes for each object based on the best-fit, PSF-convolved de Vaucouleurs or exponential model, including an arbitrary scale size and axis ratio. All magnitudes for sources within the high quality subset were corrected for Galactic extinction using the reddening maps of Schlegel, Finkbeiner & Davis (1998). In total, the final catalog contains galaxies in the apparent magnitude range of and covers an area of 160 square degrees. These data comprise a subset of the data made publicly available as part of the Early Data Release of the SDSS (Stoughton et al. 2001).
The uniqueness of the SDSS data lies in its uniformity. The angular clustering signal on large scales is small: at one degree, the amplitude of is approximately 0.006 for a magnitude range of . Systematic fluctuations of the density of galaxies due, for example, to errors in the photometric calibration as a function of position on the sky could dominate the clustering signal. By controlling these sources of systematic error we have the opportunity to measure the large scale angular clustering signal. For the current estimates of photometric uncertainties present in the SDSS photometry (%), fluctuations across the survey volume might add to the amplitude of (Nichol & Collins 1993). These values compare favorably to the errors estimated from photographic surveys. In Scranton et al. (2001) we have performed an extensive search for systematic errors from not only photometric errors, but also from stellar contamination, seeing, extinction, sky brightness, bright foreground objects, and optical distortions in the camera itself. In each case the systematic uncertainties were found to be small, and in some cases could be corrected for.
3 The Angular Correlation Function on Small and Large Scales
3.1 Angular 2pt Function Estimators
The angular correlation function, , is calculated from the estimator of Landy & Szalay (1993),
| (1) |
where , and are pair counts in bins of of the data-data, data-random and random-random points respectively. In the limit of weak clustering this statistic is the 2-point realization of a more general representation of edge-corrected n-point correlation functions (Szapudi & Szalay 1998) and has been shown to be close to a minimum variance estimator and to be robust to the number of random points (Kerscher et al. 2000).
The correlation function is calculated between 0.001 and 10 degrees with a logarithmic binning of 6 bins per decade in angle. No integral constraint correction is applied to these results as the expected magnitude of this effect is on all scales and magnitude intervals that are analyzed in this paper (Scranton et al. 2001). In the subsequent analysis we impose a lower limit of 7 arcsec to reduce artificial correlations due to the decomposition of large galaxies into multiple sources. At a redshift of (the median redshift of our brightest magnitude shell ) this corresponds to approximately kpc. Full details of the analysis of the variance and covariance in the correlation function, derived from mock catalogs generated using the PTHalos code (Scoccimarro & Sheth 2001) and from jack-knife resampling, are given in Scranton et al. (2001). These two approaches give comparable results and for simplicity we present only the mock catalog errors in the figures.
3.2 The Angular Correlation function
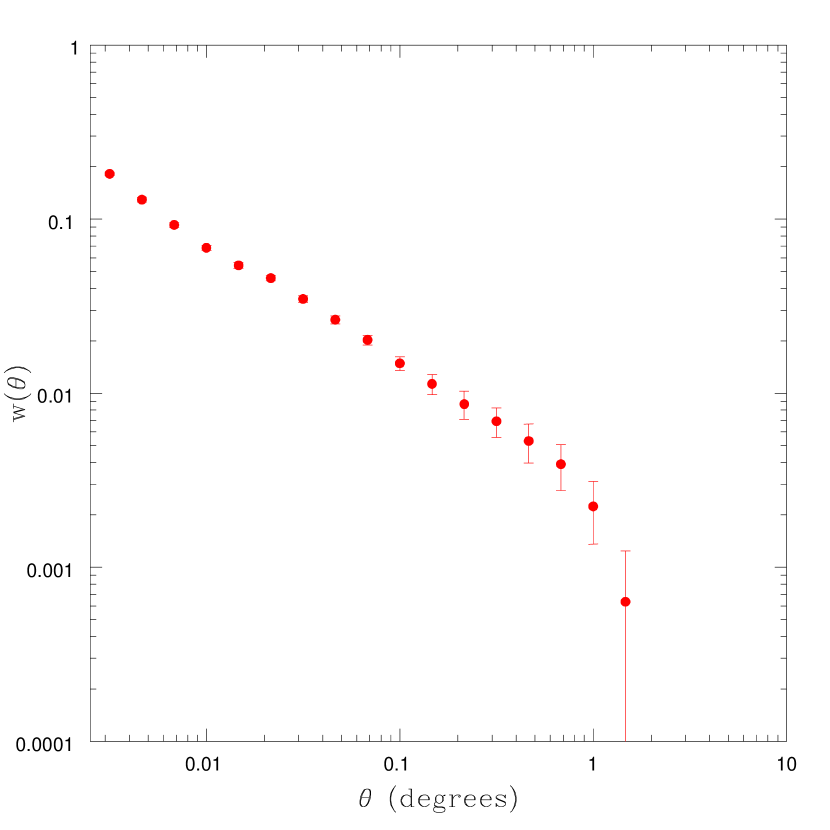
In Figure 1a we present the angular correlation function as measured from the SDSS photometric data over the magnitude interval . The form of the correlation function is consistent with that found from extant surveys such as the APM (Maddox et al. 1990) and EDSGC (Collins et al. 1992), with a power law on small scales and a break in the correlation function at approximately 2 degrees.
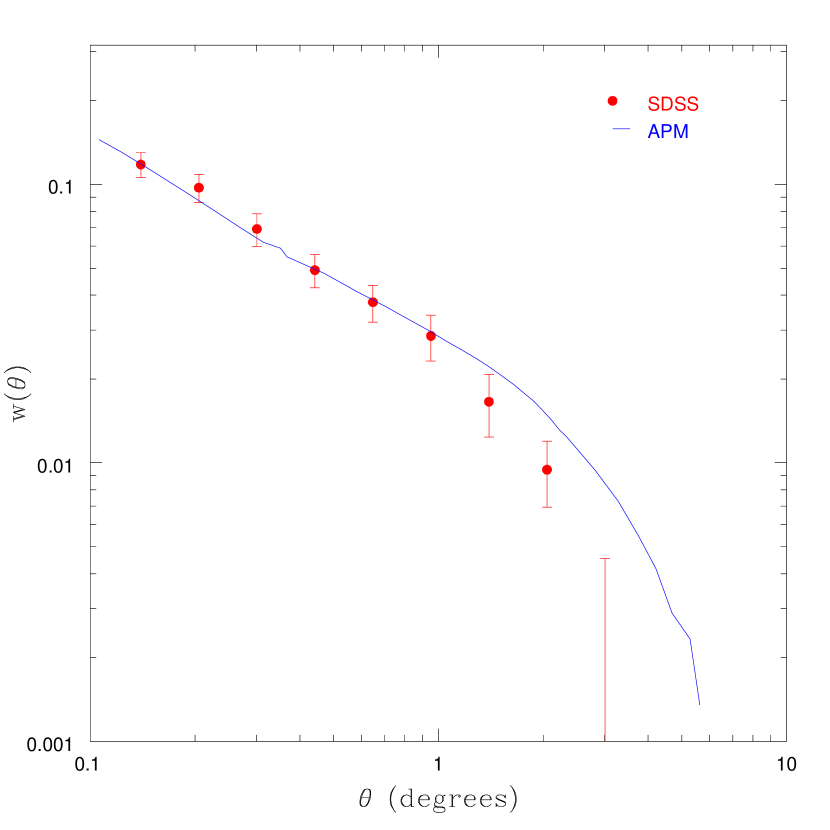
In Figure 1b we compare the measurement of the SDSS with those from the APM galaxy survey. The solid line represents the angular correlation function within the magnitude interval for the APM data and the solid circles represent the correlation function measured from the SDSS over the magnitude range . The SDSS correlation function has been scaled to that of the APM using Limber’s equation (Groth & Peebles 1977), and assuming a cosmological model with , , and a double power law correlation function. The redshift distributions used in the scaling relation are taken from those presented in Dodelson et al. (2001) for the SDSS data and the empirical redshift relation, Equation 38, in Maddox et al. (1996) for the APM data. On scales less than a degree there is good agreement between the correlation functions. On scales greater than a degree the amplitude of the SDSS subset is lower than the APM correlation function (though the effect is marginal given the relative errors in the measurements on these scales). Given the 160,000 galaxies within our brightest magnitude slice, the discrepancy between the SDSS and APM large scale correlation functions can be explained as due purely to Poisson fluctuations in the number density of galaxies.
3.3 Angular Correlation Function as a Function of Magnitude
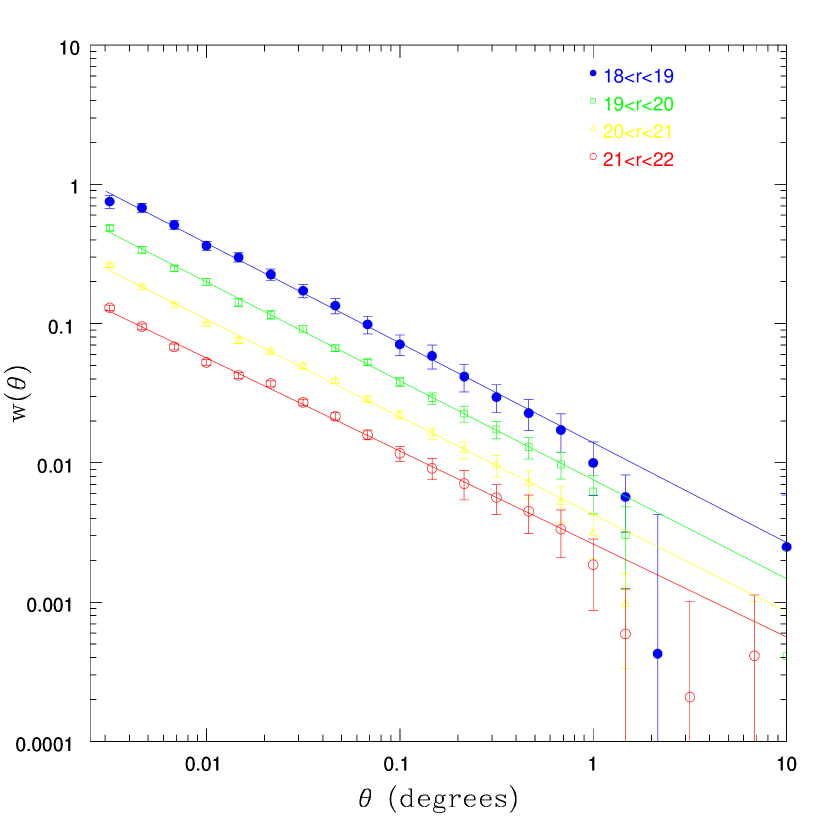
The scaling of the correlation function with limiting magnitude is given in Figure 2a for the magnitude intervals , , and . The decrease in amplitude of the correlation function with fainter magnitude slices is consistent with what we would expect from Limber’s equation (Scranton et al. 2001). The solid line shows a power law fit to these data, using the covariance matrix derived from the mock catalogs, over angular scales from 1 arcminute to 0.5 degrees. The application of the full covariance matrix to these fits is important since neighboring angular data points are highly correlated. The exponents, , and amplitudes at 1∘, Aw, of these fits are given in Table 1 together with the per degree of freedom of the fits.
Power-law Model Fits
dof
18–19
0.16
0.038
2.41
19–20
0.13
0.031
1.01
20–21
0.11
0.026
1.49
21–22
0.11
0.026
1.23
NOTES.—Power-law models were fit over a range of 1’ to 30’, using covariance matrices derived from mock catalogs described in Scranton et al. (2001).
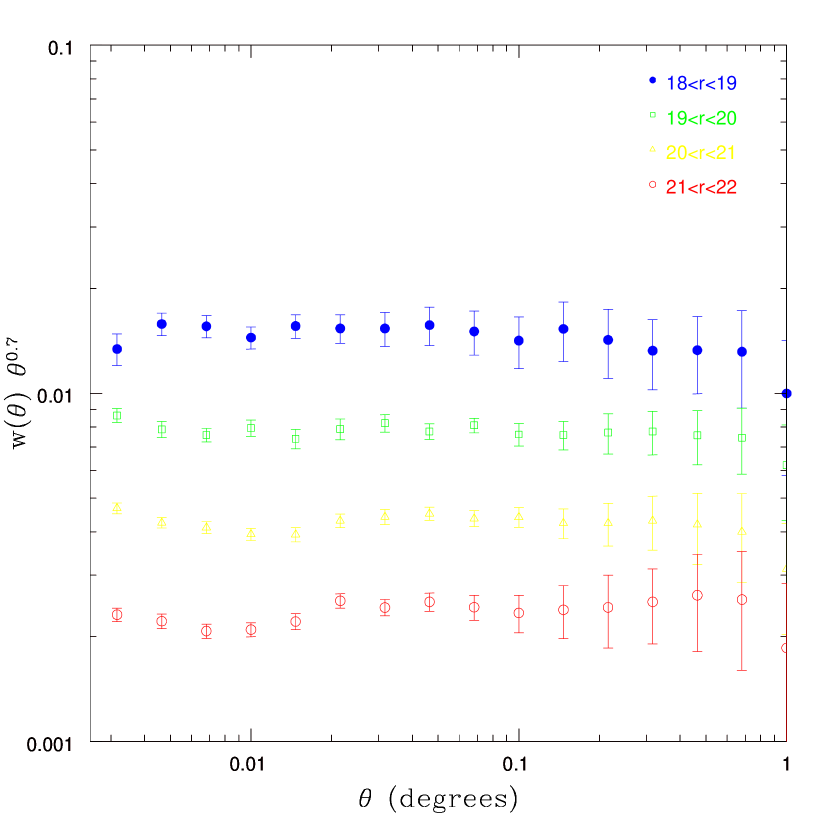
Figure 2b shows the angular correlation functions with a representative power-law model scaled out. The data for the fainter magnitude bins clearly deviate from a power-law on scales smaller than 1 arcminute ( 0.017 degrees). Power-law fits extending to scales below 1’ typically have a reduced on the order of 4 for , which indicates that such models are not acceptable fits to the data. We regard this as a preliminary result, given the difficulties in modeling the covariance matrix to the required accuracy, due to the fact that the error distribution on small scales might not be described accurately by a Gaussian, and look forward to refining this measurement as more of the SDSS survey volume is completed.
In Figure 3 we show a comparison of the amplitude of the correlation function at 1∘, , between the results from the SDSS data with those derived from earlier deep R band surveys. The data shown are derived from the surveys of Stevenson et al. (S85; 1985), Couch et al. (CJB; 1993), Roche et al. (R93; 1993), and Hudon & Lilly (HL96; 1996) and have been converted to the SDSS magnitude system. Within the uncertainties in the data the decrease in the observed correlation function amplitude as a function of magnitude is consistent with the earlier surveys. It should be noted, however, that the errors presented here for the SDSS data are derived from the full covariance matrix whereas the errors for the majority of the other surveys assume that the points are uncorrelated, which tends to cause an underestimate of the errors especially as the fractional width of the angular bins is decreased.

4 Discussion and Conclusion
The SDSS represents the first, dedicated, wide-field CCD survey undertaken for the purpose of characterizing the statistical properties and clustering of galaxies within the low redshift Universe. The photometric calibration of the imaging data is currently accurate to approximately 3% across the length of the 752 and 756 scans. On completion of the SDSS it is expected that the zero point calibration across the full survey will be accurate to %. Controlling these systematic uncertainties will be crucial to the success of the large-scale structure analyses of the SDSS.
In this short communication we report some of the first measurements of the angular clustering for these data. These initial analyses of the commissioning data taken in March 1999 show that the shape and amplitude of the correlation function are consistent with published wide-field photographic-plate based surveys (scaled to the depth of the SDSS data). This has also been shown to be true for an independent subset of the SDSS EDR when galaxies are selected to match the observed surface density of the APM survey (Gaztañaga 2001). We find that the correlation function can be well described by a power law for scales . The amplitude of the correlation function decreases as a function of magnitude which is also in good agreement with deep photographic-plate galaxy surveys and smaller CCD based photometric surveys. The consistency between this small subset of the total SDSS data set (we have analyzed less than 2% of the final areal coverage) and existing surveys is encouraging and demonstrates the impact that the full data set will have for measuring galaxy clustering at low redshift.
On small scales, arcminute, we find that the correlation function is not accurately described by the same power-law that is fitted to the larger angular data points. Whether this deviation has a physical interpretation, arises from low-level systematics present within the data or is an artifact of the covariance matrix that we apply (i.e. the covariance matrix derived from mock catalogs does not accurately describe the correlated nature of the data on small scales) cannot be determined from the current data set. As the SDSS proceeds, the improvement in the calibration of the data and the increasing amount of sky surveyed should enable these questions to be addressed.
Beyond the scope of this first generation of clustering papers, but of importance for subsequent analyses of the SDSS data, is the use of the colors to estimate the redshifts and spectral types of the galaxies. The addition of this dimension will also enable the galaxy samples to be selected based on their restframe properties. This additional control on sample selection will allow the clustering analyses to be expressed in terms of the physical properties of the galaxies rather than purely observational parameters.
References
- Collins et al. (1992) Collins, C.A., Nichol, R.C., Lumsden, S.L., 1992, MNRAS, 254, 295
- Couch et al. (1993) Couch, W.J., Jurcevic, J.S. & Boyle, B.J., 1993, MNRAS, 260,241
- Dodelson et al. (2001) Dodelson, S., et al., 2001, ApJ, submitted
- Eisenstein et al. (2001) Eisenstein, D.J., et al., 2001, AJ, submitted
- Fukugita et al. (1996) Fukugita, M., et al., 1996, AJ, 111, 1748
- Gaztanaga (2001) E. Gaztañaga, 2001, MNRAS, submitted, astro-ph/0106379
- Groth & Peebles (1977) Groth, E.J., Peebles, P.J.E., 1977, ApJ, 217, 38
- Gunn et al. (1998) Gunn, J.E., et al., 1998, AJ, 116, 3040
- Hudon & Lilly (1996) Hudon, J.D., & Lilly, S.J. 1996, ApJ, 469, 519
- Jain et al. (2001) Jain, B., et al., 2001, in preparation
- Kerscher et al. (2000) Kerscher, M., Szapudi, I., & Szalay, A.S., 2000, ApJ, 535, L13
- Kauffmann et al. (1999) Kauffmann, G., Colberg, J.M., Diaferio, A., White, S.D.M., 1999, MNRAS, 307,529
- Landy & Szalay (1993) Landy, S.D. & Szalay, A.S., 1993, ApJ, 412, 64
- Lupton et al. (2001a) Lupton, R., Gunn, J. E., Ivezić, Z., Knapp, G. R., Kent, S., & Yasuda, N. 2001a, in ASP Conf. Ser. 238, Astronomical Data Analysis Software and Systems X, ed. F. R. Harnden, Jr., F. A. Primini, and H. E. Payne (San Francisco: Astr. Spc. Pac.), in press (astro-ph/0101420)
- Lupton et al. (2001b) Lupton, R., et al., 2001b, in preparation
- Maddox et al. (1990) Maddox, S.J., Efstathoiou, G., Sutherland, W.J., 1990, MNRAS, 246, 433
- Maddox et al. (1996) Maddox, S.J., Efstathoiou, G., Sutherland, W.J., 1996, MNRAS, 283, 1227
- Nichol & Collins (1993) Nichol, R.C., Collins, C.A., 1993, MNRAS, 265, 867
- Peebles (1980) Peebles, P.J.E., 1980, “The Large-Scale Structure of the Universe”, (Princeton: Princeton University Press)
- Postman et al. (1998) Postman, M., Lauer, T.R., Szapudi, I., Oegerle, W., 1998, ApJ, 506, 33
- Roche et al. (1993) Roche, N., Shanks, T., Metcalfe, N., & Fong, R. 1993, MNRAS, 263, 360
- Schlegel et al. (1998) Schlegel, D.J., Finkbeiner, D.P., Davis, M., 1998, ApJ, 500, 525
- Scoccimarro & Sheth (2001) Scoccimarro, R., & Sheth, R.K., 2001, in press, astro-ph/0106120
- Scranton et al. (2001) Scranton, R., et al., 2001, ApJ, submitted
- Shane & Wirtanen (1967) Shane, C.D., Wirtanen, C.A., 1967, Publ. Lick Observatory, 22, part 1
- Stevenson et al. (1985) Stevenson, P.R.F., Shanks, T., Fong, R., & McGillivray, H.T. 1985, MNRAS, 213, 953
- Soughton et al. (2001) Stoughton, C., et al., 2001, AJ, submitted
- Strauss et al. (2001) Strauss, M., et al., 2001, in preparation
- Szalay et al. (2001) Szalay, A.S., et al., 2001, ApJ, submitted
- Szapudi et al. (1998) Szapudi, I. & Szalay, A.S., 1998, ApJ, 494, L41
- Szapudi et al. (2001) Szapudi, I., et al., 2001, in preparation
- Tegmark et al. (2001) Tegmark, M., et al., 2001, ApJ, submitted
- York et al. (2000) York, D.G. et al., 2000, AJ, 120, 1579
- Zehavi et al. (2001) Zehavi, I. et al., 2001, ApJ, submitted, astro-ph/0106476