High-resolution rotation curves of low surface brightness galaxies: Data
Abstract
We present long slit H observations of 50 low surface brightness galaxies. Of these, 36 are of sufficient quality to form rotation curves. These data provide a large increase in the number of low surface brightness galaxies for which accurate rotation curves are available. They also represent an order of magnitude improvement in spatial resolution over previous 21 cm studies ( to instead of to ). The improved resolution and accuracy of the data extend and strengthen the scientific conclusions previously inferred from 21 cm data.
1 Introduction
The rotation curves of spiral galaxies contain important information about the gravitational potential produced by their combined mass components. They played a fundamental role in establishing the need for dark matter (Sofue & Rubin 2001). The rotation curves of low surface brightness (LSB) galaxies are of particular interest because they offer evidence that LSB galaxies are dark matter dominated (de Blok & McGaugh 1996, 1997; Pickering et al. 1997, 1999; Blais-Ouellette, Amram, & Carignan 2001). Consequently, they have tremendous potential to constrain theories of galaxy formation (McGaugh & de Blok 1998a; van den Bosch & Dalcanton 2000), to probe the nature of dark matter (Pfenniger, Combes, & Martinet 1994; Spergel & Steinhardt 2000), and to test alternatives to dark matter (McGaugh & de Blok 1998b; de Blok & McGaugh 1998).
With central surface brightnesses (McGaugh 1996; Impey & Bothun 1997; Bothun, Impey, & McGaugh 1997), the maximum stellar surface densities of LSB galaxies are typically for plausible stellar mass-to-light ratios (: Bell & de Jong 2001). Yet their terminal rotation velocities () are no lower than those of higher surface brightness galaxies — they adhere to the same Tully-Fisher relation (Sprayberry et al. 1995; Zwaan et al. 1995; Hoffman et al. 1996; see also Courteau & Rix 1999). This lack of Tully-Fisher zero point dependence on surface brightness is widely interpreted to mean that dark matter dominates the observed rotation at essentially all radii, so that the rotation curves directly probe the invisible mass component. Degeneracies between stellar and dark mass which have plagued decompositions of the rotation curves of high surface brightness galaxies (e.g., Kent 1987) become much less severe in LSB galaxies.
In order to exploit this property of LSB galaxies to map out the dark matter distribution, it is desirable to obtain high spatial resolution data. The Hi data presented by de Blok, McGaugh, & van der Hulst (1996) were adequate to demonstrate many of the systematic properties which make LSB galaxy rotation curves particularly interesting. However, the beam size of those observations () led to concern over the effects of beam smearing on the derived shapes of the rotation curves (van den Bosch et al. 2000; Swaters, Madore, & Trewahla 2000). Though de Blok & McGaugh (1997) had shown that beam smearing was unlikely to be important in most (though not all) cases, controversy persists because these data are important in testing the cuspy halos predicted in cosmological simulations with cold dark matter (Navarro, Frenk, & White 1997 [NFW]; Moore et al. 1999). A direct way to address these concerns is to improve the spatial resolution of the observations. To this end, we have obtained optical rotation curves based on long slit observations of the H emission line. With seeing limited angular resolution of , corresponding to sub-kpc physical scales for the LSB galaxies in the sample, these new data represent over an order of magnitude improvement in spatial resolution.
For these new data, the error bars are often considerably smaller than in previous 21 cm studies (van der Hulst et al. 1993; de Blok et al. 1996). This accuracy, as well as the improved spatial resolution, are essential for improving constraints on detailed mass models, which are presented in a companion paper (de Blok, McGaugh, & Rubin 2001; hereafter Paper II). Our aim is to probe in detail the rotation curves, and hence the implied mass distributions (de Blok, McGaugh, Bosma, & Rubin 2001), for a significant number of galaxies which appear to be dark matter dominated.
This paper presents the H rotation curve measurements. The sample and the data are described in §2. Section 3 provides a direct comparison of these new data with available 21 cm data, and with independent H observations. A summary of the scientific impact of the new data is given in §4, and conclusions are in §5.
2 The Data
2.1 Sample
The principal targets for optical rotation curves are the LSB galaxies in the Hi sample of de Blok et al. (1996) and van der Hulst et al. (1993), with surface photometry and colors as reported in those papers and by McGaugh & Bothun (1994) and de Blok, van der Hulst & Bothun (1995). These galaxies are blue, late type LSB galaxies found in searches of deep photographic plates (Schombert et al. 1992; Impey et al. 1996) and exemplify the regime of low stellar mass surface density. We also have observed a few of the LSB dwarf galaxies of Schombert, Pildis, & Eder (1997), which are in may ways similar to the other LSB galaxies but are typically of lower luminosity. The sample does not include, as yet, red LSB galaxies such as those of O’Neil et al. (1997) and O’Neil, Bothun, & Schombert (2000). In addition, we also observed LSB galaxies from the UGC (Nilson 1973) and ESO-LV (Lauberts & Valentijn 1989) catalogs as time permitted. The ESO-LV catalog includes surface photometry information, so selection was based on central surface brightness: . Of galaxies in the accessible range of right ascension which met this criteria, we gave preference to ESO-LV galaxies which have been included in photometric studies (e.g., Matthews & Gallagher 1997; Bell et al. 2000).
Galaxies selected from the UGC are estimated to be of low surface brightness based on catalog diameters and magnitudes. Visual inspection of their images in the digital sky survey confirmed their LSB nature. For these, a knotty OB association morphology is a good predictor of ubiquitous H emission.
2.2 Observations
The data presented here were obtained with the Las Campanas du Pont 2.5 m telescope and the Kitt Peak 4 m telescope. We list in Table 1 observations for galaxies for which we have obtained velocity measurements, arranged by catalog: LSBs, UGC, and ESO-LV. Successive columns list (1) the name of the galaxy, (2) the heliocentric system velocity, (3) the disk inclination, (4) the position angle of the observation, (5) the quality of the data, (6) whether resolved Hi data exist, and (7) whether a mass model is constructed in Paper II. The quality flag denotes good (Q = 1), fair (2), and poor (3) H data. It bears no relation to the quality of the Hi synthesis data in cases where it exists. In general, the H data are better for defining the inner shape of the rotation curve, while the Hi data extend to larger radii.
For mass modeling, the quality of the data must be good. Every galaxy is unique and not all data can be blindly used for any purpose (see discussions in de Blok & McGaugh 1997 and McGaugh & de Blok 1998a). Of the 26 galaxies (Table 1) which are modeled in Paper II, 25 have Q = 1 (good).
The Hi data are taken from van der Hulst et al. (1993) and de Blok et al. (1996). When available, the Hi data provide a good kinematic indication of the position angle. This generally corresponds to the optical major axis of the galaxy, which is used as the position angle when Hi data are not available. Disk inclinations are adopted from previous studies (van der Hulst et al. 1993; de Blok et al. 1996) or are measured from optical axis ratios using . Photometric inclinations for LSB galaxies are intrinsically uncertain because of their generally ragged, late type morphologies and the low signal-to-noise in the outermost isophotes (see de Blok & McGaugh 1998 for a more extensive discussion of inclination uncertainties.) Generally, the tabulated values should be good to better than , though large excursions from that can not be discounted in a few cases. There is also some indication that LSB galaxies tend to be thinner (Dalcanton & Bernstein 2000; Matthews & van Driel 2000) than the edge-on axis ratio of implied by the formula we use for . This is a minor issue compared to the intrinsic uncertainty in the observed axis ratios. Fortunately, inclination errors only affect the absolute scale of rotation velocities, and not the shape of the rotation curve. Systemic velocities are derived from the H data as described below.
2.2.1 Las Campanas
Observations of galaxies from the ESO-LV catalog were made with the Las Campanas 2.5 m telescope in November 1998. We used the modular spectrograph with a 600 line/mm grating blazed at 1.25 in second order in combination with a blocking filter. The 200 mm camera was used with the SITe2 CCD and the slit width was , resulting in a spectral resolution of Å (0.6 Å/pixel). The CCD was binned by two in the spatial direction, giving a scale of /pixel.
The slit was rotated to coincide with the major axis of each galaxy. Target galaxies were acquired by offsetting from nearby stars, but galaxies were generally visible with the slit viewing optics. Exposure times were one hour, and a comparison lamp frame was taken at the same telescope pointing immediately after each object exposure. These comparison frames were taken to track flexure of the spectrograph, but proved unnecessary. For each frame, velocities are measured relative to night sky lines of known wavelength on the frame.
In addition to major axis spectra, minor axis and intermediate slit positions were obtained for a few galaxies in order to check for the presence of non-circular motions (see Table 1). Though only a few cases could be tested, these were chosen for their suggestive morphologies. Apparently, LSB galaxies are fairly quiescent rotators (see also O’Neil, Verheijen, & McGaugh 2000). Still, the frequency and magnitude of noncircular motions in LSB galaxies merits further investigation.
Immediately prior to the spectrographic portion of this observing run, -band images of target galaxies were obtained with the LCO 40 inch telescope. These images were used to determine inclinations and position angles, and also provide an estimate of the exponential scale length of the disk. Unfortunately, a non-photometric sky precluded using these frames for surface photometry and mass modeling.
2.2.2 Kitt Peak
Observations of galaxies from the sample of de Blok et al. (1996) and the UGC were made with the KPNO 4 m in June 1999 and February 2000. We used the RC-spectrograph and T2KB CCD with the KPC-24 grating (860 lines/mm) in second order and the RG610 blocking filter. The slit size was , yielding Å spectral resolution and a spatial scale of /pixel. The available slit viewing equipment did not allow for confident telescope positioning, so we measured offsets from nearby stars. Repeated settings showed this to be a repeatable procedure. We exercised considerable care to insure that each galaxy was properly aligned on the slit. Cumulative exposure times were one hour.
For galaxies with previous Hi observations, position angles were known from the Hi reductions. For the UGC galaxies, position angles are measured from digital sky survey images. As with the Las Campanas spectra, velocities are measured with respect to night sky lines on the same frame. For the lowest surface brightness and lowest luminosity targets, we failed to obtain high signal-to-noise emission line velocities from both Kitt Peak and Las Campanas spectra. Obtaining good data for these interesting objects is possible, but may be beyond the reach of 4 m class telescopes. At both Kitt Peak and Las Campanas, we were able to form rotation curves for about 70% of the galaxies with detectable emission.
2.3 Rotation Curves
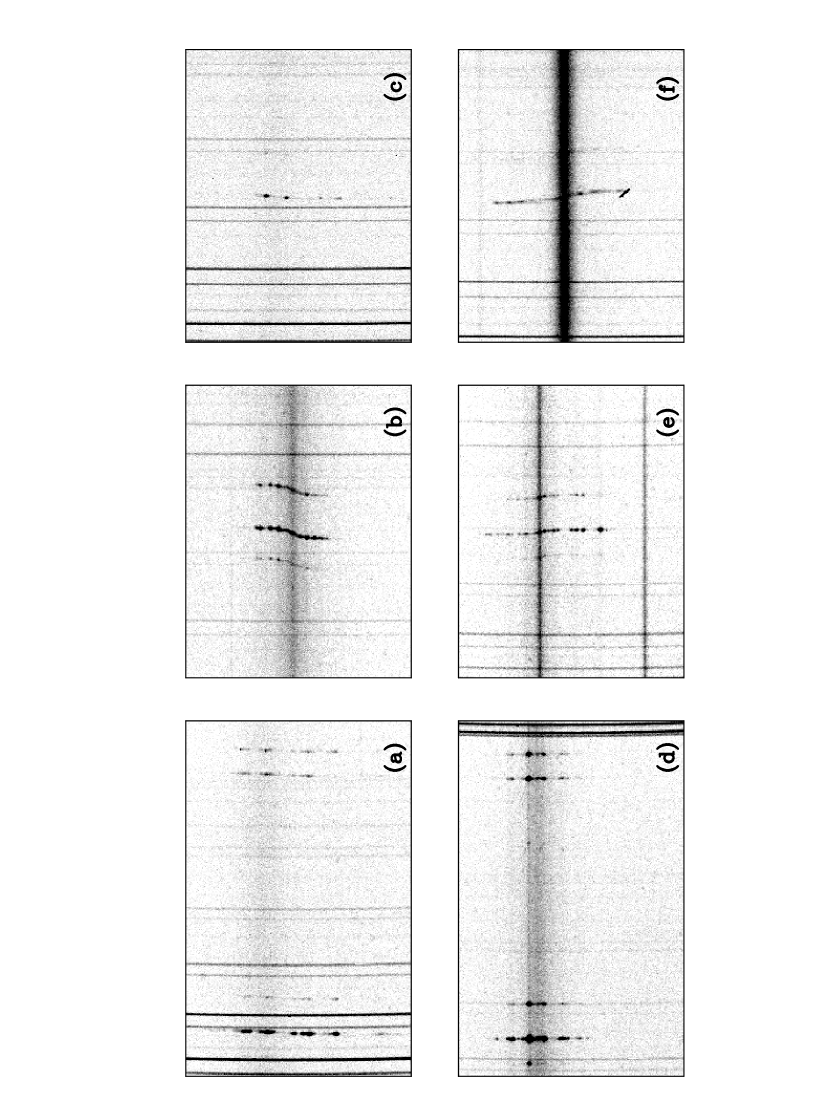
Example of the two dimensional long slit spectra are shown in Figure 1. The H emission line, the strongest line, provides the highest signal-to-noise tracer of the velocities. [N II] 6583Å is also often measured. The doublet [S II] 6716,6732 is generally detected, often entangled in the night sky OH lines beyond 6860 Å. The intensity of each [S II] line is generally stronger than [N II] 6583 Å, typical of low luminosity galaxies (Rubin, Ford, & Whitmore 1984). The strength of H varies from object to object, and thus also the accuracy of the rotation curve.
Details of the velocity measuring procedure follow those given by Rubin, Hunter, & Ford (1991). Night sky OH lines are used for the two-dimensional wavelength calibration, so no rebinning is necessary. For each spectrum, the velocity zero-point is set by the night sky lines on that frame. At successive distances from the nucleus along the major axis, velocities of both H and [NII] (and occasionally [SII]) are measured from the centroid of each emission line.
Major axis line-of-sight velocities as a function of radius are shown in Fig. 2. Mean velocities, formed from all measures within a small radial bin, are shown along with their 1 errors determined from the scatter in the measured velocities. Where only one point is measured within a bin, a nominal, conservative 1 error of 10 is adopted.
The center of each galaxy is generally well defined by the coincidence of the peak of the H emission with the peak of the stellar continuum emission from stars in the nucleus. The rotation curve is formed by flipping about this center and superposing, by eye, the velocities from the receding and approaching major axis and projecting to the plane of the galaxy disk. The resulting rotation curves are shown in Fig. 3 and the data for those with Q = 1 are given in Table 2.
In forming the rotation curves for galaxies with fairly symmetrical velocities, equal weight is given to the innermost and outermost regions. Occasionally extinction complicates the nuclear identification. Thus while the accuracy of a single velocity point is about 4 , we adopt an accuracy of 10 for the systemic velocity, due to the uncertainties in flipping the velocities to define . Mild asymmetries are quite common in galaxies (Richter & Sancisi 1994; Palunas & Williams 2000). These do not pose a problem to mass modeling (Paper II) provided proper account is taken of the related uncertainties. Gross asymmetries are another matter: such objects are excluded from further analysis.
A comparison of the central velocities derived here with systemic velocities from various sources shows a good agreement. For 31 galaxies with some independent recession velocity measurement, the value of the mean (absolute) difference . This is close to the nominal 10 accuracy adopted for our values. However, many of the external system velocities come from old catalog values, so must contribute significantly to .
To make the most judicious use of the available data, we have constructed hybrid rotation curves, which use H data over the range of radii where available, plus the 21 cm data to define the outermost points (Paper II). Such rotation curves offer the resolution of the optical data and the extent of the 21 cm data. The improved spatial resolution and smaller error bars provide stronger constraints on mass models than can be obtained from 21 cm data alone.
3 Comparison of Optical and 21 cm Data
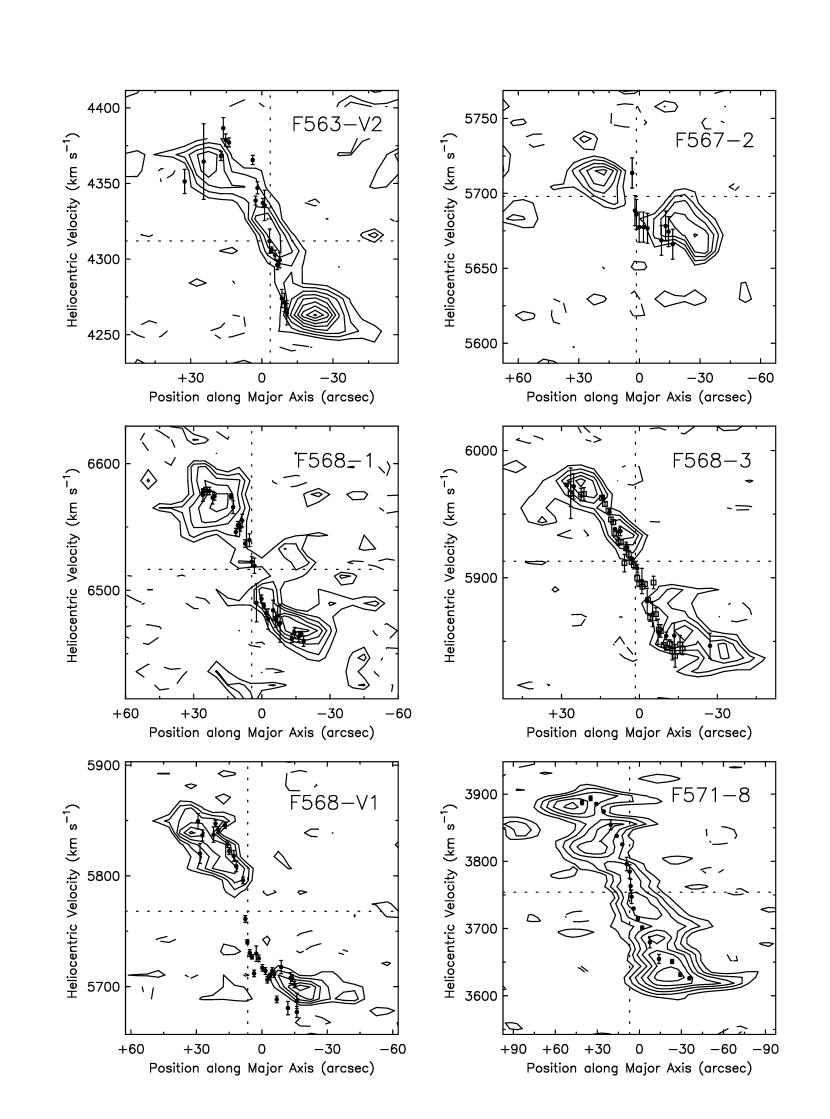
A major goal of this study is to compare the high resolution optical rotation curves with curves derived from 21 cm studies. We wish to investigate whether the beam size of the Hi observations ( to ) degraded steeply rising rotation curves, causing them to appear as slowly rising ones. The optical data points are overplotted on 21 cm position-velocity diagrams (van der Hulst et al. 1993; de Blok et al. 1996) in Figure 4. In addition to the H data presented here, we also make use of the optical observations of 5 LSB galaxies by Swaters et al. (2000), of which F568-3 is a duplicate. This results in 18 galaxies observed both at Hi and H for which a meaningful comparison can be made. This represents a significant fraction of the two dozen galaxies in the LSB Hi samples.
The agreement of the optical velocities with the Hi profiles varies on a case by case basis. The general shapes of many rotation curves are similar in H and 21 cm, but some are noticeably discrepant. In a few cases, the quality of the optical curves are poor, so a meaningful comparison is not possible.
Figure 5 shows the 21 cm rotation curves (van der Hulst et al. 1993; de Blok et al. 1996) with the optical points superposed. The comparison sample has now decreased to 15, as 4 galaxies with poor optical rotation curves are not included. The 21 cm velocities generally extend to larger radial distances than the optical. The median value of the ratio r(21cm)/r(H) = 1.5.
Four of the galaxies we have observed have independent H observations from other sources. F568-3 has been observed by us, and also by Pickering et al. (1998) and Swaters et al. (2000). The slow rise of its rotation curve, first indicated by 21 cm observations (de Blok et al. 1996), has been confirmed by all three independent optical data sets. F563-1, F561-1, and UGC 5750 have been observed by de Blok & Bosma (2002), with good general agreement with our observations (Fig. 6). In the case of F561-1, the error bars are unusually large due to its low () inclination combined with very limited emission. Each of our points in this case is a single measure with an adopted error, which projects to 25 in the plane of the galaxy. The uncorrected data are in good agreement: this is a repeatable experiment.
The consistency of the H and Hi data can be quantified by comparing the measured velocities at small radii. For 9 of the 15 galaxies (F561-1, F563-1, F568-1, F568-3, F571-V1, F579-V1, F583-1, UGC 5750, and UGC 11557) the velocity differences at 20′′ are . Note that these are rotation velocities projected to the plane of the galaxies; as observed on the plane of the sky, they correspond to . Hence these galaxies exhibit the same velocity rise that was observed at 21 cm.
This can be seen directly in Figures 4 and 5. In two cases (F561-1 and F571-V1) the agreement between the optical and 21 cm rotation curves is merely a matter of large error bars. For the other galaxies the agreement is genuine, and sometimes quite good (e.g., F568-3, F583-1, and UGC 5750). Indeed, the asymmetric structure of F579-V1111De Blok & McGaugh (1997) had already noted the difficulty this case posed for attributing to beam smearing the slow rise of the rotation curves derived from the 21 cm data. is apparent in both H and 21 cm data, with particularly good agreement between the two on the shape of the receding side (Fig. 4).
The remaining 6 galaxies (F563-V2, F568-V1, F571-8, F574-1, F583-4, and UGC 6614) have optical rotation curves which differ more noticeably from the earlier Hi curves. The reasons for this varies form case to case. Unlike most of the LSB galaxies in this sample, UGC 6614 has a strong bulge component for which one expects a rapidly rising then quickly falling rotation curve. This is apparent in the H data, which hardly extend into the range of disk-halo domination. The 21 cm data do not probe small radii, as there is a central hole in the HI distribution of this galaxy (van der Hulst et al. 1993). F571-8 is an edge-on galaxy, with the associated problems of optical depth and projection effects (Matthews & Wood 2001). F574-1 and F583-4 do suffer from significant beam smearing as a result of an elliptical beam shape which projects to a large physical size on the galaxy. This is convolved with the intrinsic HI distribution, which can complicate matters further if emission is lacking from particular regions (e.g., from a central hole). The situation for F563-V2 and F568-V1 is less clear as the optical data in these cases (from Swaters et al. 2000) has substantial scatter.
The agreement or disagreement between the optical and 21 cm rotation curves shows no correlation with LSB luminosity, apparent magnitude, central surface brightness, or inclination. We do observe that the galaxy of lowest luminosity (F565-V2; ) has slowly rising velocities while the LSB galaxy of highest luminosity (UGC 6614; ) has steeply rising velocities. This is consistent with the previously noted relation between luminosity and rotation curve shape (Rubin et al. 1985; Persic & Salucci 1991; McGaugh & de Blok 1998a). Little further can be said about this here as the remaining galaxies are restricted to the fairly narrow range .
Beam smearing effects are present in the 21 cm data, but are only significant in a few cases. Beam smearing has not caused us to mistake steeply rising rotation curves for shallow ones. There are rotation curves which do rise slowly, and these are common in low luminosity and LSB galaxies.
4 Scientific Impact
With the new H data for many objects which previously had been studied in Hi, it is possible to assess the scientific impact of higher spatial resolution. Concerns have been expressed that beam smearing in the Hi data might have seriously impacted the derived shapes of the rotation curves (van den Bosch et al. 2000; Swaters et al. 2000), and hence compromised conclusions which depend on these shapes. There are two issues to which the initial rate of rise of the rotation curve is particularly important: maximal disks and cuspy halos.
One significant conclusion from the H rotation curves is that one can now consider substantially higher maximum disk stellar mass-to-light ratios (Swaters et al. 2000; Paper II) than were inferred by de Blok & McGaugh (1997). A modest change in the rate of rise of a rotation curve can lead to a large change in the maximum disk . For example, in the case of F583-1, where only a small change in the shape of the rotation curve is found, the maximum disk mass-to-light ratio rises from as determined by the Hi curve (de Blok & McGaugh 1997) to from the H data (Paper II). This happens in spite of the rather modest change in the input data, and this maximum disk mass-to-light ratio could be pushed considerably higher still (to ) if one were to permit consideration of a hollow halo or a modest overshoot of the innermost data points (e.g., Palunas & Williams 2000). The maximum disk determined from the 21 cm data are already often uncomfortably high compared to the expectations for stellar populations (de Blok & McGaugh 1997). As anticipated then, the H data permit even more implausible maximal values of . Nevertheless, if one puts little weight on stellar population mass-to-light ratios, it is now formally possible to consider higher disk mass-to-light ratios than were indicated by the 21 cm data alone. The mass discrepancies of LSB galaxies are still large; this merely transfers the missing mass from halo to disk.
The situation for cuspy (NFW) halos is less promising. The H data have a clear preference for dark matter halos with constant density cores (Paper II; see also Côté, Carignan & Freeman 2000; Salucci 2001; Blais-Ouellette et al. 2001; de Blok et al. 2001) rather than the cuspy cores produced in cosmological simulations with cold dark matter (e.g., Navarro et al. 1997; Moore et al. 1999). As we show in Paper II, this important scientific conclusion is not an artifact of beam smearing.
5 Conclusions
We have presented H rotation curves for a sample of LSB galaxies. This is a large increase in the number of LSB galaxies for which such data are available. The substantial mass discrepancies of these galaxies make them useful probes of the dark matter problem (de Blok et al. 2001; Paper II).
These data represent an order of magnitude improvement in spatial resolution over 21 cm studies of the same galaxies (van der Hulst et al. 1993; de Blok et al. 1996). The optical data complement the radio data. The H data define the inner rise of the rotation velocities, and thus provide a more accurate determination of the shape of the inner potential of the galaxy. This is critical to the question of whether dark matter halos have cusps or cores. The 21 cm data extend to larger radii, probing the extent of the dark matter halo and mapping out the gas, an important component of the total baryonic mass in these systems.
These new data allow us to address directly the concerns which have been raised concerning the lower resolution of the radio data (van den Bosch et al. 2000; Swaters et al. 2000). Beam smearing turns out to be no problem for about half of the galaxies with both optical and 21 cm observations, and a serious problem in a only few. The basic scientific conclusions reached previously (e.g., McGaugh & de Blok 1998a,b) remain unaltered as the systematic properties of the rotation curves upon which these were based remain valid. Indeed, they have become more clear in the improved data.
The most important result of these data are the tighter constraints on mass models provided by the improved accuracy with which the potentials have been traced. This allows us to more clearly distinguish between dark matter halo models with constant density cores or central cusps in their density profiles. These new high resolution data strongly disfavor the cuspy halos predicted by cosmological simulations (Paper II).
References
- (1) Bell, E.F., Barnaby, D., Bower, R.G., de Jong, R.S., Harper, D.A., Hereld, M., Loewenstein, R.F., & Rauscher, B.J. 2000, MNRAS, 312, 470
- (2) Bell, E.F., & de Jong, R.S. 2001, ApJ, in press (astro-ph/0011493)
- (3) Blais-Ouellette, S., Amram, P., & Carignan, C. 2001, AJ, in press (astro-ph/0006449)
- (4) Bothun, G., Impey, C., & McGaugh, S. 1997, PASP, 109, 745
- (5) Côté, S., Carignan, C. & Freeman, K.C. 2000, AJ, 120, 3027
- (6) Courteau, S., & Rix, H.-W. 1999, ApJ, 513, 561
- (7) Dalcanton, J.J., & Bernstein, R.A. 2000, AJ, 120, 203
- (8) de Blok, W.J.G., & Bosma, A., 2002, A&A, submitted
- (9) de Blok, W.J.G., & McGaugh, S.S. 1996, ApJ, 469, L89
- (10) de Blok, W.J.G., & McGaugh, S.S., 1997, MNRAS, 290, 533
- (11) de Blok, W.J.G., & McGaugh, S.S. 1998, ApJ, 508, 132
- (12) de Blok, W.J.G., McGaugh, S.S., Bosma, A., & Rubin, V.C. 2001, ApJ, 552, L23
- (13) de Blok, W.J.G., McGaugh, S.S., & Rubin, V.C. 2001, in press (Paper II)
- (14) de Blok, W.J.G., van der Hulst, J.M., Bothun, G.D., 1995, MNRAS, 274, 235
- (15) de Blok, W.J.G., McGaugh, S.S., & van der Hulst, J.M. 1996, MNRAS, 283, 18
- (16) Hoffman, G. L., Salpeter, E. E., Farhat, B., Roos, T., Williams, H. & Helou, G. 1996, ApJS, 105, 269
- (17) Impey, C., & Bothun, G. 1997, ARA&A, 35, 267
- (18) Impey, C.D., Sprayberry, D., Irwin, M.J., & Bothun, G.D. 1996, ApJS, 105, 209
- (19) Kent, S. M. 1987, AJ, 93, 816
- (20) Lauberts, A., & Valentijn, E.A. 1989, The surface photometry catalogue of the ESO-Uppsala galaxies, (Garching: European Southern Observatory) (ESO-LV)
- (21) Matthews, L.D., & Gallagher, J.S., III 1997, AJ, 114, 1899
- (22) Matthews, L. D., & van Driel, W. 2000, A&AS, 143, 421
- (23) Matthews, L. D., & Wood, K. 2001, ApJ, 548, 150
- (24) McGaugh, S.S. 1996, MNRAS, 280, 337
- (25) McGaugh S.S., Bothun G.D., 1994, AJ, 107, 530
- (26) McGaugh, S.S., & de Blok, W.J.G., 1998a, ApJ, 499, 41
- (27) McGaugh, S.S., & de Blok, W.J.G. 1998b, ApJ, 499, 66
- (28) Moore, B., Quinn, T., Governato, F., Stadel, J., & Lake, G. 1999, MNRAS, 310, 1147
- (29) Navarro, J.F., Frenk, C.S., & White, S.D.M. 1997, ApJ, 490, 493 (NFW)
- (30) O’Neil, K., Bothun, G.D., & Schombert, J. 2000, AJ, 119, 136
- (31) O’Neil, K., Bothun, G.D., Schombert, J., Cornell, M.E., & Impey, C.D. 1997, AJ, 114, 2448
- (32) O’Neil, K., Verheijen, M.A.W., & McGaugh, S.S. 2000, AJ, 119, 2154
- (33) Nilson, P. 1973, Uppsala general catalogue of galaxies, (Uppsala: Astronomiska Observatorium) (UGC)
- (34) Palunas, P., & Williams, T.B. 2000, AJ, 120, 2884
- (35) Persic, M. & Salucci, P. 1991, ApJ, 368, 60
- (36) Pfenniger, D., Combes, F., & Martinet, L. 1994, A&A, 285, 79
- (37) Pickering, T.E., Impey, C.D., van Gorkom, J.H., & Bothun, G.D., 1997, AJ, 114, 1858
- (38) Pickering, T.E., Navarro, J.F., Rix, H.-W., & Impey, C.D. 1998, in Galactic Halos, ed. Zaritsky, D., ASP 136, 199
- (39) Pickering, T.E., van Gorkom, J.H., Impey, C.D., & Quillen, A.C., 1999, AJ, 118, 765
- (40) Richter, O.-G.; Sancisi, R. 1994, A&A, 290, L9
- (41) Rubin, V.C., Burstein, D., Ford, W.K., & Thonnard, N. 1985, ApJ, 289, 81
- (42) Rubin, V.C., Ford, W.K., Jr., & Whitmore, B.C. 1984, ApJ, 281, L21
- (43) Rubin, V.C., Hunter, D.A., & Ford, W.K., Jr. 1991, ApJS, 76, 153
- (44) Salucci, P. 2001, MNRAS, 320, L1
- (45) Schombert, J.M., Bothun, G.D., Schneider, S.E., & McGaugh, S.S. 1992, AJ, 103, 1107
- (46) Schombert, J.M., Pildis, R.A., & Eder, J.A. 1997, ApJS, 111, 233
- (47) Sofue, Y. & Rubin, V.C. 2001, ARA&A, in press (astro-ph/0010594)
- (48) Spergel, D.N., & Steinhardt, P.J. 2000, Phys. Rev. Lett., 84, 3760
- (49) Sprayberry D., Impey C.D., Bothun G.D., & Irwin M., 1995, AJ, 109, 558
- (50) Swaters, R.A. 1999, Ph.D. thesis, University of Groningen
- (51) Swaters, R.A., Madore, B.F., & Trewhella, M., 2000, ApJ, 531, L107
- (52) van den Bosch, F.C., & Dalcanton, J.J. 2000, ApJ, 534, 146
- (53) van den Bosch, F.C., Robertson, B.E., Dalcanton, J.J., & de Blok, W.J.G., 2000, AJ, 119, 1579
- (54) van der Hulst J.M., Skillman E.D., Smith T.R., Bothun G.D., McGaugh S.S., de Blok W.J.G., 1993, AJ, 106, 548
- (55) Zwaan M.A., van der Hulst J.M., de Blok W.J.G., & McGaugh S.S., 1995, MNRAS273, L35
| GalaxyaaF, D, and U galaxies were observed at Kitt Peak; E galaxies were observed at Las Campanas. | PAbbIf multiple position angles are listed, the major axis is given first. | QccH rotation curve quality: 1 = good; 2 = fair; 3 = poor. | HI | Mass | Comments | ||
|---|---|---|---|---|---|---|---|
| (km s-1) | Model | ||||||
| F561-1 | 4809 | 24 | 55 | 2 | Y | N | bulge, faint disk |
| F563-1 | 3502 | 25 | 161 | 1 | Y | Y | Mag. Irr |
| F563-V1ddLow quality data not displayed in Fig. 2. | 3890 | 60 | 140 | 3 | Y | N | faint, bar |
| F565-V2 | 3681 | 60 | 20 | 2 | Y | N | ragged |
| F567-2 | 5675 | 20 | 119 | 3 | Y | N | faint |
| F568-3 | 5913 | 40 | 169 | 1 | Y | Y | spiral with Mag. bar |
| F571-8 | 3768 | 90 | 168 | 1 | Y | Y | edge-on |
| F571-V1 | 5721 | 35 | 45 | 2 | Y | N | faint, ragged |
| F574-2 | 6320 | 30 | 53 | 3 | Y | N | core, faint disk |
| F577-V1 | 7788 | 35 | 40 | 2 | Y | N | Mag. Irr |
| F579-V1 | 6305 | 26 | 120 | 1 | Y | Y | core, flocc. arms |
| F583-1 | 2264 | 63 | 175 | 1 | Y | Y | Mag. Irr |
| F583-4 | 3617 | 55 | 115 | 1 | Y | Y | fuzzy |
| F730-V1 | 10714 | 50 | 16 | 1 | N | Y | spiral |
| D646-5 | 1045 | 29 | 2 | N | N | small; diffuse | |
| D723-4 | 2175: | 94 | 2 | N | N | small, irr | |
| UGC 4115 | 343 | 74 | 140 | 1 | N | Y | = D631-7; knotty and diffuse |
| UGC 5209 | 530: | 53 | 158 | 3 | Y | N | fuzzy, small |
| UGC 5750 | 4177 | 64 | 167 | 1 | Y | Y | Mag. bar |
| UGC 6614 | 6371 | 36 | 108 | 1 | Y | Y | bulge; spiral ring |
| UGC 9992 | 430 | 30 | 35 | 2 | N | N | fuzzy, small |
| UGC 10310 | 724 | 34 | 19 | 2 | N | N | knotty spiral arms; slit missed nuc.? |
| UGC 11454 | 6628 | 64 | 106 | 1 | N | Y | fuzzy spiral, small core |
| UGC 11557 | 1390 | 36 | 94 | 1 | NeeThis galaxy was observed at 21 cm by Swaters (1999). | Y | fuzzy spiral, small core |
| UGC 11583 | 128 | 83 | 88 | 1 | N | Y | faint Mag. bar |
| UGC 11616 | 5244 | 60 | 99 | 1 | N | Y | fuzzy, Irr |
| UGC 11648 | 3350 | 83 | 145 | 1 | N | Y | Irr |
| UGC 11748 | 5265 | 81 | 103 | 1 | N | Y | Irr, bright core/bar? |
| UGC 11819 | 4261 | 66 | 167 | 1 | N | Y | fuzzy |
| UGC 11820 | 1100: | 50 | 48 | 2 | N | N | blobby, irr. streamers SW/NE, sp? |
| UGC 11944 | 1753 | 72 | 30 | 3 | N | N | bar |
| ESO 0130200 | 1123 | 56 | 124 | 2 | N | N | bulge, faint disk |
| ESO 0140040 | 16064 | 35 | 125 | 1 | N | Y | bulge, tight spiral arms |
| ESO 0350090 | 1124 | 85 | 24 | 3 | N | N | Irr |
| ESO 0590090 | 1486: | 30 | 132 | 3 | N | N | bulge, faint disk, knotty NE arm |
| ESO 0840080 | 16327 | 20 | 85 | 2 | N | N | bulge, faint disk, star supperposed |
| ESO 0840411 | 6200 | 90 | 11 | 1 | N | Y | edge-on |
| ESO 1040220 | 800: | 54 | 109 | 3 | N | N | blobby |
| ESO 1040440ddLow quality data not displayed in Fig. 2. | 840: | 38 | 157 | 3 | N | N | irr, stars supperposed |
| ESO 1200211 | 1314 | 70 | 118 | 2 | N | Y | fuzzy Mag. bar |
| ESO 1450250 | 1837 | 53 | 128 | 2 | N | N | loose spiral |
| ESO 1560290 | 10583 | 171,152 | 1 | N | N | spiral, bulge | |
| ESO 1870510 | 1410 | 58 | 10 | 1 | N | Y | irr. spiral, floc. |
| ESO 2060140 | 4704 | 39 | 355 | 1 | N | Y | spiral |
| ESO 2490360 | 915: | 47 | 131 | 3 | N | N | Irr, blobby |
| ESO 3020120 | 5311 | 55 | 60, 87 | 1 | N | Y | spiral, hint of bar? |
| ESO 3050090 | 1019 | 53 | 50, 140 | 1 | N | Y | barred spiral |
| ESO 3520470 | 3815 | 47 | 78 | 2 | N | N | Mag. Irr |
| ESO 4250180 | 6637 | 33 | 92 | 1 | N | Y | barred open spiral |
| ESO 4880049 | 1800 | 63 | 132 | 1 | N | Y | inclined Mag. bar |
| Galaxy | |||
|---|---|---|---|
| (arcsec) | (km/s) | (km/s) | |
| F583-1 | |||
| -5.5 | 16.6 | 11.1 | |
| -2.8 | 6.1 | 5.8 | |
| 0.3 | -8.6 | 8.2 | |
| 4.1 | -7.8 | 1.1 | |
| 9.7 | -32.0 | 2.6 |
Note. — The complete version of this table is in the electronic edition of the Journal. The printed edition contains only a sample. These data are also available in electronic format from http://www.astro.umd.edu/ssm/data & http://www.atnf.csiro.au/edeblok/data.