The Infrared Continuum Radiation of NGC1808††thanks: Based on observations with ISO (Kessler et al. 1996), an ESA project with instruments funded by ESA Member States (especially the PI countries: France, Germany, the Netherlands and the United Kingdom) with the participation of ISAS and NASA.
The paper is devoted to the understanding of the infrared emission of nuclear regions in galaxies. a) ISO data of NGC 1808 are presented: spectro–photometry from 5.1 to 16.4 m; a map at 6m and 170m photometry. b) The data are complemented by a polarization measurement at 170m (2.50.4% at position angle 94°5°) and a map at 6m. In the map, the degree of polarisation goes up to 20% in the outer regions. We argue that the polarisation is produced by emission of big grains and exclude very small grains and PAHs or scattering and extinction. c) The mid infrared spectrum shows, beside the main emission bands, a so far unknown plateau of PAH features in the m region. d) The total spectrum can be fit under the assumption of optically thin emission. However, such a model fails to reproduce the 25m point and implies that the mid infrared is due to very small grains and PAHs. These particles would then also have to be responsible for the 6m polarisation, which is unlikely. e) To avoid these difficulties, we successfully turn to a radiative transfer model whose major feature is the existence of hot spots produced by the dust clouds around OB stars. We demonstrate the decisive influence on the mid infrared spectrum of both the PAHs and the hot spots.
Key Words.:
Polarisation – Infrared: galaxies – Galaxies: ISM – Galaxies: magnetic fields – Galaxies: individual: NGC18081 Introduction
The nucleus of a galaxy is usually deeply embedded in dust and can therefore only be probed by infrared (IR) observations. In this paper, we present an infrared polarisation and a spectro–photometric study of the starburst galaxy NGC1808. The new data are explained by a consistent model for grain heating and cooling. We include a discussion of the various infrared emission bands (IEB). Understanding the mid IR emission is of particular interest since the ratio of mid IR over total luminosity is a diagnostic for estimating the relative contribution of starburst versus AGN activity (Rigopoulou et al. 1999, Clavel et al. 2000).
Another important and so far unanswered question is how much of the galactic infrared emission is polarised. The observed emission in galaxies is always averaged over a large volume and, in case polarisation is detected, should be linked to large scale alignment of the dust. Polarised emission from interstellar grains can only be detected at infrared and submillimeter wavelengths and has been observed in various galactic sources, such as the Galactic Centre (Hildebrand 1989), molecular clouds (Novak et al. 1989, Clemens et al. 1999), star forming regions (Gonatas et al. 1990, Leach et al. 1991, Smith et al. 2000), protostars (Siebenmorgen & Krügel 2000) and prestellar cores (Minchin et al. 1995, Ward-Thompson et al. 2000), and in the nucleus of the starburst galaxy M82 (Greaves et al. 2000).
The galaxy NGC1808 is at a distance of 11.1 Mpc (Reif et al. 1982), where 1′′ corresponds to 53 pc. It is classified as type Sbc (Sandage & Tammann 1987) and seen fairly edge–on. The moderate far IR luminosity of a few L⊙ is ascribed by Krabbe et al. (1994) to young stars formed in recent star formation. For the central 1.5 kpc, Koribalski et al. (1993) suggest a total gas mass (HI plus molecular gas) of 4.2 M⊙, and Dahlem et al. (1990) propose 2 M⊙ of molecular gas. In the optical, NGC1808 reveals a disk with outer spiral arms. Dust filaments are seen in the North–East and seem to emerge from the nucleus (Veron–Cetty & Veron 1985). There is evidence of a central bar of 500 pc length, an inner ring–like structure (Tacconi-Garman et al. 1996), and a number of compact radio (Saikia et al. 1990) as well as near IR sources (Kotilainen et al. 1996).
In Sect. 2, we present the observations followed by a discussion of the infrared polarisation (Sect. 3). A model for astronomical PAHs is outlined in Sect. 4. The infrared spectral energy distribution is first discussed assuming optically thin emission (Sect. 5); the model is refined in Sect. 6 to include proper radiative transfer. Results are summarised in Sect. 7.
2 Observations
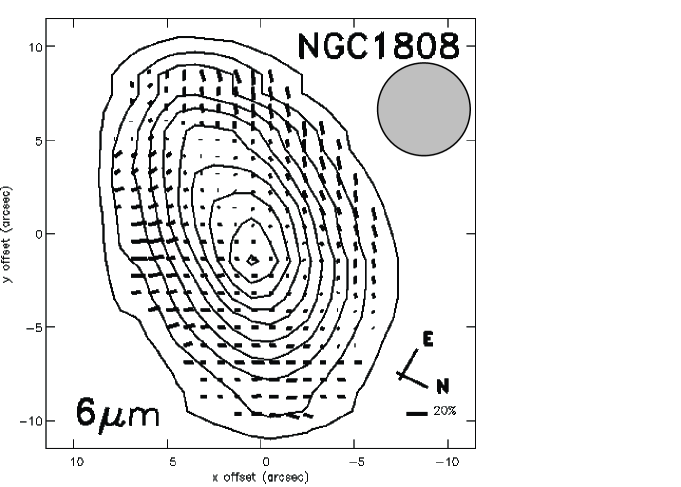
ISOCAM (Cesarsky et al. 1996) polarimetric imaging on NGC1808 was set up according to the observing template CAM05 (Siebenmorgen et al. 1996). The corresponding ISO observation numbers, TDT, are: 87501602, 87501703, 87501804, 87501905, 87502006, 87502107 and 87502208. We used the 6m filter lw4 and a 33 raster with a raster step size of 39′′ and the 3′′ lens. The read out time of each exposure was 2.1s. After a background measurement, we took 15 exposures on the source to stabilize the detector and then a raster through the free hole of the entrance wheel. At each raster position 15 exposures were read out. This procedure was carried out for each of the three polarisers. The polariser rasters were repeated in 2 cycles. The data were reduced with the ISOCAM interactive analysis system (CIA version 4.0, Ott et al. 1996). Only basic reduction steps, such as dark current subtraction, removal of cosmic ray hits or transient correction, are applied to the data. They are described together with calibration uncertainties in Siebenmorgen et al. (2000). The coadded images at each raster position were projected on the sky and corrected for field distortion to derive the final mosaics. The mosaics have a 168 total field of view and a pixel scale of 1′′. The polarised signal is found to be consistent between the cycles, and the average of all cycles gives the final mosaic image for each polariser. Our polarisation image is shown in Fig. 1 after correction for instrumental polarisation (Siebenmorgen 1999).
From the ISO archive we retrieved spectro–photometric–imaging data taken with the circular variable filter (CVF) of ISOCAM (TDT: 69702381). For each CVF step between 16.33m down to 5.14m, 11 exposures of 2.1 s integration time using the 3′′ lens were read out (Siebenmorgen et al. 2000, for more information on ISOCAM data handling). After background subtraction, we simulate multi–aperture photometry on the images. The spectrum, as derived for a aperture centred on the brightest pixel, is shown in Fig. 4 and Fig. 5. One notices strong IEBs centered at 6.2, 7.7, 8.6, 11.3 and 12.8 m. There is a weaker but definite broad band emission feature centered at 7.0m. A detection of the 7.0m band is reported for HD9730 by Siebenmorgen et al. (1998) and in other galaxies by Helou et al. (2000). In addition there is a plateau of fainter bands beyond 13m and most likely we see the rise towards the 16.4 m band (Moutou et al. 2000), which is just outside the scanned wavelength region. Below we combine the main bands as well as the fainter bands and newly discovered IEBs with measured laboratory modes of polycyclic aromatic hydrocarbons (PAH) and present quantitative model fits.
Linear polarisation at 170 m was detected with the ISOPHT C200 array (Lemke et al. 1996) by measuring several cycles with the , and polarisers (TDT: 85601702, 85601803, 85601904 and 85602005). The cycles were followed by an open (sky) measurement and one of the internal reference calibrators (Klaas et al. 1999). We commanded 4 pointings such that each of the 4 detector pixels measured the polarisation of the centre position of the galaxy in succession. In addition, the observations on the source were bracketed by two background observations to determine the zero signal level and to monitor instrumental variations. The sky measurements were processed and calibrated using the standard procedures for photometry (Laureijs et al. 2000) with the ISOPHT interactive analysis software (PIA version 8.1). After coaddition of the 4 pointings of the C200 array, we obtained a small map which indicated that the brightness distribution of the galaxy is not significantly different from that of a point source. We conclude that NGC1808 is not resolved with ISOPHT at 170 m. The galaxy is much brighter than the background and has a flux Jy, most of which comes from the central pixel. The estimated error of 10% is based on the ISOPHT absolute photometric calibration uncertainty.
Since the galaxy is a point source at 170m, we determined the polarisation only for the four pixel–position combinations centred on the galaxy. The polarisation measurements of the other positions in the map were not used as they were pointing on the wings of the beam profile of the galaxy. Due to the uncertainties in the beam profiles of each detector pixel, we are not sure whether our values for instrumental polarisation apply to measurements for which the detector pixel is not centred on the (polarised) point source. The processing of the signals were carried out according to the procedure described in Laureijs & Klaas (1999); we also used their instrumental polarisation values. The resulting fractional polarisation degree () and polarisation angle () with respect to the equatorial North per C200 detector pixel are presented in Table 1. The polarisation vector obtained from pixel 3 is significantly different from the other pixels and has a somewhat lower accuracy. The last line in Table 1 gives the polarisation derived from the average of the Stokes vectors of all pixels after subtraction of the instrumental polarisation. We did not include possible systematic uncertainties introduced by the instrumental polarisation of the pixels. We estimate that they amount to less than 1% in the final polarisation degree.
| pixel | ||
|---|---|---|
| number | ||
| 1 | 4.1 0.9 | 75 6 |
| 2 | 5.3 1.2 | 116 6 |
| 3 | 2.2 1.1 | 3 14 |
| 4 | 5.0 1.0 | 114 6 |
| mean | 2.50.4 | 945 |
3 First estimates
As the source is not resolved by ISO at 170m, its far IR size must be smaller than the diameter of the first Airy ring (140′′). Scans at 100m from the KAO (Smith & Harvey, 1996) indicate a maximum source size of compatible with the maps at 6m (this paper), and at 8.4 GHz and in Br (Kotilainen et al. 1996). To get an estimate of the average optical depth, we put and assume homogeneously distributed dust within steradian and at temperature of 33K, as is typical for starburst galaxies (Siebenmorgen et al. 1999). In this way, one gets in rough agreement with the estimate by Smith & Harvey (1996). By applying a standard dust model (Krügel & Siebenmorgen 1994b), this translates into a visual optical depth or .
The fractional polarisation implies a total polarised flux of Jy. The extrapolation of the (non–thermal) 20 cm radio flux of mJy with a –law to 170m gives only 4 mJy. Therefore the far IR polarisation of NGC1808 cannot contain any synchrotron contribution, but must be entirely due to thermal emission from dust grains aligned by a magnetic field.
The polarisation angle indicates the direction of the E–vector, which is perpendicular to the interstellar magnetic field. This result differs from the strength and field direction derived from the non–thermal radio emission. Averaging the central 90′′ of the 6 cm map by Dahlem et al. (1990), the angles differ by almost 70°. However, both observations may probe regions in the galaxy at different vertical heights where the magnetic field has a different horizontal component. A good example for such a case is presented by M 51 (Fig.1 of Berkhuijsen et al. 1996).
Our 6m ISOCAM map of NGC1808 also depicts the central region. Its size down to the lowest contours equals 23 and the integrated flux is mJy. A comparison with the Br emission (Kotilainen et al. 1996), which follows the OB stars, shows that we also trace the starburst at 6m. The starburst occurs mainly along the major axis of Fig. 1. Polarisation was also detected in the ISOCAM map. The polarisation is strongest (up to 20%) in the outer regions and weak in the centre of the starburst. Along the major axis and the central region of the galaxy where the Br emission and the near IR and radio hot spots are concentrated, the degree of polarisation is quite small. Because the E–vectors have a uniform direction over distances of , which is greater than the instrumental angular resolution, the field itself must be ordered over such a scale, corresponding to 500pc or more.
Extrapolating the 20 cm total radio flux towards the mid IR, we can exclude any net polarisation from non–thermal emission. When we integrate at 6m over the whole nucleus, we do not detect any net polarisation, but obtain only a 3 upper limit of .
| (1) | (2) | (3) | (4) | (5) |
| Wavelength | Damping Constant | Integrated Cross Section | Mode | Remarks |
| m | s-1 | cm2m | ||
| 3.3 | 20 | 12 | C-H stretch | no data |
| 5.2 | 12 | 1.1 | C-C vibration | tentative |
| 6.2 | 14 | 21 | C-C vibration | |
| 7.0 | 5.9 | 12.5 | C-H? | |
| 7.7 | 22 | 55 | C-C vibration | |
| 8.6 | 6 | 35 | C-H in-plane bend | |
| 11.3 | 4 | 36 | C-H solo out-of-plane bend | |
| 11.9 | 7 | 12 | C-H duo out-of-plane bend | |
| 12.8 | 3.5 | 28 | C-H trio out-of-plane bend | |
| 13.6 | 4 | 3.7 | C-H quatro out-of-plane bend | tentative detection |
| 14.3 | 5 | 0.9 | C-C skeleton vibration | first extragalactic detection |
| 15.1 | 3 | 0.3 | C-C skeleton vibration | tentative detection |
| 15.7 | 2 | 0.3 | C-C skeleton vibration | first extragalactic detection |
| 16.4 | 3 | 0.5 | C-C skeleton vibration | data do not cover full band |
| 18.2 | 3 | 1.0 | C-C skeleton vibration | no data |
| 21.1 | 3 | 2.0 | C-C skeleton vibration | no data |
| 23.1 | 3 | 2.0 | C-C skeleton vibration | no data |
(1) Center wavelength .
(3) Cross sections intregrated over the band. They are determined from our radiative transfer model and given per H atom for C-H vibrational modes, and per C atom for C-C modes.
(4) In the assignment of the weak bands, we follow Moutou et al. (1996) and Pauzat et al. (1997).
In the optical (V band), the degree of polarisation amounts to a few percent (Scarrot et al. 1993), which is much smaller than in the mid IR. The polarisation vectors at V are quite regular and lie perpendicular to the radial vectors towards the center of the galaxy. In the inner part (750pc) of the galaxy, the polarisation is reminiscent of a reflection pattern powered by the nucleus.
The mid IR polarisation, on the other hand, is also fairly regular, but neither circular nor centre–symmetric. This argues against scattered light from the galactic nucleus. Moreover, the grains are tiny compared to the wavelength so that their scattering cross section must be very small. Therefore, the mid IR polarisation mechanism is different from the optical and is either caused by extinction or emission of aligned dust. In any case, some of the interstellar grains must be elongated and aligned, a requirement not necessary for polarisation by scattering.
If the 6m polarisation at a 10% level or more is due to extinction, the associated optical depth at 6m must be greater than unity (Siebenmorgen & Krügel 2000, Fig. 11) and four or more at 10m. This would imply a very strong silicate absorption feature which is not seen. We therefore favor the idea that the polarisation is due to grain emission, as in the far IR. Note that the –vectors of the aligning field for the two scenarios are perpendicular to each other.
The polarised mid IR emission of the dust must have one of the following origins:
1. It may come from PAHs heated by the interstellar radiation field (ISRF) in the galactic nucleus (which is certainly much stronger than the ISRF near the sun). Indeed, our ISOCAM mid IR spectrum (Figs. 4 and 5) shows strong IEBs. The orientation of a PAH along an interstellar magnetic field works only if it has a magnetic moment and if the timescale for alignment is smaller than for disorder. Although carbon and hydrogen atoms are not paramagnetic, Rouan et al. (1992) propose a number of alternative ways how to endow PAHs with a magnetic moment. However, their conclusion is that PAHs, whether ionized or not, cannot align. Therefore we do not favour PAHs to produce the observed polarisation.
2. Small silicates are paramagnetic and consequently could align. But to account for the polarisation they must also contribute sufficiently to the emitted flux. Calculation of the emission from various types of transiently heated grains in reflection nebulae (Siebenmorgen et al. 1992, 1998; Li & Draine 2001b) show that small silicates are not efficient radiators at 6m.
3. Large grains with sizes Å, must have temperatures above 200 K to emit substantially at 6m. The heating by the ISRF is insufficient and the only possibility for them to get so hot is close to OB stars (in so called hot spots, see Fig. 6 and Sect. 6). Large grains are our favored alternative.


4 The dust model
4.1 Large and small grains
The dust model adopted in the following two sections consists of amorphous carbon particles (abundance in solid [C]/[H] = ) and silicates ([Si]/[H] = ) with bulk density 2.5 g/cm3. Their radii range from 100 to 2400 Å with an size distribution (Mathis et al. 1977). Absorption and scattering cross sections are calculated from Mie theory employing optical constants from Zubko et al. (1996) for amorphous carbon and Laor & Draine (1993) for silicates.
There is another dust population of very small graphites and very small silicates with radii 5 Å80 Å and size distribution whose temperatures fluctuate. Cross sections are again from Mie theory, optical constants for graphites come from Draine & Lee (1984). The abundances of the small graphite and small silicate grains are typically 5–10% that of the large carbon and large silicate grains. The assumed abundances imply a gas–to–dust mass ratio of 140.
4.2 Astronomical PAH
For simplicity, we consider only two kinds of PAHs: small ones with carbon atoms and big ones with . Both have a hydrogenation parameter, which is the ratio of hydrogenation to carbon atoms, of and a carbon abundance of relative to the big grains. We calculate absorption cross sections in the UV and visible following Schutte et al. (1993) and disregard the differences between neutral ond ionized PAH species (De Frees et al. 1993, Onaka et al. 1999, 2000, Chan et al. 2000, Uchida et al. 2000). For the infrared emission bands of the C–H and C–C vibrational modes we assume Lorentzian profiles:
| (1) |
where is the damping constant, the integrated cross section and the number of carbon or hydrogen atoms of the PAH in the particular band at center frequency . Model parameters of the PAH resonances are listed in Table 2. Altogether, we consider 17 PAH bands most of which are actually detected in NGC1808, except the one at 3.3m and those whose center wavelength is greater than 16.3m.
The assignment of the feature at 7m is unclear, it could either be a C–C stretch or due to C–H (Allamandola et al. 1989). There may also be some blending with gas emission lines (e.g. [Ar II] line at 6.983 m) which cannot be resolved with the CVF. The bands with m m are seen for the first time in an extragalactic object, but are known from Milky Way sources (Van Kerckhoven et al. 2000, Moutou et al. 2000, Hony et al. 2001).
In the far IR, properties of PAHs are not well constrained and we assume the continuum to fall off proportional to for m. Our infrared absorption cross sections are displayed in Fig. 2. They lie within the range of lab measurements (Moutou et al. 1996, Pauzat et al. 1997, Schutte et al. 1993) and they may be compared to other models, for example, by Li & Draine (2001). Fig. 3 shows the contribution of the dust populations to the total absorption cross.


5 An optically thin model
As a first attempt, we model the spectral energy distribution of NGC1808 under the assumption that the emission is optically thin and the dust mixture is exposed to diluted black–body radiation of mean intensity
| (2) |
where the dilution factor, , is a free parameter. The temperature reflects the effective temperature of the stellar population in the nucleus; we use K. In the model depicted in Fig. 4, . In this model, we have slightly modified a few integrated cross sections of the PAHs with respect to the numbers of column (3) in Table 2, but never more than 30%. The total gas mass, employing the abundances of the dust components as described above, equals .
Overall the fit to the data in Fig. 4 is good and for the PAH bands even excellent. A deficit of the model around 5.7m could possibly be due to yet unresolved band emission. Such a band is apparent in other spectra, for example, of the Orion bar and BD+30 3639 (Fig.10 by Schutte et al. 1993). The 5.2m is not well constrained by the data. The 7.0m IEB is detected. We point out the blending of the 12.0 m PAH band with the adjacent main features. In the optically thin model, the 6m radiation, which is further investigated in our polarisation study, is due to PAHs.
6 Radiative transfer: Hot spots


In the previous section we have matched the infrared spectral energy distribution of the nucleus of NGC1808 by optically thin dust emission and reasonable assumptions about the exciting radiation spectrum. Such a model gives a good match to the CVF and far IR data, however,
-
1.
it cannot account for the 25m emission;
-
2.
it gives no information of the structure within the nucleus nor on the observed IR sizes;
-
3.
it incorrectly assumes zero optical depth within the nucleus;
-
4.
its 6m emission is due to PAHs. As PAHs are unlikely to be good polarisers, this is in contradiction to our IR polarimetric results.
| Parameter | NGC 1808 |
|---|---|
| Distance | 11.1 Mpc |
| Extinction | |
| to center (=0) | 4.3 mag |
| Luminosity | |
| of all giants LG | L⊙ |
| of all OB–stars LOB | L⊙ |
| of one OB star LHS | L⊙ |
| Temperature | |
| of giants | 5000 K |
| of OB stars | 30000 K |
| Outer radius | |
| of nucleus RN | 3000 pc |
| of giants | 3000 pc |
| of OB stars ROB | 350 pc |
| Density | |
| of nucleus | : const |
| : | |
| of giants | |
| of OB stars | |
| in hot spots | H atoms per cm3 |
| Small PAHs | |
| abundance | 6% |
| size | 50 |
| hydrogenation | 0.2 |
| Large PAHs | |
| abundance | 4% |
| size | 500 |
| hydrogenation | 0.2 |
We therefore include the effects of radiative transfer in the nucleus of the galaxy. Such computations have been carried out in various approximations by a number of authors (Rowan-Robinson & Crawford 1989, Pier & Krolik 1993, Granato & Danese 1994, Efstathiou & Siebenmorgen 1995, Silva et al. 1998, Siebenmorgen et al. 1999b, Efstathiou et al. 2000, Ruiz et al. 2001). The procedure applied here is described by Krügel & Siebenmorgen (1994). The model assumes spherical symmetry which seems justified as the mid IR continuum image of NGC1808 (Fig. 1) indicates an oblate structure with ratio of major–to–minor axis of less than . It has the following characteristics:
-
•
There are two stellar populations both distributed within the nucleus: a) giants of 5000K surface temperature with a radial density distribution that falls off from the center to the edge of the nucleus like . b) OB stars (K, L⊙ ) each of which is surrounded by a spherical dust cloud. Their distribution drops inversely proportional to the radial distance from the nucleus.
-
•
There are hot spots (Krügel & Tutokov 1978). The heating of the dust in the galactic nucleus does not only change on large scales, but also locally. A grain at a galactic distance , as far as possible away from any star, gets less heated than one at same galactic radius , but close to a star. The hot spots are formed by the dusty envelopes around the OB stars.
In computing the radiative transfer in the hot spots, we assume that they are spheres. On the surface of the spheres the dust is heated equally by the ISRF of the galactic nucleus and by the central OB star. Consequently, the size of the hot spots is smaller in the center and increases in the outer regions of the nucleus.
Note that the emission of the hot spots is not just added to the emission from the rest of the nucleus, but is included in a self–consistent way (see Krügel & Siebenmorgen 1994). The main effect of the hot spots is to drastically enhance the mid IR flux.
The model nucleus of NGC1808 has a total luminosity L⊙, a gas mass M⊙, not terribly different from CO estimates (Dahlem et al. 1990), and a radius kpc. The dust density is constant in the inner parts of the nucleus where the OB stars are located and declines smoothly like further out. For the distribution of the OB stars, we take the FWHM of the 6m image as a guide and adopt an outer radius pc. From fitting the near IR data, we find that the near IR flux is mostly due to giants and put L⊙. The OB stars have a total luminosity L⊙, each individual OB star or hot spot has L⊙. The density in the hot spots is constant, (H+H H atoms per cm3. Model parameters are summarised in Table 3.
Results are shown in Fig. 5. Because of the hot spots, the 25m IRAS point is matched, which was not possible in the optically thin model of Fig. 4, and the agreement with the CVF data is even better.

Fig. 6 convincingly illustrates the importance of the hot spots and of PAHs for the mid IR spectrum of a galactic nucleus. We mention that the contribution of the very small grains is almost negligible; including them hardly changes anything. Fig. 6 also suggests that at 6m, the wavelength where we obtained a map and performed the polarisation measurements, about 50% of the flux comes from large grains. Therefore the proposition made at the end of Sect. 3 that the polarisation is due to emission by large grains is likely.
7 Conclusion
ISO observations of the inner nucleus of NGC1808 show at 6 m up to 20% and at 170 m a net polarisation of 2.5%. The mid IR polarisation map is the first of its kind of an extragalactic source. To explain the mid and far IR polarisation we rule out synchrotron radiation, scattering from large grains, PAH or small grain emission. Emission by large ( Å), non–spherical grains, aligned on large scales ( pc) by uniform magnetic fields is proposed as the major mid and far IR polarisation driver.
ISOCAM mid IR spectroscopy revealed a multitude of emission bands. We report the discovery of PAH features situated longward of 13m which are detected for the first time in a galaxy. Based on this observation, we derive integrated absorption cross sections of astronomical PAH which can be used for future dust studies.
The polarimetric and spectro–photometric data are consistently explained by a radiative transfer model which considers small localized regions of warm dust in the immediate vicinity of early type stars (hot spots). We demonstrate that this local heating gives rise to a significant contribution to the mid IR continuum by large grains. We find that the emission of small graphites or small silicates is negligible.
In addition, we conclude that NGC 1808 is not a starburst since in our model only 10% of the total luminosity comes from OB stars. This is supported by the observation that the optical depth in NGC 1808 is more than a factor 5 lower than in genuine starbursts like M82 or NGC 253.
Acknowledgements.
We thank the ISO operations team making it possible to complete the ISOCAM observing sequence CAM05 on NGC1808 just a few moments before the final shut down of the camera. CIA is a joint development by the ESA Astrophysics Division and the ISOCAM Consortium. The ISOCAM Consortium is led by the ISOCAM PI, C. Cesarsky. PIA is a joint development by the ESA Astrophysics Division and the ISOPHT Consortium. Contributing ISOPHT Consortium institutes are DIAS, RAL, AIP, MPIK, and MPIA.References
- (1) Allamandola L.J., Tielens A.G.G.M., Barker J.R., 1989, ApJS 71, 733
- (2) Berkhuijsen E.M., Horellou C., Krause M., et al., 1997, A&A 318, 700
- (3) Cesarsky C., Abergel A., Agnèse P. et al., 1996, A&A 315, L32
- (4) Chan K.W., Roellig T.L., Onaka T., et al., 2000, ”ISO beyond the Peaks”, A.Salama & M.F. Kessler (eds.), ESA SP–456, p.59
- (5) Clavel J., Schulz B., Altieri B., et al., 2000, A&A 357, 839
- (6) Clemens D., Kraemer K., Ciardi D., 1999, “ISO Polarisation Observations”, R.J. Laureijs and R. Siebenmorgen, ESA-SP435, ISBN 92-9092-740-2, http://www.iso.vilspa.esa.es
- (7) Dahlem M., Aalto S., Klein U., et al., 1990, A&A 240, 237
- (8) De Frees D.J., Miller M.D., Talbi D., et al., 1993, ApJ 341, 246
- (9) Draine B.T., Lee H.M., 1984, ApJ 285, 89
- (10) Efstathiou A., Rowan-Robinson M., Siebenmorgen R., 2000, MNRAS 313, 734
- (11) Efstathiou A., Siebenmorgen R., 1995, Models of dusty disks including transiently heated particles, in: ESO conference on “The role of dust in the formation of stars”, eds.: H.U. Käufl and R. Siebenmorgen, Springer Berlin–Heidelberg–New York, 1996, ISBN – 3-540-61462-1.
- (12) Glass I.S., 1976, MNRAS 175, 191
- (13) Gonatas D.P., Engargiola G.A., Hildebrand R.H., et al., 1990, ApJ 357, 132
- (14) Greaves J., Holland W.S., Jenness T., et al., 2000, Nature 404, 732
- (15) Granato G.L., Danese L., 1994, MNRAS 268, 235
- (16) Helou G., Lu N.Y., Werner M.W., Malhotra S., Silbermann N., 2000, ApJ 532, 21
- (17) Hildebrand R.H., 1989, “Interstellar Dust”, L.J. Allamandola and A.G.G.M. Tielens (eds.), p. 275–281, by the IAU
- (18) Hony S., Van Kerckhoven C., Peeters E., et al., 2001, A&A 370, 1030
- (19) Kessler M.F., Steinz J.A., Andregg M.E., et al., 1996, A&A 315, L27
- (20) Klaas U., Laureijs, R.J., Müller, et al. 1999, in “ISO polarisation observations”, R.J. Laureijs and R. Siebenmorgen, ESA-SP435, ISBN 92-9092-740-2, http://www.iso.vilspa.esa.es
- (21) Koribalski B., Dahlem M., Mebold U., et al., 1993, A&A 268, 14
- (22) Kotilainen J.K., Forbes D.A., Moorwood A.F.M., et al., 1996, A&A 313, 771
- (23) Krabbe P.P., Steinberg A., Genzel R., 1994, ApJ 425, 72
- (24) Krügel E., Tutokov A.V., 1978, A&A 63, 375
- (25) Krügel E., Siebenmorgen R., 1994, A& A 282, 407
- (26) Krügel E., Siebenmorgen R., 1994b, A& A 288, 929
- (27) Laor A., Draine B.T., 1993, ApJ 402, 441
- (28) Laureijs R.J., Klaas U., 1999, “ISO Polarisation Observations”, R.J. Laureijs and R. Siebenmorgen, ESA-SP435, ISBN 92-9092-740-2, http://www.iso.vilspa.esa.es
- (29) Laureijs R.J., Klaas U., Richards P.J., et al., 2000, “ISO Handbook Vol V: The Imaging Photo-Polarimeter, SAI/99-096/ Version 1.0, http://www.iso.vilspa.esa.es
- (30) Leach R. W., Clemens D.P., Kane B. D., et al. 1991, ApJ 370, 257
- (31) Lemke D., Klaas U., Abolins J., et al., 1996, A&A 315, L64
- (32) Li A., Draine B.T., 2001, submitted to ApJ (manuscript available at astroph)
- (33) Li A., Draine B.T., 2001b, submitted to ApJ (manuscript available at astroph)
- (34) Mathis J.S., Rumpl W., Nordsieck K.H., 1977, ApJ 217, 425
- (35) Minchin N.R., Sandell G., Murray A.G., 1995, A&A 293, L61
- (36) Moutou C., Leger A., d’Hendecourt L., 1996, A&A 310, 297
- (37) Moutou C., Verstaete L., Leger A., et al., 2000, A&A 354, L17
- (38) Novak G., Gonatas D.P., Hildebrand R.H., et al., 1989, ApJ 345, 802.
- (39) Onaka T., Mizutani M., Tomono D., et al., 1999, ”The Universe as seen by ISO”, P.Cox & M.F. Kessler (eds.), ESA SP–427
- (40) Onaka T., Mizutani M., Chan K.W., et al., 2000, ”ISO beyond the Peaks”, A.Salama & M.F. Kessler (eds.), ESA SP–456, p.55
- (41) Ott S., Abergel A., Altieri B., et al., 1996, ASAP Conference series, Vol. 125, 1997
- (42) Pauzat F., Talbi D., Ellinger Y., 1997, A&A 319, 318
- (43) Pier E.A., Krolik J.H., 1993, ApJ 418, 673
- (44) Reif K., Mebold U., Goss W.M., van Woerden H., et al., 1982, A&AS 50, 451
- (45) Rigopoulou D., Spoon H. W. W., Genzel R., 1999, AJ 118, 2625
- (46) Rouan D., Léger A., Omont A., et al., 1992, A&A 253, 498
- (47) Rowan-Robinson M., Crwaford J., 1989, MNRAS 238, 523
- (48) Ruiz M., Efstathiou A., Alexander D.M., et al., 2001, MNRAS 316, 49
- (49) Saikia D.J., Unger S.W., Pedlar A., et al., 1990, MNRAS 245, 397
- (50) Sandage A.R., Tammann G.A., 1987, “A Revised Shapley-Ames Catalog of Bright Galaxies”, Carnegie Institution of Washington Publ. 365, Washington
- (51) Scarrot S.M., Draper P.W., Stockdale D.P., et al., 1993, MNRAS 264, L7
- (52) Siebenmorgen R., 1996, “Polarimetric imaging with ISOCAM: C05 Observer’s Manual”, ESA/SAI/96-238/Dc, http://www.iso.vilspa.esa.es
- (53) Siebenmorgen R., “ISO Polarisation Observations”, 1999, R.J. Laureijs and R. Siebenmorgen, ESA-SP435, ISBN 92-9092-740-2, http://www.iso.vilspa.esa.es
- (54) Siebenmorgen R., Krügel E., Mathis J.S., 1992, A&A 266, 501
- (55) Siebenmorgen R., Natta A., Krügel E., Prusti T., 1998, A&A 339, 140
- (56) Siebenmorgen R., Krügel E., Chini R., 1999, A&A 351, 495
- (57) Siebenmorgen R., Krügel E., Zota V., 1999b , A&A 351, 140
- (58) Siebenmorgen R., Blommaert J., Sauvage M., et al., 2000, “ISO Handbook Volume III (CAM)”, SAI-99-057/Dc, http://www.iso.vilspa.esa.es
- (59) Siebenmorgen R., Krügel E., 2000, A&A 364, 625
- (60) Silva L., Granato G.L., Bressan A., 1998, ApJ 506, 600
- (61) Smith B.J., Harvey P.M., 1996, ApJ 468, 139
- (62) Smith C.H., Wright C.M., Aitken D.K., et al., 2000, MNRAS 312, 327
- (63) Tacconi-Garman L.E., Sternberg A., Eckart A., 1996, AJ 112, 918
- (64) Uchida K.I., Sellgren K., Werner M.W., et al., 2000, ApJ 530, 817
- (65) Van Kerckhoven C., Hony S., Peeters E., et al., 2000, A&A 357, 1013
- (66) Veron-Cetty M.P., Veron P., 1985, A&A 145, 425
- (67) Ward-Thompson, D., Kirk J.M., Crutcher R.M., et al., 2000, A&A 537, L135
- (68) Zubko V.G., Mennella V., Colangeli L., et al., 1996, MNRAS 282, 1321