Photometry and membership for low mass stars in the young open cluster NGC 2516
We present the results of a 0.86 square degree CCD photometric survey of the open cluster NGC 2516, which has an age of about 150 Myr and may have a much lower metallicity than the similarly-aged Pleiades. Our survey of cluster members is complete to and is used to select a preliminary catalogue of 1254 low mass () cluster candidates, of which about 70–80 percent are expected to be genuine. After applying corrections for contamination by non-members and adding data for higher mass stars from the literature, we investigate the cluster binarity, luminosity and mass function, mass segregation and total mass. We find a binary fraction of percent, for A to M-type systems with mass ratios between 0.6 and 1, which is very similar to the Pleiades. The mass function is metallicity and evolutionary-model dependent, but consistent with a Salpeter-like law (, or for the solar and half-solar metallicity models of Siess et al. (2000), and for the solar metallicity models of D’Antona & Mazzitelli (1997)), for . At lower masses () there is a sharp fall in the mass function, with or (for the solar and half-solar metallicity models of Siess et al.), and (for the solar metallicity models of D’Antona & Mazzitelli). The true stellar mass function might have values up to 0.4 larger if account were taken of low mass stars in unresolved binary systems with mass ratios less than 0.6. The falling mass function of NGC 2516 at lower masses seems inconsistent with the much flatter mass functions derived from comparable data in the Pleiades and field populations. This deficit of lower mass, fainter stars is also seen in the observed luminosity function. We rule out incompleteness as the cause of this discrepancy, but demonstrate that mass segregation is clearly present in NGC 2516, with more than half the low-mass () stars likely to lie outside our survey area, but the vast majority of high-mass () stars included. Taking this into account, it is probable that the whole-cluster mass functions for NGC 2516 and the Pleiades are similar down to 0.3. The mass of NGC 2516 stars with inside our survey is , depending on metallicity and what corrections are applied for unresolved binarity. Correcting for mass segregation increases this to , about twice the total mass of the Pleiades. If NGC 2516 and the Pleiades do have similar mass functions, then less massive stars and brown dwarfs contribute about a further 15 percent to the mass of NGC 2516 and we predict a cluster population of about 360–440 brown dwarfs with .
Key Words.:
open clusters and associations: individual: NGC 2516 – stars: mass function, luminosity function – binaries: general1 Introduction
Observations of co-eval stars in open clusters play a vital rôle in investigating the low-mass stellar initial mass function and defining the physical processes that drive the evolution of rotation, magnetic activity and photospheric light element abundances in cool stars with convective envelopes. The ability to study samples with common, well determined, ages, distances and compositions is the key to their usefulness. A careful census and identification of cluster members is usually a prerequisite of all such studies: (a) in order to prevent contamination of sample properties by interloping non-members that have different properties to the cluster stars and (b) to select samples of cluster stars that are unbiased with respect to the properties which are under investigation (e.g. magnetic activity).
Prior to 1990, most work in this area focussed on the nearby, well studied clusters such as the Hyades and Pleiades, for which there was ample pre-existing photometry and proper motion information. However, in the last decade it has been realised that a wider range of clusters need to be studied in detail. The reasons for this are:
-
1.
To properly sample a wide age range, from clusters just emerging from their parent molecular clouds at 10 Myr, through mature clusters like the Hyades at 600 Myr to the rarer old clusters such as M67 with ages of a few Gyr.
-
2.
Assuming that the properties of stars in one cluster are representative of all such stars at a similar age is precarious and neglects the possible influence of composition differences or birth conditions on behaviour in later life.
-
3.
To investigate dynamical effects such as mass segregation on cluster evolution and the possible universality of properties such as binary fractions and initial mass functions requires accurate membership studies in clusters with a wide range of ages and stellar densities.
In the last few years the rich, southern Galactic open cluster, NGC 2516 (RA, Dec, , ), has become a key object in the study of low mass stars. Meynet et al. (1993) give an age of 141 Myr, in comparison with ages for the better studied Pleiades and $α$ Per clusters of 100 Myr and 52 Myr respectively. Photometric studies of early-type cluster members were presented by Cox (1955), Eggen (1972) and Dachs & Kabus (1989), yielding a mean reddening estimate E(B-V)=0.12 and a distance of about 400 pc. A major X-ray study was undertaken using the ROSAT satellite by Jeffries, Thurston, & Pye (1997). 159 X-ray sources were identified within a 20 arcmin radius of the cluster centre, 65 of which could be identified as photometric members of the cluster with V, the majority being cool, coronally active stars. Using these stars, and comparing with other clusters, Jeffries et al. (1997) showed that NGC 2516 has a distance of about 390 pc and a excess that is best explained if its metallicity is substantially less than the Pleiades. A model dependent metallicity of [Fe/H] was derived, in agreement with an earlier study by Cameron (1985). A sub-solar metallicity was also found using an independent vs photometric technique by Jeffries, James, & Thurston (1998) and Pinsonneault et al. (2000), but has yet to be confirmed spectroscopically.
It is this possible low metallicity, together with its richness that makes NGC 2516 so interesting. There are plausible reasons why dynamo generated activity, rotational spindown and light element depletion could be profoundly affected by a low photospheric metallicity and thus differing convection zone properties. The compact size and numerous cluster members make NGC 2516 an ideal target for fibre spectroscopy and for X-ray satellites such as XMM and Chandra, which have limited fields of view. Recently, new X-ray studies by the ROSAT high resolution imager (Micela et al. 2000), Chandra (Harnden et al. 2001) and XMM-Newton (Sciortino et al. 2001) have devoted considerable amounts of time to observing NGC 2516. These more recent studies have used the photometric catalogue described in this paper to identify cluster X-ray sources.
So far, systematic membership studies in NGC 2516 have been limited to fairly bright stars or small areas. An unbiased, but severely incomplete list of cluster members down to about is presented by Jeffries et al. (1997), based upon position in the vs colour-magnitude diagram (CMD). Hawley, Tourtellot, & Reid (1999) present photometry and low resolution spectroscopy in the cluster down to much fainter limits, though over a very small area. Jeffries et al. (1998) present high resolution spectroscopy of photometrically selected candidates between , establishing definite membership through radial velocity measurements as well as lithium abundances. This work on brighter objects has been continued recently by Terndrup et al. (2001).
In this paper we present a catalogue of CCD photometry and astrometry down to faint magnitudes () and over a wide area (0.86 square degrees) in NGC 2516. This catalogue will be an invaluable tool for selecting unbiased samples of F, G, K and M stars for further study, interpreting X-ray observations and studying the dynamical state and mass function of NGC 2516. A preliminary version of this work appeared in Thurston (1999). We will restrict ourselves in this paper to a description of the data, the construction of a photometric catalogue and a membership classification on the basis of this photometry. Section 2 outlines the collection and reduction of the photometric data, and deals with the astrometric calibration, catalogue completeness and comparison with the previous literature. Section 3 describes a method for selecting candidate cluster members, which will need to be refined as more observational data become available. Section 4 uses this catalogue to look at the luminosity and mass function of NGC 2516 and search for evidence of mass segregation. The catalogue itself can be obtained in electronic format from the Centre de Données astronomiques de Strasbourg.
2 Observations
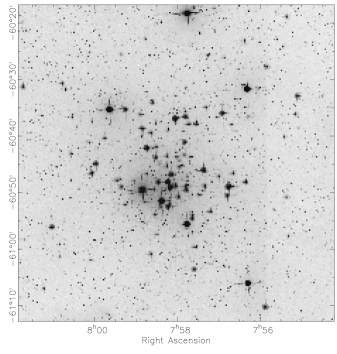
The data used in this paper were collected at the 0.9-m telescope of the Cerro Tololo Interamerican Observatory (CTIO) on the nights of 8 9 and 12 January 1995 (lunar phase 0.52-0.88). A CCD photometric survey was completed over an approximate 0.86 square degrees, centred upon RA , Dec (J2000.0), which comprised of 25 overlapping frames of 13.5x13.5 square arcminutes, taken with a 2048x2048 pixel Tektronix CCD at the Cassegrain focus. The centres of the fields were separated by 10.5 arcminutes, leading to a square survey area, on a side (see Fig. 1). A series of short (30s, 15s, 15s) and long (200s, 100s, 100s) exposures were taken through a set of Harris filters respectively. In addition to these target exposures, on each night a set of high quality twilight flat fields were obtained through each filter and many Landolt (1992) standard fields were observed over the entire range of airmass for which the cluster data were taken.
All of the frames were bias subtracted and flat-fielded with standard methods using the Starlink figaro package (Shortridge et al. 1999). The only complications were that the CCD was read out using two amplifiers with slightly different bias, gain and readout noise characteristics. This was dealt with by reducing the two halves separately and then correcting for the gain ratio by requiring that the flat fields were continuous across the amplifier boundary. The flat-fielding was tested by flat-fielding median stacked night sky exposures and found to successfully remove most of the structure in the sky at a level better than a few tenths of one percent, apart from several CCD cosmetic defects (including a number of bad columns) and a narrow (10 arcsecond) strip around the outside of the field. A mask was constructed so that these defective pixels were not considered in the subsequent reduction.
2.1 Photometry
The Starlink photom package (Eaton et al. 2000) was used to determine aperture photometry of the standards in a 6 arcsec radius (the stellar FWHM for all our data was around 1.3-1.7 arcseconds), which contained about 95-98 percent of the stellar flux. Nightly transformation coefficients, extinction and zero points were determined using iterative weighted least squares fits to photometry of about 100 Landolt (1992) standards, rejecting stars greater than from the fit at each step until the solution converged.
Equations of the form
| (1) | |||||
| (2) | |||||
| (3) |
were used to transform the instrumental magnitudes (in small letters) onto the Johnson , , Cousins system, where are the colour coefficients, the extinction coefficients, the airmass and the zero points (the magnitude yielding 1 detected photon per second). The best fit values for these coefficients on each night are given in Table 1, along with the number of Landolt standards measured and the rms discrepancy between their measured and published magnitudes. Residuals were examined as a function of airmass, colour and time with no significant trends seen. On each night we observed several red standards with , so we expect our calibration to be well constrained in this region.
| eqn | rms | ||||
|---|---|---|---|---|---|
| 8 Jan | 0.018 | 0.158 | 23.337 | 88 | 0.015 |
| 9 Jan | 0.011 | 0.152 | 23.327 | 101 | 0.016 |
| 12 Jan | 0.022 | 0.227 | 23.277 | 111 | 0.024 |
| eqn | rms | ||||
| 8 Jan | 0.928 | 0.106 | -0.205 | 87 | 0.017 |
| 9 Jan | 0.933 | 0.120 | -0.206 | 102 | 0.019 |
| 12 Jan | 0.934 | 0.146 | -0.205 | 110 | 0.017 |
| eqn | rms | ||||
| 8 Jan | 1.001 | 0.091 | 0.968 | 86 | 0.018 |
| 9 Jan | 1.003 | 0.130 | 0.965 | 100 | 0.024 |
| 12 Jan | 1.016 | 0.117 | 0.968 | 99 | 0.018 |
Each target frame was then analysed. The first step was to mask out regions that were saturated due to the presence of very bright stars. The routine daofind from the daophot ii package (Stetson 1987; Eaton & Privett 1996) was then executed using a 5 sigma threshold and with shape rejection parameters set to exclude extended objects and cosmic ray spikes. The number of sources found per field ranged from 100-200 in the short exposures to about 3000 in the long exposures.
Aperture photometry was performed using the photom routines. Both 3 and 6 arcsec radius apertures were used. For the brighter stars, where the statistical errors were smaller than 0.01 mag (about ), the larger aperture results were used and these also calibrate the aperture correction from the small to the larger aperture for the fainter stars. The sky estimation was taken from the mode in a surrounding annulus. At this stage stars were rejected if masked pixels fell within the object aperture and if they were close to the frame edges.
The next stage combined the separate filter measurements in each field, treating the short and long exposure sequences separately. The instrumental measurements for a particular field were combined by matching the pixel coordinates and allowing for small translations between the fields. The object list was used as the reference frame (i.e. an object must be detected in and at least one other filter to be incorporated in the final catalogue). Mean airmasses were calculated for the and pairs and the catalogue of measurements for that field transformed onto the standard magnitude system. If no measurement was available (faint, red objects), then we used a mean relationship between and in order to estimate for the purposes of transformation to a standard magnitude (see Sect. 3.3). This latter procedure should add no more than magnitudes to the error because the colour term, , is small.
A preliminary astrometric solution was found for the centroided CCD positions in the long exposure of each field. This was obtained by identifying many stars from the Guide Star Catalogue Version 1.1 (Lasker et al. 1990). A 6-coefficient fit to these reference stars, resulted in solutions good at the level of 1 arcsecond. The x,y pixel coordinates of objects identified in the long exposures were then transformed to RA and Dec using this solution. Of course some bright stars () were saturated in the long exposures and their positions must be taken from the short exposure. This was achieved by fitting a linear translation between the long and short exposures, using stars detected in both frames.
Objects were then matched between the catalogues from the short and long exposures. Where objects appear in both, a weighted mean of the photometry was taken. There were generally about 200 well measured stars common to both the short and long catalogues in each field. The magnitudes of these stars were in very close agreement. The biggest differences we ever found were about 0.02 mag, which confirmed our preliminary assessment at the telescope that these were very good photometric nights.
We followed a similar procedure to deal with stars in the overlapping regions between fields. Again, where two (or even more) measurements existed, a weighted mean of the photometry was taken. Analysis of the discrepancies between magnitudes of stars in these overlap regions is our primary estimate of the internal accuracy of our photometry. We found no evidence for systematic variation in the photometric calibrations between nights or between fields at a level greater than 0.02 mag. Table 2 shows the internal error estimates (the rms values for the overlap discrepancies) as a function of magnitude. Beyond the statistical errors in the photometry rise rapidly.
Possible causes of error are (of course) the statistical errors, but also variations in the point spread function, and hence the aperture correction, over the CCD field of view (especially in frames not precisely in focus). This would contribute a term (in quadrature) which was the same at all magnitudes – which is approximately what we see. Although the short and long exposures in each field were taken in one observing sequence, some of the overlapping fields are separated by hours or even nights. It is therefore quite plausible that some genuine variability also contributes to these errors. That the errors in the magnitudes are larger than the colour indices, suggests that errors in correcting measured magnitudes to the standard star aperture values near the edges of the CCD fields are the more likely culprit. If this is the case, the errors in Table 2 are likely to be overestimates for the majority of stars with . For , the statistical errors dominate.
| data | data | data | ||||
|---|---|---|---|---|---|---|
| rms | N | rms | N | rms | N | |
| 11-12 | 0.078 | 15 | 0.025 | 12 | 0.036 | 13 |
| 12-13 | 0.021 | 25 | 0.012 | 25 | 0.036 | 25 |
| 13-14 | 0.042 | 62 | 0.013 | 58 | 0.027 | 60 |
| 14-15 | 0.029 | 80 | 0.015 | 78 | 0.016 | 80 |
| 15-16 | 0.032 | 163 | 0.021 | 156 | 0.033 | 156 |
| 16-17 | 0.040 | 253 | 0.026 | 241 | 0.027 | 249 |
| 17-18 | 0.050 | 395 | 0.041 | 318 | 0.042 | 360 |
| 18-19 | 0.075 | 598 | 0.046 | 257 | 0.050 | 401 |
| 19-20 | 0.099 | 534 | 0.052 | 65 | 0.055 | 255 |
2.2 Astrometry
The preliminary positions determined from 6–coefficient fits to objects in the Guide Star Catalogue (rms typically arcsec) were improved upon using pre–release data from the SuperCOSMOS Sky Survey (Hambly et al. 2001a). The UK Schmidt plate from field 124 was used (plate number J2978, epoch 1977.223). These data consisted of a catalogue of million objects to . At the time these data were used, the global astrometric plate reductions were based on standards from the Tycho–AC catalogue (Urban, Corbin, & Wycoff 1998) and had typical residuals per standard of arcsec in either co-ordinate (for more details of the astrometric reductions for SuperCOSMOS Sky Survey data, see Hambly et al. 2001b). For each CCD frame, objects in the photometric catalogue were matched with objects found on the photographic plate. A matching radius of 5 arcsec was used. A 6–coefficient linear transformation was then applied to the CCD coordinates with an additional cubic radial distortion coefficient as a further free parameter. The optical axis was assumed to be the centre of the CCD. Parameters were adjusted to get the smallest rms when compared with tangent–plane positions on the photographic plate (the radial distortion term was almost negligible). The typical zero-point shifts applied to the preliminary positions were about 0.7 arcsec, with final rms values of around 0.3 arcsecs, which we expect are largely dominated by uncertainties in the photographic positions.
The quality of the astrometry has recently been tested with a fibre-spectroscopy run on the low-mass cluster candidates (see Sect. 3.3), using hydra on the CTIO 4-m telescope. Excellent results were achieved over a 40 arcminute diameter field, using brighter cluster members as the fiducial acquisition stars and 2 arcsecond diameter fibres (Jeffries et al. in preparation).
2.3 The catalogue completeness
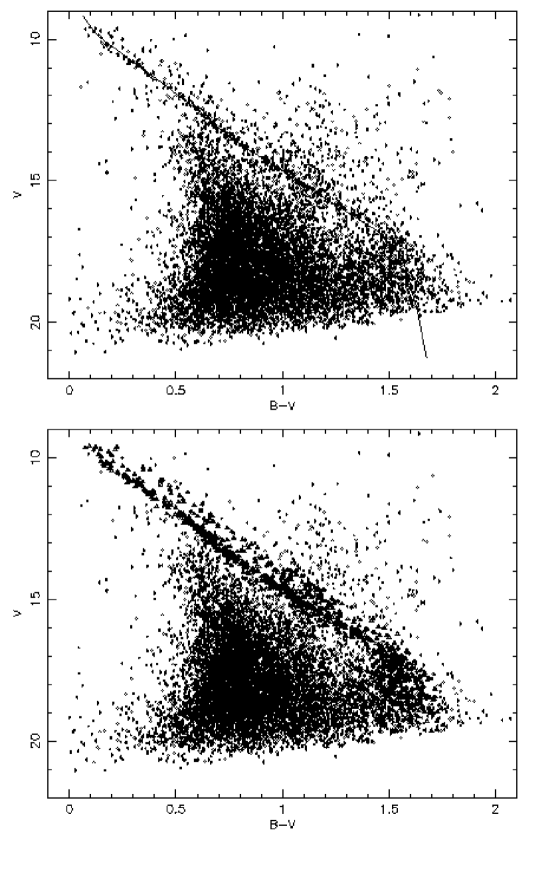
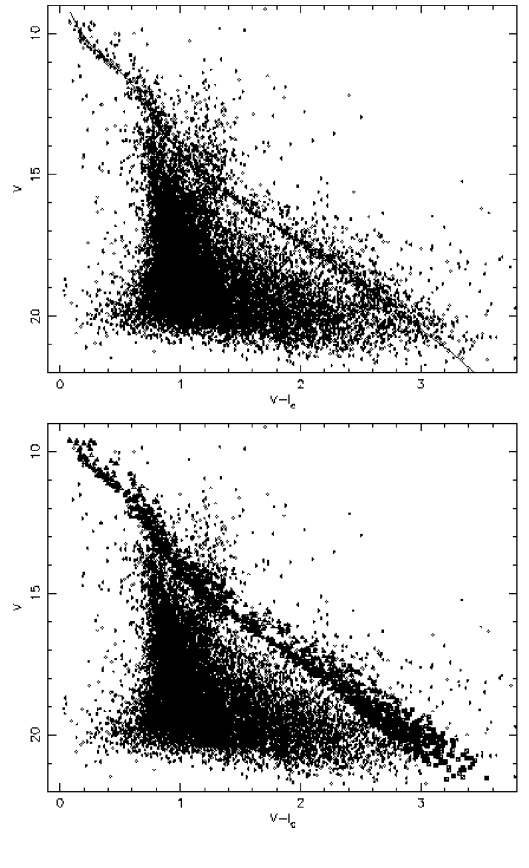
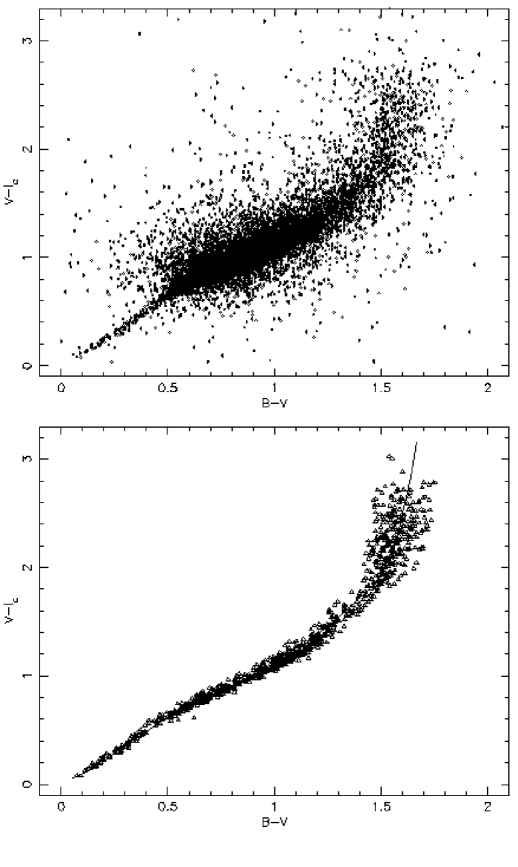
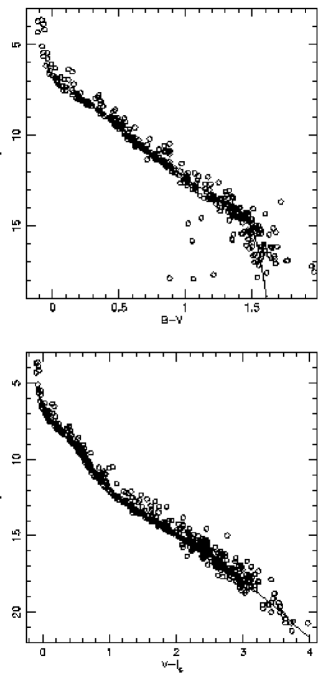
The photometric/astrometric catalogue is given in Table 3 (available from the Centre de Données astronomiques de Strasbourg) and consists of 15 495 stars with magnitudes, and colours when available, along with their J2000.0 positions and flags indicating their membership and binarity status (see Sect. 3.3). The complete vs and vs colour-magnitude diagrams (the and CMDs) are shown in Figs. 2 and 3 and the colour-colour diagram is shown in Fig. 4. We refer hereafter to this as the CTIO catalogue.

In Fig. 5, the apparent magnitude luminosity function of the whole catalogue is shown in 0.25 magnitude bins. There is a clear turnover in the apparent luminosity function beyond . Catalogue completeness has been investigated by adding simulated stars to our observed frames and then searching for these stars using the same daofind parameters. We find that there are three possible causes for the apparent turnover in the luminosity function.
-
1.
Clearly our search threshold imposes a magnitude limit on the catalogue. Tests on the long frames near the centre of the cluster reveal that the level of incompleteness caused by this and also by faint stars being close to bright stars is approximately 1.5 percent at and 10.7 percent at . This is not sufficient to account for the observed turnover.
-
2.
We require that in addition to being detected in the observation, a star is also detected in at least one of the or observations. The individual 5-sigma detection limits for our long exposures average about , and (depending on seeing and moon phase). Thus in practice their are only a few (faint blue) stars detected in and only and the vast majority of the catalogue has a measurement. However, there will be a significant number of faint, intermediate colour stars () which are detected in but not . Our simulations show that for (where the bulk of the population might be expected to lie), 10 and 50 percent incompleteness occur at about and and therefore and .
-
3.
This latter effect is confused by the probability that the turnover in the luminosity function is real. At , the major population of the CMD at will be K-dwarfs, because the cluster has a galactic latitude of -15.8 degrees. At a typical K-dwarf would be at a distance of 7.5 kpc and therefore more than 2 kpc below the galactic plane. The scale height of such stars is actually less than 1 kpc, so we would naturally expect to see a decrease in the luminosity function beyond .
The latter two effects become much weaker for redder stars. These are invariably detected at and because M-dwarfs are much less luminous than K-dwarfs, the scale height argument is also less applicable. The completeness limit for faint, red stars in NGC 2516 will therefore be determined solely by the first factor. This is illustrated in Fig. 5, where we also show the apparent luminosity function for those stars with . The final outcome of this discussion is that we believe our catalogue is almost ( percent) complete to over the whole vs CMD. However, we estimate that our catalogue is still 90 percent complete to for faint members of NGC 2516 that are selected on the basis of and . If we require selection in the vs CMD as well, the completeness level is governed by the frame completeness for red stars and we have 90 percent completeness for faint, red NGC 2516 members at about , and about for the general field population at .
2.4 Comparison with other photometry
A number of other photometric studies have been published on NGC 2516, though none that go both as deep and cover as large an area as this one. We have compared our work with photoelectric () photometry published by Eggen (1972), photographic and photoelectric () photometry published by Dachs & Kabus (1989) and CCD () photometry published by Hawley et al. (1999).
The Eggen (1972) and Dachs & Kabus (1989) photometry is discussed extensively by Jeffries et al. (1997). In that paper an optical catalogue is compiled from these sources, in which small corrections (of order 0.02 mag.) are made to the Eggen photoelectric and the Dachs & Kabus photographic values, to put them on a consistent system defined by the Dachs & Kabus photoelectric values. Dachs & Kabus estimate 0.02 mag. errors in their photoelectric values and Jeffries et al. deduced errors of about 0.06 mag. for their photographic values. The final catalogue contains 568 objects and was estimated to be complete to about . We find that there are 500 matches with our new CTIO catalogue. The remaining objects either lie outside the area covered by the CTIO survey or were bright objects and hence saturated. Hawley et al. (1999) present a list of 155 candidate members of NGC 2516 that are within our survey area. We were able to find 130 matches to these within 1.2 arcseconds. The remaining unmatched stars are very faint and were unlikely to be detected in our survey.
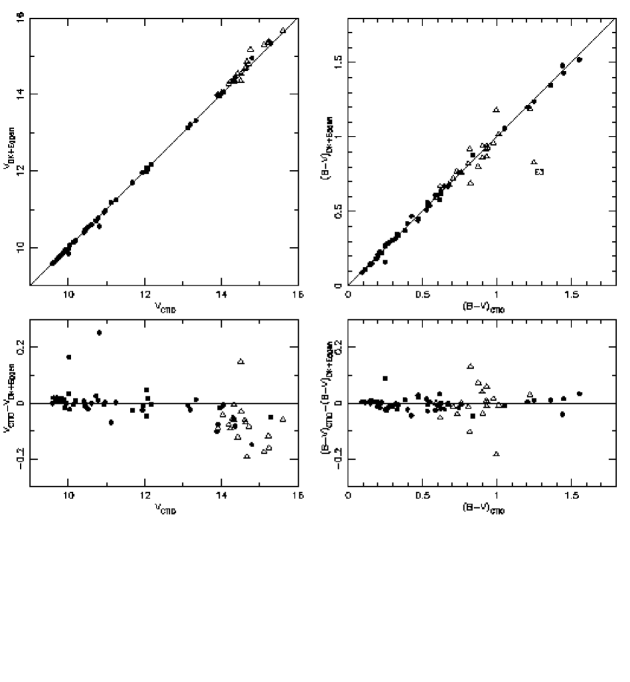
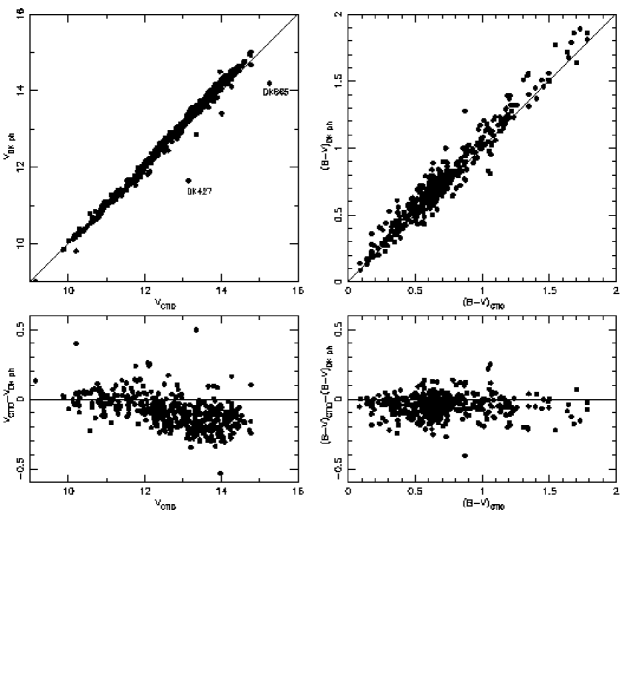
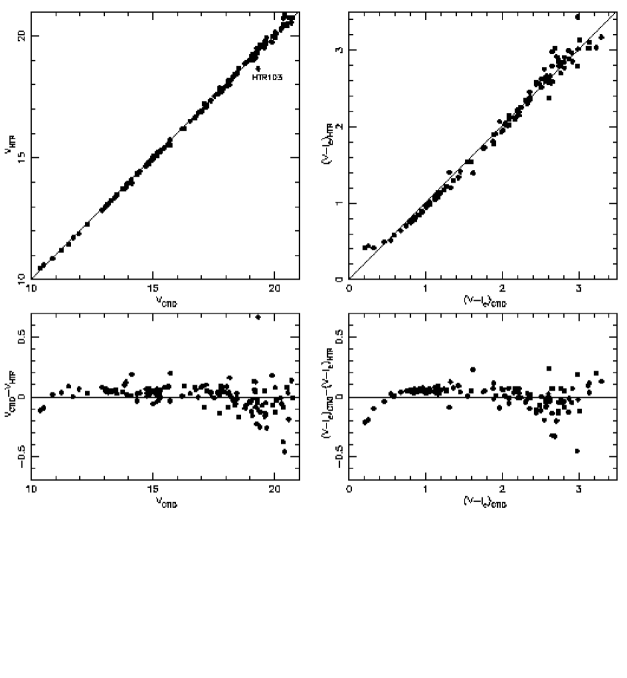
Graphical comparisons between the catalogues are shown in Figs. 6, 7 and 8 where we have divided the comparison between: the photoelectric data from Eggen (1972) and Dachs & Kabus (1989) (which are given different symbols); the photographic photometry from Dachs & Kabus; and the CCD photometry from Hawley et al. (1999). The lower panels in these Figs. show the discrepancies between the CTIO and comparison photometry. In all plots, the solid line simply represents equality between the CTIO and comparison data, rather than a fit.
Figure 6 shows that there is an increasing discrepancy towards fainter magnitudes among the the Dachs & Kabus (1989) and Eggen (1972) photometry in comparison with the CTIO data. This appears to be the case to a much severer degree in the photographic Dachs & Kabus data (Fig. 7). We are confident that our photometry is excellently calibrated in this magnitude range, with no trends at all to . We note that the two labelled outliers, DK427 and DK865, are quite close ( arcsecs) to companion stars which might easily have made them appear brighter in the poorer quality photographic photometry. In contrast the data show very good agreement with our data, although there is some indication that the photographic colours are too blue by about 0.05. We have inspected our images and can see no problems with our photometry of the star called E3 by Eggen (labelled in Fig. 6). This may well have been misidentified in Eggen (1972), which is reinforced by the agreement of our value with that obtained by Hawley et al. (1999) for the same star. The scatter in the residuals for Figs. 6 and 7 are in line with our estimates of the errors in these datasets, although the Eggen photoelectric photometry appears to show more scatter than that of Dachs & Kabus.
Turning to Fig. 8 we again have reasonable agreement. There is a systematic offset of about 0.04 magnitudes in (in the sense that the Hawley et al. photometry is brighter) and a suggestion that this reverses for the faintest stars in the sample. We note that as Hawley et al. only published data for cluster candidates, all these very faint stars are also very red. It therefore suggests that there may be minor problems with either their or our colour-dependent terms in the transformation equations. We re-iterate that we did observe Landolt (1992) stars as red as and we are certainly confident in our calibration to this point (and the colour term is very small in any case for our CCD and filter combination). This pattern is repeated for the comparison, where Hawley et al.’s colours are blue by about 0.04 magnitudes compared with ours, with a definite reversal in the brightest stars. The scatter in the residuals of both comparisons is almost precisely in accord with the error estimates given by Hawley et al. and in this paper. We have no explanation for the very discrepant point HTR103 (labelled on the diagram), other than perhaps a major stellar flare occurring during Hawley et al.’s observation.
3 Selection of Candidate Cluster Members
3.1 Selection philosophy
We have used the photometric catalogue to attempt a preliminary selection of cluster members based only on photometric criteria. This selection procedure is especially useful because it does not rely on any characteristic of the cluster members which one might choose to investigate – for instance coronal X-ray emission. Such a catalogue of cluster candidates will be unbiased with respect to magnetic activity, rotation rate or lithium depletion and therefore provides an ideal starting point for such investigations (see Jeffries et al. 1998; Micela et al. 2000; Harnden et al. 2001; Sciortino et al. 2001).
We must provide a caveat here; our selection procedure is arbitrary to some degree, and will exclude some genuine members and will include some non-members. We will fashion our photometric selection criteria so as to avoid excluding the vast majority of cluster members. The interested reader should easily be able to generate membership catalogues using their own (possibly more restrictive) criteria. Ideally these catalogues should then be refined using other unbiased indicators of membership such as proper-motions or radial velocities.
Our CCD data combined with the SuperCOSMOS scan of the 1977 epoch Schmidt plate (see Sect. 2.2) did allow a preliminary attempt at proper-motion selection for the fraction of the catalogue which had good photographic positions. We found that the best accuracies achievable were about 6 milli-arcseconds year-1 in each coordinate. We calibrated the cluster mean proper motion using known members from Jeffries et al. (1998), and found it to be essentially zero within the errors. It was soon discovered that even for the most accurate data, we were unable to exclude more than about 10 percent of the general field background contamination whilst including more than 90 percent of the cluster members. We will not present these preliminary proper motion results in this paper, but will await a second epoch CCD survey which should be capable of producing more precise and useful results.
Our selection philosophy is therefore restricted to using the two CMDs ( vs and vs ) to select stars close to a cluster isochrone and then to check the colour-colour diagram for consistency.
3.2 Isochrone generation

We used 150 Myr approximately solar metallicity () isochrones generated from the models of Siess, Dufour, & Forestini (2000) over the mass range . These isochrones were provided in the form of bolometric luminosity versus effective temperature and had to be transformed into the observational plane. We did not use the photometric colours provided with the models. The critical step here is the relationship between colour and effective temperature, which is highly uncertain, especially among cooler stars.
The procedure we adopted is as follows: We obtained a catalogue of photometry of the Pleiades (courtesy of the Open Cluster Database operated by J. Stauffer and C. Prosser) and supplemented this with photometry of cooler Pleiades members presented by Stauffer et al. (1998a). indices on the Kron system were converted to the Cousins values using transformations in Bessell & Weis (1987). We posit that there is a single colour- relationship which applies to all stars of approximately the same age as the Pleiades, for which we assume an age of 120 Myr, a distance modulus of 5.6, a reddening of , and extinction of (see Stauffer et al. 1998a; Stauffer, Schultz, & Kirkpatrick 1998b). Note that the exact values of these quantities have very little influence on the membership selection for NGC 2516 but could affect the deduced distance modulus or metallicity for the cluster from isochrone fitting.
An empirical isochrone is fitted (by eye) to the Pleiades data (in both and CMDs), ensuring that the isochrone is not biased upward by the presence of binary cluster members (see Fig. 9). At about 25 fiducial points along these empirical isochrones we determine absolute magnitudes and colours, which are then converted to bolometric luminosities using bolometric correction-colour relationships from polynomial fits to the empirical data in Flower (1996) for , and a combination of empirical data from Leggett et al. (1996) for and the atmospheric models of Bessell, Castelli, & Plez (1998) for . Judging by the scatter around these relationships and by comparisons with other bolometric correction-colour relationships (e.g. Monet et al. 1992) we estimate systematic errors of no more than a few hundredths of a magnitude (at least over the colour range we are interested in). This contrasts markedly with the uncertainties if one tries to use a bolometric correction- relation, which is often what has been done in the literature to convert models to observables.
Having obtained luminosity as a function of intrinsic colour, we then use the assumed age of the Pleiades to obtain the value appropriate for a particular luminosity, by interpolating along the 120 Myr model isochrone. This in turn defines a set of colour- points which can then be used to transform any other model isochrone.
The net result is that we have well calibrated isochrones over the colour range defined by the fiducial Pleiades data (or the mass range of the models – whichever is more restrictive). In practice this means and . The hotter limit to the range is defined by a lack of photometry for hotter Pleiades stars. For the sake of defining an isochrone for membership selection, we have extended this data back to by transforming the hot star data into using relationships defined by Johnson (1966) (between and Johnson ) and then Bessell (1979) (between Johnson and .
The 150 Myr isochrones were transformed into the and CMDs, and reddening and extinction applied for NGC 2516 (, – see Dachs & Kabus (1989) and Jeffries et al. (1997, 1998) – and an assumed ). We then adjusted the intrinsic distance modulus of the isochrones to match the data, particularly for in the CMD and for and in the CMD, where contamination by field stars appears to be small (see Sect. 3.4). The results are shown in Figs. 2 and 3, where a distance modulus of 8.10 has been applied to both the and CMDs, with estimated uncertainties of .
This procedure is quite robust to the assumed ages of the Pleiades and NGC 2516, because for all but the very hottest and coolest stars, changing the age by as much as 50 Myr makes little difference to the isochrones. It is also robust to the choice of evolution model, because we require the models to fit the Pleiades at a similar age. We obtain essentially an identical fit to the NGC 2516 data using 150 Myr isochrones from D’Antona & Mazzitelli (1997) and with the same distance moduli as above (see Fig. 10).
Of more consequence is the possibility that the metallicity of NGC 2516 is sub-solar by a factor of two (Cameron 1985; Jeffries et al. 1998; Pinsonneault et al. 2000). If this is the case then the distance moduli we have obtained will be overestimated because lower metallicity stars are fainter at the same colour. The effect should be larger in the CMD than the CMD because the opacity caused by metal-lines causes blanketing in the band (Alonso et al. 1996). Pinsonneault et al. (1998) have calibrated this effect for F and G stars and indeed used it to calculate the metallicities (and metallicity-corrected distance moduli) for a number of open clusters. Jeffries et al. (1998) and Pinsonneault et al. (2000) used the same approach to calculate a metallicity for NGC 2516 of [M/H]= and -0.26 respectively on the basis of preliminary photometry of known members (from this dataset).
We have checked the effects of a low metallicity by using a 150 Myr isochrone from Siess et al. (2000) with (approximately half-solar metallicity, [M/H]). This is again calibrated using the Pleiades photometry. A question arises as to whether the colour- relation derived empirically from the Pleiades is suitable for a lower metallicity cluster. The index is sensitive to metallicity for warm stars with partially ionized metal lines and is partly the reason that the CMD may be changed more by metallicity than the CMD. However for hot stars () and cool stars () this is not likely to be the cases (see Castelli 1999). Leggett et al. (1996) also show that the colour index is a good temperature indicator with relatively little metallicity sensitivity for cool stars () and line blanketing in the band is not expected to be very important for hotter stars. Thus to first order, this approach to generating a low metallicity observational isochrone should be valid.
We find that the solar and half-solar metallicity isochrones yield comparable fits to the data. As expected, the distance moduli required to fit the data are smaller for the lower metallicity models. We find distance moduli of and for the and CMDs respectively. These distance moduli are in excellent agreement with the in Jeffries et al. (1997) and found by Jeffries et al. (1998), but a little larger than the deduced by Pinsonneault et al. (2000) and the Hipparcos distance of found by Robichon et al. (1999). We emphasize that our errors are underestimated because they do not take into account uncertainties in the metallicity or reddening.
The isochrones are compared in Fig. 10, where we also include the solar-metallicity D’Antona & Mazzitelli (1997) model. The isochrones have been shifted to the distance moduli required to give a reasonable fit to the observational data (which is not shown for clarity of comparison between the models). The most important point to make is that the shapes of the models are extremely similar. The main discrepancy occurs in the cool part of the CMD, where low metallicity stars lie just less than 0.1 magnitudes below solar metallicity stars of the same colour. This is fortunate, because it means irrespective of which model/metallicity we choose, the selection of cluster members by photometric means is almost unaffected – although cluster properties such as the mass function are (see Sect. 4.2). A more detailed investigation of the metallicity, distance and reddening is left to another paper that uses a more complete sample of spectroscopically confirmed NGC 2516 F and G stars (Terndrup et al. 2001).
3.3 Membership criteria
To select the members we apply the following criteria, based on the Siess et al. (2000) solar metallicity isochrones:
-
1.
If a colour is available, the star must have within a region bounded by 0.1 mag below the cluster vs isochrone, and 0.85 mag (to include binary stars and allow for the uncertain metallicity – see Sect. 3.2) above it. Additionally we allow an extra 2 error in (see Table 2), which also incorporates a (usually dominant) contribution from the error, which is added in quadrature to the error by assuming a gradient in the CMD appropriate for a cluster member at that colour.
-
2.
If a colour is available then the star must satisfy a similar condition in the vs CMD. At faint magnitudes (), the cluster isochrone steepens. For these stars we additionally allow a cluster member to lie within of a band running mag in either side of the cluster isochrone.
-
3.
If and are both available, the star must lie within mag. (in ) of the cluster locus in the colour-colour diagram (see Fig. 4). Again, we allow an extra slop of 2 which includes contributions from both the and errors added in quadrature. The vs cluster locus is calculated by combining and interpolating the two CMD cluster isochrones. Redder than this locus steepens and similarly to test 2 above, we allow a cluster member to lie within of a band running mag in either side of the cluster locus.
-
4.
Finally, if the star passes test 1, it is classed as a binary candidate if it lies more than 0.3 mag in above the vs isochrone. This should select unresolved binaries with mass ratios of approximately 0.6-1 (see Sect. 4.3).
The full catalogue contains 15 495 stars. Of these we find that 11 114 have a value, 15 310 have a value and 10 929 have both. 1499 stars pass test 1, 1295 stars pass test 2 and 920 stars pass them both, of which 881 pass test 3. However, in order to be classed as a cluster member we only require that the star should not fail any of these tests. Therefore we include 368 stars which have no colour but pass test 1. These are almost all very faint, red cluster candidates. We also include 5 stars which possess no but pass test 2. The final membership catalogue therefore contains 1254 candidates. Figures 2, 3 and 4 show these cluster candidates with different symbols indicating how they have been classified. Of the 1254 cluster candidates, 403 are possible unresolved binary systems. Flags corresponding to the status of stars with respect to these tests are appended to the catalogue in Table 3.
3.4 Contamination by non-members

Whilst we are reasonably confident that our membership criteria should have included the vast majority of true cluster members (within the bounds of our photometry completeness), it is clear looking at Figs. 2 and 3 that we have also included contaminating foreground and background sources. As we have taken no offset fields of the cluster, we attempt to estimate membership probabilities and quantify this contamination by interpolating the distribution of cluster non-members in the CMD.
We proceed by removing the cluster candidates from the catalogue and then select stars in several strips in the CMD, both above and below (but parallel to) the fiducial cluster isochrone (from 1.2 magnitudes below to 2.0 magnitudes above), but beyond the limits defining membership. We fit a smooth function to the density (number of stars per magnitude interval) of contaminating stars along vertical strips (colour ranges) in the CMD. We achieved the best looking fits using the sum of a constant density and an exponential decay with an e-folding length of 0.5-0.9 mag. An example is shown in Fig. 11. The fitted function is then integrated over the range in which cluster members were selected, in order to estimate how many contaminating stars we expect to fall within the membership selection region. Because the contamination tends to decrease quite sharply as we move above the cluster isochrone we subdivide this range further in an attempt to estimate how much contamination there would be among single and binary star candidates separately. This was achieved by integrating the the interpolating function above and below a line 0.3 mag. above the cluster isochrone (see Sect. 3.3). These figures are then reduced by the number of objects which passed test 1, but failed tests 2 or 3, because we argue that these must be part of the contaminating sample. Finally we subtract the remaining contaminants from the number of cluster candidates in the same magnitude range and divide by the number of cluster candidates to estimate the probability that a cluster candidate is a genuine cluster member. At the same time we can see what advantage has accrued from using more than one colour in assessing cluster membership, by finding what fraction of the contamination in the CMD has been rejected using .
The results are given in Table 4, where we have split the sample into colour ranges which roughly correspond to 1 magnitude intervals for single stars in the cluster. Such crude binning is necessary in order to have enough stars (especially in the CMD strips above the cluster isochrone) to yield reliable fits for the interpolating function. We have also assumed that all hotter candidates (roughly brighter than ) are members.
| 0.53-0.70 | 0.70-0.87 | 0.87-1.05 | 1.05-1.33 | 1.33-1.68 | 1.68-2.04 | 2.04-2.42 | 2.42-2.73 | 2.73-3.02 | |
| Observed | |||||||||
| Single Candidates | 31 | 61 | 51 | 115 | 67 | 66 | 119 | 146 | 106 |
| Binary Candidates | 17 | 41 | 37 | 62 | 27 | 23 | 40 | 40 | 47 |
| Predicted | |||||||||
| Single contaminants | 6 | 38 | 40 | 63 | 14 | 19 | 25 | 63 | 31 |
| Binary contaminants | 5 | 18 | 25 | 55 | 15 | 11 | 22 | 39 | 26 |
| Rejected | |||||||||
| Single contaminants | 6 | 22 | 16 | 32 | 13 | 13 | 17 | 26 | 1 |
| Binary contaminants | 3 | 8 | 4 | 27 | 11 | 11 | 5 | 19 | 11 |
| Membership Prob. | |||||||||
| Single candidates | |||||||||
| Binary candidates |
The results in Table 4 can now be used to correct statistical ensembles for contamination (e.g. in investigating the luminosity function – see Sect. 4.1). We caution however that these membership probabilities are averages over our field of view. Because the cluster is centrally concentrated (see Fig. 1 and Sect. 4.5) and we expect that the background contamination has a uniform spatial distribution, membership probability will be higher for a cluster candidate close to the cluster centre and lower for a candidate near the edge of our survey area.
The contamination is worst for () and a glance at Fig. 3 confirms that this is where the two “fingers” of contamination caused by main sequence and background giant stars respectively, cross the cluster isochrone. Candidates from () suffer very little contamination, but note that this is largely because the addition of data removes the majority of the contamination in the CMD. For () there is growing incompleteness in the band as well as a growing number of contaminants from the CMD alone, resulting in a drop in the discrimination in our membership selection. We expect that the level of contamination is underestimated for the coolest bin (approximately ) in Table 4, because the data below the cluster isochrone in the CMD is incomplete. The errors in the membership probabilities are estimated assuming Poisson errors in the numbers of candidate members, the numbers of candidate members rejected on the basis of their and the numbers of predicted contaminants in the CMD. This latter error is an overestimate, because the contaminant numbers arise from modelling populations several times larger. In any case, these errors are similar (as a fraction) to the simple Poissonian errors in the numbers of cluster candidates in each colour bin. In what follows we will simply assume that the contamination fraction is known accurately, but will compare our results with what would have been obtained without any correction for contamination.
It is of interest to compare the estimates above with information appearing in the literature. Jeffries et al. (1998) used a similar photometric selection technique to choose a cluster candidate list. These were subsequently followed up with spectroscopy. In that paper, 22 out of 31 objects with were confirmed as members based on their radial velocities. This is perfectly consistent with the estimates in Table 4.
Hawley et al. (1999) did do an offset field (about 1 degree from the cluster centre) covering 225 square arcminutes in and only. It is not clear (see Sect. 4.5) that this is far enough from the cluster centre to guarantee no cluster members and indeed Hawley et al. spectroscopically identified a few low mass NGC 2516 candidates in this field. However, we can use similar membership criteria to those in our survey to find how many bogus NGC 2516 members we might expect in a 225 square arcminute area. This is then multiplied by 13.7 to match our survey area. The total number of contaminants expected in the CMD (to be compared with the sum of rows 3 and 4 of Table 4) are for (compared with 212 in Table 4), and for (compared with 179 in Table 4). The former estimate is in good agreement with our own, but the latter is a little higher, perhaps indicating that there are indeed some low mass NGC 2516 members even 1 degree ( pc) from the cluster centre.
4 Luminosity and Mass Functions
The CTIO catalogue of candidate members, together with the estimates of contamination in Table 4, allow us to make a preliminary investigation of the luminosity and mass functions (LF and MF) of NGC 2516 (that is the number of stars per magnitude interval and the number of stars per logarithmic mass interval).
4.1 Luminosity Function


The CTIO candidate membership catalogue is incomplete for , but is also incomplete for brighter stars because of saturation in the CCD frames. As discussed in Sect. 2.4, there were 68 objects from the catalogue of bright stars in the NGC 2516 field compiled by Jeffries et al. (1997), which are not present in the CTIO catalogue. 55 of these objects (which have and photometry) reside within our CCD frames and 48 have photometry consistent with main sequence cluster membership. These should be included when calculating the LF and MF, and, because Jeffries et al. (1997) estimate that this bright catalogue is complete to , we then have an almost complete catalogue of cluster members from , covering a mass range of approximately (the upper limit being rather age, model and metallicity dependent).
Figure 12 shows the LF of the candidate members without a correction for contamination. The plot shows the LF due to candidates selected using both and and also the complete candidate list (including the brighter stars discussed above and those stars classed as members for which either or are unavailable). We also mark on the plot the approximate faint magnitude completeness limits for these two samples (discussed in Sect. 2.3).
The rapid fall off at faint magnitudes coincides with our estimates of where the survey begins to be significantly incomplete. There appears to be a minimum in the LF for , which was also commented upon by Hawley et al. (1999). However, we might suspect that this feature merely results from the inclusion of many background contaminants at slightly brighter magnitudes (see Table 4 and Fig. 3), resulting in the peak at . An NGC 2516 LF corrected for contamination by non-members and plotted with on the x-axis (assuming an apparent distance modulus of 8.3) appears in Fig. 13. We compare this with LFs from the field (Reid & Hawley 2000) and the Hyades (Reid 1992; Reid & Hawley 2000), which are normalised to match NGC 2516 for . The correction for contamination in NGC 2516 is applied by making each star worth in the luminosity histogram according to it’s colour and whether it is a photometric binary candidate, using the fraction of such stars which are likely to be members according to Table 4. For instance, a candidate member with and which is flagged as a probable binary system will only contribute 0.43 to the LF bin corresponding to its magnitude. All the very bright candidate members without are assumed to be genuine members.
The NGC 2516 LF in Fig. 13 exhibits both similarities and differences when compared with the LFs of the field, the Pleiades (which is almost identical to the field LF – Hambly, Hawkins, & Jameson 1993; Meusinger, Schilbach, & Souchay 1996) and the Hyades. The LF is consistent with a monotonically rising curve at least as far as ( in NGC 2516). There are relatively more bright stars in NGC 2516 than the field because it is a very young cluster. There is then, despite the correction for contamination, a significant minimum at (), that coincides with the “Wielen dip” (see Wielen 1974; Upgren & Armandroff 1981; Bahcall 1986) – that is also seen (at the level of 30-40 percent) in the LFs of the field, the Pleiades and the young Persei cluster at (Prosser 1992; Meusinger et al. 1996; Belikov et al. 1998; Reid & Hawley 2000) and in the Hyades at (Reid 1992). This dip is defined with reasonable clarity in NGC 2516, due to the large numbers of cluster members. There is some evidence that the overall rise in the LF towards fainter magnitudes then levels off for and certainly there is no sign of the very steep rise in the LF of a factor 2-3 between , that is seen in the Pleiades and nearby field stars. In this respect, NGC 2516 is much more similar to the Hyades.
We do not believe that incompleteness can be responsible for a lack of faint stars in NGC 2516. We have calculated that the LF is complete to at least , in the sense that stars are not missed because they were not detected. Perhaps then the LF of NGC 2516 is different to that of the Pleiades and the field, but there are other possibilities: First, it may be that that the contamination fraction is increasingly overestimated for or underestimated for . We regard this as unlikely and in fact for the last column in Table 4, we believe the contamination fraction is probably underestimated (see Sect. 3.4). Second, we may have set our membership criteria too tightly and missed a significant fraction of fainter cluster members that lie either above or below our membership bounds in the CMD. We already regard our membership criteria as quite generous and thus the factor of approximately two increase in the LF that would be required between , seems unlikely to be explained in this way. Third, it might be that mass segregation has been successful in removing lower mass stars from the central cluster regions and hence our survey. This has been put forward as an explanation of the differences between the Hyades and field LFs (Reid & Hawley 2000) and although NGC 2516 is much younger than the Hyades, we have only surveyed the central regions. Mass segregation is discussed in more detail in Sect. 4.5. Lastly, it is possible that the mass function in NGC 2516 is similar to that in the Pleiades, even though the LF is not. This might be the case if the mass-luminosity relationship were markedly different at low masses because NGC 2516 has a low metallicity compared with the Pleiades. This possibility is discussed in Sect. 4.2.
4.2 Mass Function

The cluster MF can be explored in a preliminary way by calculating the mass of each candidate member using a mass-colour relationship derived from the isochrones we used to fit the cluster CMD. Unresolved binarity is of course a problem here. The net result of assuming that unresolved binaries are single stars, will be that the true MF will be slightly steeper than that derived (in the sense that an assumed single star of a given mass is actually two stars, one of which could have a much lower mass – see below). In principle, the numbers of low mass stars could be doubled by hiding them in binary systems with more luminous companions.
The binarity in NGC 2516 and its effect on the derived MFs is discussed further in Sect. 4.3, but we note that in Sect. 3.3 we identified candidate members which are approximately equal mass binary systems based on their position above the cluster isochrone. Using the CMD we can also identify candidate binaries from among the bright stars added to the CTIO sample from Jeffries et al. (1997). Each identified binary system is counted as if it consisted of two identical components with the same colour. This is an approximation, because for objects with mass ratios less than unity, one component will be cooler. However, in the absence of better binarity information, a more complex approach is not warranted. Corrections for contamination by non-members are applied by using the fractional membership probabilities in Table 4. Each candidate will contribute a fraction to the MF bin corresponding to its mass, according to the value of (or if is unavailable) and whether it is a candidate binary.
The mass-colour relationships are derived from the same evolutionary models and empirical isochrones used to select the cluster candidates in the first place. The uncertain metallicity of NGC 2516 causes some difficulties here. Stars of a given colour have smaller masses at lower metallicities. We perform our calculations using the solar and half-solar metallicity models of Siess et al. 2000 and the solar metallicity model of D’Antona & Mazzitelli (1997), which were discussed in Sect. 3.2. Note that we choose to use , rather than , as the primary indicator of and hence mass, because it is relatively insensitive to metallicity (Leggett et al. 1996) and covers a wider range of masses. Only the hottest stars have their masses calculated from , where is an almost metallicity-independent proxy (Castelli 1999), so the fact that we have ignored the metallicity dependence of the - relationship in deriving the low-metallicity isochrone should be unimportant (see Sect. 3.2).
The corrected MFs are shown in Fig. 14, expressed as the number of stars per unit logarithmic mass interval, as a function of logarithmic mass (in solar units). The approximate lower mass limit at which our survey is complete (corresponding to ) is about for the solar metallicity models and for the half-solar metallicity model. In these diagrams, the canonical stellar initial MF of Salpeter (1955) would be a straight line of the form with .
Our MF for NGC 2516 is well defined between 3 (where any uncertainty in the age of NGC 2516 would start to be a factor and also where small number statistics become important) and 0.25–0.3 (where incompleteness sets in). Note that below the completeness limit we cannot simply say that the points are lower limits because there is also the uncertain level of contamination by cluster non-members to consider. For each of the two metallicities, there is a clear Salpeter-like rise in the MF as the mass decreases, followed by a peak at and a turnover towards lower masses. We have checked that the corrections for contamination by non-members and for binaries have very little effect on this overall shape.
The exact form of the MF might of course be age, model and metallicity-dependent. Barrado y Navascués et al. (2001) investigated the MF of M35, a rich northern hemisphere cluster of similar age to the Pleiades and NGC 2516, using a variety of ages and (solar metallicity) evolutionary models. Their results show that above , derived MFs are virtually identical in all cases.
We have parameterised our derived MFs in terms of two power law fits in the range 0.3–0.7 (or 0.25–0.7 for the half-solar metallicity model) and 0.7–3.0. For the higher mass range we find and for the solar and half-solar metallicity models of Siess et al. (2000), and for the solar metallicity model of D’Antona & Mazzitelli (1997). For the lower mass range we find and for the solar and half-solar metallicity models of Siess et al., and for the solar metallicity model of D’Antona & Mazzitelli. The systematic difference between the models is caused by the change in the colour-mass relationship. At lower metallicities, stars of the same colour have lower masses, increasing the value of , but there is also some modest model-dependence. For simplicity of discussion in what follows we shall only use the two Siess et al. models. We have also done all our calculations for the solar metallicity D’Antona & Mazzitelli (1997) model and the results it yields in later sections are in reasonable agreement with the Siess et al. solar metallicity model.
The power law fits to the higher mass range are in good agreement with the Salpeter value, agree well with the average value of found for intermediate mass stars in many open clusters by Phelps & Janes (1993) and are close to the “universal” field initial MF of for found by Kroupa (2001). We also note that these quoted results neglect the effects of binarity and used a single relationship between and mass to calculate the MF from the LF. This has the effect of making the MF slightly less steep at high masses because binary systems are then treated as one star with a slightly higher mass. We have investigated what difference this makes by simply treating our data in the same way. If we were to adopt a single relationship between and mass, irrespective of binary status, then the slopes of our derived MFs would be smaller by about 0.2 and hence in even better agreement with the previously published values.
Determinations of the MF in the Pleiades (Meusinger et al. 1996) and M35 (Barrado y Navascués et al. 2001) clusters find MF slopes of and for stars with . Meusinger et al. then find that in the Pleiades for 0.3–1.0, whilst Hambly et al. (1999) estimate for in the Pleiades and Barrado y Navascués et al. finds for M35 between 0.8 and 0.2. The latter two slopes take no account of binarity and should probably be increased by (see above) before comparison with our results. At very low masses it is likely that the MF falls again. Bouvier et al. (1998) and Moraux, Bouvier, & Stauffer (2001) find and across the brown dwarf boundary at –0.2 in the Pleiades and Barrado y Navascués et al. estimate a more extreme slope of below 0.2 in M35. This behaviour is mirrored in the field MF, where a Salpeter-like slope is found above , a relatively flat MF with an of to down to , and then a decline into the brown dwarf regime with between and (Gould, Bahcall, & Flynn 1997; Reid et al. 1999; Chabrier & Baraffe 2000; Kroupa 2001).
If NGC 2516 has a solar metallicity, then its MF drops much more sharply towards lower masses than occurs in either the Pleiades or field for . This steep slope is of course directly related to the deficit of low luminosity stars in the NGC 2516 LF with respect to the Pleiades and the field which we remarked upon in Sect. 4.1. Any of the explanations offered there (such as mass-segregation) might make the drop in the MF below 0.7 less extreme. A Pleiades-like MF could still be recovered for the solar metallicity scenario if the number of NGC 2516 members between 0.3 and 0.5 were roughly doubled with respect to the more massive stars. If NGC 2516 has a half-solar metallicity then the discrepancy with the Pleiades and field MFs is reduced but still present.
4.3 Binarity

The frequency of binary systems and the distribution of their mass ratios are important constraints on star formation theories. So far in this work we have made a partial correction for binarity in determining the cluster MF, by identifying cluster candidates with near equal mass ratios (). Unresolved binarity will also influence the deduced total mass of the cluster (see Sect. 4.4). We have also not considered the possibility of triple systems in this paper, which could place an object up to 1.2 mag. above the cluster isochrone (for equal mass components). However, the numbers of missed triple systems should be quite rare – less than 2 percent of systems in the Pleiades (Mermilliod et al. 1992).
Figure 15 shows the fraction of photometrically identified binaries as a function of colour in NGC 2516, where membership was determined from the solar metallicity isochrone of Siess et al. (2000). The binary fraction is defined as the number of probable binary systems divided by the total number of systems. The fractions are calculated using our membership catalogue, the binarity flags and the membership probabilities in Table 4. The weighted mean binary fraction is percent with marginal evidence (at the 90 percent confidence level) for a decrease in the binary fraction towards lower masses. This may be more significant, as we expect the lowest mass bin in Fig. 15 to have an overestimated binary fraction, because incompleteness sets in and will bias against single star detection. It is also the case that low mass M-dwarfs are more prone to flaring, which might result in some fraction of the lowest mass single stars being misclassified as binaries (see Stauffer et al. 1984). The confidence level for a significant downward trend increases to 98 percent if this last point is excluded. On the other hand, the error in the binary fraction should be increased to take into account the somewhat arbitrary nature of the isochrones we have used to define the cluster single star sequence. If we allow these isochrones to move up or down by magnitude (see Sect. 3.2), the mean binary fraction changes by percent. As we discussed in Sect. 3.2, the shape of the half-solar metallicity isochrone is slightly different for , which would result in a differential increase in the binary fraction of cool stars with respect to the hot stars of about 5 percent. This would be enough to remove the possible trend just discussed, so it is premature to claim to have seen any dependence of binary fraction on mass.
The binary fraction estimated in this way is a lower limit. The mass ratios to which our photometric identification technique is sensitive, can be estimated using the results and equations found in Kähler (1999). We note that the sensitivity limit is not quite independent of colour for stars 0.3 mag above the single star locus, because the gradient of the vs cluster isochrone is not constant. Using equation 5 in Kähler (1999) and the gradients determined from the cluster isochrone we find that we are sensitive to for , for , for and for . Given an approximately flat distribution of or one that rises towards lower values, any small variations in apparent binary fraction seen in Fig. 15 could also be partially explained by this varying sensitivity.
In field stars, Duquennoy & Mayor (1991) found that the mass ratio distribution increased towards lower mass ratios, perhaps peaking at , and that the binary fraction of solar-type stars was about 70 percent for all mass ratios, and 21 percent for . Work on the Pleiades solar-type stars is in broad agreement with these results (Mermilliod et al. 1992; Bouvier, Rigaut, & Nadeau 1997). There is some evidence that the binary fraction among lower mass field objects is smaller (30-40 percent), but that they are more inclined to be found in systems (Fisher & Marcy 1992; Reid & Hawley 2000). Using a similar photometric selection technique to the one used here, Stauffer et al. (1984) found that 26 percent of Pleiades low mass stars () were more than 0.3 mag. above a single star isochrone and that this was similar to the 22 percent photometrically determined binary fraction in hotter stars found by Bettis (1975).
The main result of this subsection is that the binary fraction in NGC 2516 for stars with in the approximate range 0.6-1 is similar to that of the Pleiades or the field, when the binaries are identified in the same way. If the distribution of were that proposed for the field by Duquennoy & Mayor (1991), down to , then the total binary fraction in NGC 2516 would be about 85 percent. If the distribution of were flat, then the total binary fraction would be 65 percent.
A subsidiary consideration is estimating what effect unresolved binarity might have on the derived mass functions. Our identification of binaries, where the companion star can significantly change the colours and magnitudes of the system as a whole, results in MFs which have slopes about 0.2 larger than those where this is ignored (see Sect. 4.2). These MFs have the merit of beoing obtained from observables which are in principle comparable with other estimates derived from photometry data in other clusters, and do not rely on knowledge of the mass ratio distribution. However, even for those systems with there can be a significant number of “hidden” lower mass stars, resulting in a MF for all stars which is even steeper still. Sagar & Richtler (1991) investigated this effect in 2-14 stars in LMC clusters. They found, for true MFs with , a binary fraction between 0.5 and 1, and binary companions drawn randomly from the same MF, that the observed MF (estimated from a mass-magnitude relation) had a slope that was 0.3-0.4 smaller. The effect was even larger for smaller values of . A true of might appear as for a binary fraction of 1.0. Similar simulations by Kroupa (2001) yield differences between the system and single star MFs largely in agreement with these results.
We point out to the reader that by using a colour-mass relation and identifying and dealing with binaries, we have partially alleviated this problem. To try an gauge by how much the true stellar MF slopes might be further increased over the quoted MF slopes in this paper, we randomly added binary companions to a fraction of the “single” stars. Using a total binary fraction of 65 percent and a flat distribution we find that the true single-star MF is increased by a further 0.05 for and 0.3 for (using the Siess et al. 2000 solar metallicity models). Using the distribution proposed for field binaries by Duquennoy & Mayor (1991) and assuming a total binary fraction of 85 percent, results in increasing by 0.1 and 0.4 in these two mass ranges.
4.4 The cluster mass
We can integrate our corrected MF (from the solar metallicity isochrone) to yield an estimate of the total mass of the cluster (down to about 0.3) of 1105. More than half of this mass is contained in stars with 0.6-2 with decreasing contributions at lower and higher masses. The equivalent calculation for the MF derived from the half-solar metallicity isochrone is 945 (complete to 0.25).
Unresolved binarity will increase the derived cluster mass. We have made a partial correction for this in our work so far, by identifying near equal mass-ratio binary systems. If we had not done so, our deduced cluster mass would have been only 880 (solar metallicity). To estimate the maximum likely contribution that could arise from binaries with , we can use the distribution proposed for field binaries by Duquennoy & Mayor (1991) and assume that the total binary fraction is 85 percent and independent of primary mass. Integrating this distribution, we find that the cluster would be 35 percent more massive than if all the stars were single, and thus the total cluster mass would be 1190 (solar metallicity), for primaries with . A correction could also be applied for stars less massive than this. Integrating an extrapolated MF derived from the Siess et al. (2000) solar metallicity isochrone (see Sect. 4.2) from say 0.0-0.3, yields only another 73. The corresponding additional mass for the half-solar metallicity model is (0.0–0.25). Thus irrespective of the cluster metallicity, the contribution of low-mass stars and brown dwarfs to the total cluster mass inside our surveyed area is likely to be less than 10 percent unless there were a sharp upturn in the MF below 0.3.
The cluster mass is similar, but a little higher, than that found for the Pleiades in the same mass range. Meusinger et al. (1996) quote a figure of 800 for and Pinfield et al. (1998) derive 735 for all masses down to the substellar limit. However, we have to be careful to compare like with like. The quoted Pleiades results are extrapolations for all stars out to the cluster tidal radius.
Pinfield et al. (1998) give an approximate expression for the tidal radius of a cluster in a circular Galactic orbit, close to the Sun as
| (4) |
where is the cluster mass and and are the Oort constants in the solar neighbourhood. Using the value of from Kerr & Lynden-Bell (1986), this reduces to , with in solar masses and in parsecs. If we take 1000 as the minimum mass for NGC 2516, pc.
Using a distance modulus of 7.9, our survey of the cluster covers a square area, 6.2 pc on a side. Thus we expect significant numbers of cluster members outside the area covered by our survey. Pinfield et al. (1998) find that the Pleiades has pc and that although the high mass stars are highly concentrated within a few pc of the cluster centre, there are significant numbers of low mass stars at much greater distances, such that only half the cluster mass was contained within 3.66 pc. If NGC 2516 is analogous to the Pleiades in terms of the spatial distribution of its members and the amount of mass segregation present (see Sect. 4.5), then the total cluster mass might be significantly greater than just what we have observed in our limited survey.
4.5 Mass segregation

Dynamical evolution and mass segregation can have a significant effect on the shape of the present day LF and MF of NGC 2516. Equipartition leads to a growing core radius with decreasing mass and the preferential evaporation of low-mass cluster members (see for example de la Fuente 1995; Kroupa 1995; de la Fuente Marcos & de la Fuente Marcos 2000; Kroupa, Aarseth, & Hurley 2001). The evidence for dynamical effects on the MFs of open clusters older than a few hundred Myr is strong (e.g. Reid 1992; Montgomery, Marschall, & Janes 1993; Sarajedini et al. 1999). The segregation effects are less obvious, but still seen, in younger clusters like the Pleiades and M35 (Pinfield et al. 1998; Barrado y Navascués et al. 2001), with a hint that equipartition has not been achieved in the lowest mass stars, perhaps because these clusters have ages similar to their dynamical relaxation timescales.
As a step towards understanding how much mass segregation might have taken place in NGC 2516, we examine the radial surface density profiles of candidate cluster members split up into bins according to their colours and hence masses. We exclude binary candidates at this stage, because their colours are not reliable mass indicators – they could be up to twice as massive. We have to acknowledge though that we must have included some binary stars with , which will have the effect of blurring any distinction between different mass bins, perhaps lessening the effects of mass segregation. In order to have sufficient stars to draw statistically significant conclusions we divide the stars into just 4 mass bins (see Table 5). The division is made preserving the colour boundaries in Table 4, so that estimates of field star contamination can still be made. We do not include the lowest mass interval from Table 4 because of possible uncertainties in the exact level of contamination (see Sect. 3.4). Note that the values for the boundaries of the mass bins are derived from the solar metallicity Siess et al. (2000) isochrone. The corresponding mass boundaries in Table 5 for the half-solar metallicity would be: 1.38, 0.79, 0.58 and 0.27.
The centre of mass for each bin is determined by minimising the projected moment of the stars about a point. The centres drift south-west by about 2.5 arcminutes between the highest and lowest mass bins. This small drift has no effect on our results, which would be almost identical if we had fixed the cluster centre at a single position. The surface density of stars as a function of radius (assuming a cluster distance modulus of 7.9) is then calculated for each mass bin, taking account of the geometry of the surveyed area.
The results are shown in Fig. 16. The horizontal dashed line in each plot indicates the (assumed uniform) density of contaminating objects. It now becomes clear that the probability that a candidate member is actually a contaminating object shrinks drastically if we only consider objects within arcminutes ( pc) of the cluster centre. Conversely, if we consider objects in the outer part of our survey, the probability of membership is lower than the average values in Table 4.
| Mass | Centre | ||||||||
|---|---|---|---|---|---|---|---|---|---|
| subset | () | (J2000.0) | (pc) | (stars/arcmin2) | |||||
| RA = 7 58 03.2 | 14.6 | 0.223 | 0.0 | 7.7 | 92 | 113 | |||
| Dec = -60 45 29 | 18.4 | 0.218 | 0.0 | 7.8 | 92 | 121 | |||
| RA = 7 58 05.6 | 14.6 | 0.228 | 0.013 | 10.9 | 103 | 126 | |||
| Dec = -60 46 48 | 18.4 | 0.225 | 0.013 | 11.0 | 103 | 135 | |||
| RA = 7 57 56.0 | 14.6 | 0.141 | 0.010 | 11.9 | 150 | 196 | |||
| Dec = -60 47 00 | 18.4 | 0.132 | 0.010 | 11.9 | 150 | 216 | |||
| RA = 7 57 48.0 | 14.6 | 0.279 | 0.017 | 13.4 | 280 | 637 | |||
| Dec = -60 47 00 | 18.4 | 0.238 | 0.017 | 13.1 | 280 | 725 | |||
To get some parameterisation of the mass segregation we have fitted empirical profiles of the form (see King 1962)
| (5) |
where is a normalisation constant, is the “core radius”, where the surface density falls to half its central value, and is the tidal radius where the cluster is truncated. The King model assumes that there is no contamination in the sample, so we subtract the levels indicated by the dashed lines in Fig. 16 before fitting. Since our data are confined to regions well within , the fits are relatively insensitive to this parameter. To test this we performed two sets of fits, fixing at either 14.6 pc (corresponding to a minimum cluster mass of 1000 – see equation 4) or 18.4 pc for a cluster mass of 2000, which acknowledges that a significant fraction of the cluster mass may lie outside the CTIO survey.
The fits are all reasonable, with values of between 7.7 and 13.4, with 10 degrees of freedom in each case. The fit results, including 68 percent confidence intervals in , and the assumed surface density of contaminants, are reported in Table 5.
The King profile modelling suggests that the core radius undergoes a dramatic enlargement as the mass decreases from to and that this is independent of the assumed value of . It could be argued that this might be explained in terms of an underestimation of the contamination level in the two lower mass bins. Such an underestimation would lead to a “flatter” distribution of surface density that would then be fitted with a large value of . To test this, we re-fitted the two lowest mass bins with a King profile plus a variable uniform surface density, which simulates an extra unaccounted for level of contamination. The core radius was fixed at 0.9 pc, corresponding to the value of for stars with mass . We found that the values were similar with this model ( values of 13.6 and 11.5 respectively for the same numbers of degrees of freedom), but the levels of contamination implied by the fits (i.e. the extra constant surface density terms) were factors of 3–5 higher than we estimated in Sect. 3.4. This would mean that our estimates of the contamination levels were wildly in error and that only about 35 percent of the cluster candidates with were members in contrast to our present estimate of 84 percent. We do not believe that errors of this extent are possible.
We conclude that the evidence for mass segregation is strong when comparing stars above and below about 0.8. This coincides with the break in slope of the MF and lead us to suspect that the downturns in the LF and MF of NGC 2516 at low masses may be explained by mass segregation (see Sects. 4.1 and 4.2). We can test this by extrapolating and integrating the surface density profiles beyond the extent of the current survey. King (1962) gives an expression for the integral of equation 5 out to the tidal radius, which we use to calculate the total number of cluster stars in each mass bin, , in Table 5. This number can be compared with the actual number of cluster members (corrected for contamination), , to estimate what fraction of cluster stars lie outside our survey. Naturally, such an extrapolation is reliant on a knowledge of the surface density profile outside the area we have surveyed!
The fraction of cluster stars inside our survey decreases from 81 percent for to 44 percent for , if pc. These fractions decrease to 76 percent and 39 percent for the larger value of the cluster mass and .
There are two major implications of this result. (1) The total cluster mass is probably greater than we first estimated. Most of the cluster mass is concentrated in stars between 0.6–2 so it is likely that the cluster is more massive by about a factor of 1.3. (2) The decrease in the MF towards lower masses will be flattened off. Earlier we stated that an increase of roughly a factor of two in the numbers of stars below 0.5 (with respect to the numbers of more massive stars) could bring the LF of NGC 2516 roughly into agreement with that of the Pleiades. The results in Table 5 show that within our survey area the ratio of stars with to those with is 3.0, but that this ratio for all cluster stars is probably as large as 5.6-6.0; approximately the increase required. Taking the results from the lowest two mass bins, and assuming that the correction to the MF will vary linearly (with log mass) from about 1.3 at 0.7 to 2.3 at 0.3, the fitted values of (see Sect. 4.2) would increase from to and from to for the solar and half-solar metallicity models of Siess et al. (2000) respectively.
It is difficult to provide precise corrections to the MF and total cluster mass because our analysis is dependent to a great extent on the assumed form of the surface density distribution outside of the region surveyed and to a lesser extent on the assumed non-member contamination fraction in each bin. For example, if the level of contamination for low-mass stars is higher than we have assumed then: the numbers of low mass stars inside our survey will be smaller; the fitted core radius will decrease and the fraction of cluster members inside the survey will increase; the cluster mass inside the survey will be smaller; the MF will drop more steeply and the total cluster mass will be smaller. To give an idea of the possible size of these effects we ran through our analysis again, but systematically increased the number of contaminants predicted in rows 3 and 4 of Table 4, for the columns with (), by twice their Poisson errors. The results from this were: that the MF slope below 0.6 changed from to ; the cluster mass inside the survey decreased slightly from to 1050; the core radius in the lowest mass bin decreased from 3.5 pc to 2.8 pc; and the fraction of stars with inside our survey increased from 44 to 52 percent. Changes of this order do not affect any of our major conclusions.
5 Discussion
NGC 2516 has been referred to as the “southern Pleiades” on the basis of their similar ages and apparent richness of high mass stars (Eggen 1983). The central questions which we can attempt to answer on the basis of the results presented here are: (1) how similar are NGC 2516 and the Pleiades, in terms of their LFs, MFs, total mass, mass segregation and binarity, especially among low-mass stars? (2) What are the prospects for finding even lower mass objects and brown dwarfs in NGC 2516?
5.1 NGC 2516 and the Pleiades
Of key importance in any comparison with the Pleiades is to make sure we are comparing similar surveys, in terms of their area and completeness. We have seen that our NGC 2516 survey is complete to , () and covers the central pc. The Pleiades is approximately 3 times closer and thus surveys of the Pleiades must cover 9 times the area of our NGC 2516 survey to be equivalent.
Dachs & Kabus (1989) presented the LF for bright stars () in NGC 2516, from a 1 degree diameter central region. They showed that this LF was similar in shape to that of the Pleiades with approximately a factor of two more early-type stars in NGC 2516. There was marginal evidence for mass segregation in their sample, but few stars at this luminosity were estimated to lie outside their survey. On this basis they claimed that NGC 2516 was about twice as massive as the Pleiades, implicitly assuming that the two clusters have similarly shaped MFs at all masses.
The Pleiades survey of Meusinger et al. (1996) covered the central 16.5 square degrees (about pc) and was complete to . The LF shows a relatively sharp increase of a factor at and the MF is quite flat, with (see Sect. 4.2), between . The LF and MF were simply corrected by a linear factor for stars of all masses and luminosities to account for Pleiades stars which lay outside the survey area. Thus no account of mass segregation was taken other than a crude correction to the cluster mass, which resulted in down to stars of . Hambly et al. (1999) derived the MF from a wider 36 square degree survey ( pc) and obtained below 0.5.
Using survey material complete to radii of about 6 pc, Pinfield et al. (1998) show that core radii in the Pleiades increased from about 1 pc for stars of 3-5 solar masses to 3 pc at 0.3. As a result we can say that Meusinger et al.’s work must have been affected by mass segregation, with roughly one third of the low-mass members lying outside their survey, but essentially all the Pleiades stars with included. Hambly et al.’s work fares better, with perhaps only percent of stars with missing. In both cases then, the true value of is likely to be a little higher than derived from these spatially limited surveys, although the effect should not be nearly as large as calculated for NGC 2516 in Sect. 4.5. Pinfield et al. estimate that the total mass of the Pleiades, after accounting for this segregation is 735.
The core radius values in the Pleiades are comparable with the NGC 2516 values that we determined in Table 5, but it does seem that the growth of with decreasing mass is more rapid in NGC 2516. A simple power-law fit indicates that with , rather than the 0.5 found for the Pleiades by Pinfield et al. (1998). In a virialised system, we might expect (see Pinfield et al. 1998 for an analytic argument and Spitzer & Shull 1975 for numerical simulations). This is perhaps a hint that at least some of the mass segregation in NGC 2516 is primordial, as has been supposed for some younger clusters (Sagar et al. 1988; Bonnell & Davies 1998), with the high-mass stars being initially more centrally concentrated than the low-mass stars. This would be a mildly surprising result, because dynamical mass segregation should have removed the signature of initial conditions on the cluster relaxation timescale – which is about 100 Myr for clusters of the size of NGC 2516 and the Pleiades.
Both the total mass and the MF of NGC 2516 are dependent on what is assumed for the metallicity of the cluster and also to a lesser extent on which stellar evolution models are used. If the cluster has a solar metallicity then the mass inside our survey area (for stars with ) is 1100–1200, depending on how unresolved binarity is treated. The equivalent figure for a half-solar metallicity model is 950–1050 (for stars with ). If the cluster does have a solar metallicity then the MF drops sharply below 0.7, with . A half-solar metallicity yields a shallower slope of . We have established that most high mass () stars are included in our survey, but that more than half of the low mass () stars of the cluster may lie outside this region – depending on the exact form of the density distribution beyond our surveyed area. Correcting the total cluster mass for this segregation leads to an estimate of about 1240–1560 – twice the mass of the Pleiades, in agreement with the earlier prediction made by Dachs & Kabus (1989). This implies that the shapes of the MFs of NGC 2516 must be reasonably similar (at least over the mass range which contributes most to the total cluster mass). As we discussed in Sects. 4.2 and 4.5, a factor of two increase in the numbers of low mass stars relative to high mass stars could increase at low masses and bring the NGC 2516 MF into into agreement with the flat () Pleiades MF between . Mass segregation appears to provide just this correction, increasing by about 0.7.
Recent simulations of an evolving star cluster by Kroupa et al. (2001) show both the total MF and the MF for stars within 2 pc of the centre of a cluster similar in size to the Pleiades, and at an age of 100 Myr. Their Figures 14 and 15, demonstrate that mass segregation can indeed produce a downturn in the MF of the central regions below 0.7, even if the whole-cluster MF is flat. A thorough survey for low-mass stars outside the area discussed in this paper will be vital to constrain the surface density of members, the whole-cluster mass function and the total cluster mass.
On the basis of a comparison of high mass ratio (), unresolved binary systems, the Pleiades and NGC 2516 have a similar binary fraction of percent. It remains to be seen whether this similarity persists for lower mass ratio binary systems.
In summary, subject to a wider survey confirming the presence of an extended population of low-mass objects in NGC 2516 (see the offset field of Hawley et al. 1999 for some preliminary evidence), we believe that NGC 2516 and the Pleiades are similar in most respects, but that NGC 2516 has twice the mass and numbers of stars.
5.2 Lower mass stars and brown dwarfs in NGC 2516?
Any apparent difference between the Pleiades and NGC 2516 MFs at low masses could be very significant for those searching for even lower mass stars and BDs in NGC 2516. If we take our observed NGC 2516 solar metallicity MF below , with (see Sect. 4.2), and simply extrapolate to lower masses, we find that there would only be about 100 brown dwarfs (with ) in the area we have surveyed. The half-solar metallicity MF, with , predicts around 220. The total number of brown dwarfs in the cluster could be much larger if mass segregation continues to lower masses. At the very least these numbers should be doubled to account for the segregation that is already apparent in stars.
If instead we assume a Pleiades-like MF that is flat between 0.7 and 0.2 and then decreases with below this, we calculate that there would be 360–440 brown dwarfs in the solar and half-solar metallicity cases respectively. Even with this MF, the total mass in the form of brown dwarfs would be less than 3 percent of the cluster mass and the extra contribution in the form of stars with would be about 15 percent. A search for brown dwarfs and low mass stars in the outer regions of NGC 2516 will tell us much about the whole-cluster mass function and the cluster dynamics.
6 Summary
In this paper we have presented a large, accurate and uniform survey of stars covering 0.86 square degrees ( pc) of NGC 2516, and which is almost complete to , . Thanks to the relatively low contamination of the cluster main sequence by foreground and background objects we have been able to select a sample of candidate cluster members. NGC 2516 probably has a lower metallicity than the similarly aged Pleiades and our list of candidate members list will be an important source of optically selected low-mass targets for further investigations of magnetic activity, elemental abundances, lithium depletion and rotation rates in convective stars.
We have made a preliminary investigation of the luminosity function, mass function, binarity, mass segregation and total mass of NGC 2516, and compared our results with the Pleiades, other young clusters and the field. Because the metallicity of NGC 2516 may be as low as half the solar value, we have performed two sets of calculations, one for a mass fraction of heavy elements, and another with . Some of our results are somewhat dependent on the assumed metallicity and others depend on extrapolating to lower masses or larger spatial areas. We can summarize the results of our investigation as follows:
-
1.
The luminosity function of the central regions of NGC 2516 are consistent with the Pleiades and field populations for . For fainter stars, the luminosity function of NGC 2516 flattens and contains a factor of two fewer stars than are seen in the Pleiades and field.
-
2.
The derived mass function for NGC 2516 is in agreement with the Pleiades and field for stars with , with some metallicity and evolutionary model dependence. We find a mass function, , with and for the solar and half-solar metallicity models of Siess et al. (2000) and for the solar metallicity models of D’Antona & Mazzitelli (1997). These values are close to the canonical Salpeter (1955) value of . At lower masses () we find and for the solar and half-solar metallicity Siess et al models, and for the solar metallicty D’Antona & Mazzitelli models. These are more steeply declining functions of mass than seen in either the Pleiades or field.
-
3.
Mass segregation is clearly present in NGC 2516 when we compare the radial distributions of stars above and below about . From extrapolation of simple analytic models for the surface density distribution, we infer that about half of the lower mass cluster members lie outside our surveyed area, whilst the vast majority of higher mass stars are included. If this is confirmed by wider surveys for cluster members, then the whole-cluster mass and luminosity functions of NGC 2516 and the Pleiades could be very similar at least down to 0.3. The cluster core radius increases towards lower masses at a faster rate than if the segregation were simply due to equipartition. This may indicate some remnant primordial mass segregation in NGC 2516, where the high-mass stars were initially more centrally concentrated than the low-mass stars.
-
4.
The binary fraction of A to M-type stars, with mass ratios of 0.6–1, is percent in NGC 2516, which is comparable with the same statistic for the Pleiades and field stars. This is a lower limit to the total binary fraction, which could be as high as 65 to 85 percent, depending on what form the mass ratio distribution takes. Unresolved binarity has only been partially taken onto account in our mass function determinations, in the sense that we have identified those systems composed of two stars of roughly equal mass and have not treated them as a single star with slightly higher mass. Mass functions determined in this way at least have the merit of comparability with estimates derived from photometric data on other clusters in the literature, but we recognize that the slopes of the true stellar mass functions may be a little steeper ( increases by for high mass stars and for lower mass stars), because low mass stars could still be hidden in many systems.
-
5.
The total mass of the cluster for stars with is at least and probably as high as , depending on the metallicity, binary fraction and mass-ratio distribution. Correcting for the fraction of stars that lie outside our survey, but within the likely cluster tidal radius, may increase this estimate to around 1240–1560. NGC 2516 is therefore about twice as massive as the Pleiades.
-
6.
If the whole-cluster mass functions of NGC 2516 and the Pleiades are similar, then we expect about 360–440 brown dwarfs in NGC 2516. Extrapolation of the mass functions derived from our data suggest that 100–220 would be in the area surveyed in this paper.
Acknowledgements
We would like to thank the director and staff of the Cerro Tololo Interamerican Observatory, operated by the Association of Universities for Research in Astronomy, Inc., under contract to the US National Science Foundation. RDJ and MRT acknowledge the financial support of the UK Particle Physics and Astronomy Research Council (PPARC) throughout a large proportion of this work. Computational work was performed on the Keele, Birmingham and Edinburgh nodes of the PPARC funded Starlink network.
References
- Alonso et al. (1996) Alonso, A., Arribas, S., & Martinez-Roger, C. 1996, A&A, 313, 873
- Bahcall (1986) Bahcall, J. N. 1986, ARA&A, 24, 577
- Barrado y Navascués et al. (2001) Barrado y Navascués, D., Stauffer, J. R., Bouvier, J., & Martín, E. L. 2001, ApJ, 546, 1006
- Belikov et al. (1998) Belikov, A. N., Hirte, S., Meusinger, H., Piskunov, A. E., & Schilbach, E. 1998, A&A, 332, 575
- Bessell (1979) Bessell, M. 1979, PASP, 91, 589
- Bessell et al. (1998) Bessell, M. S., Castelli, F., & Plez, B. 1998, A&A, 333, 231
- Bessell & Weis (1987) Bessell, M. S. & Weis, E. W. 1987, PASP, 99, 642
- Bettis (1975) Bettis, C. 1975, PASP, 87, 707
- Bonnell & Davies (1998) Bonnell, I. A. & Davies, M. B. 1998, MNRAS, 295, 691
- Bouvier et al. (1997) Bouvier, J., Rigaut, F., & Nadeau, D. 1997, A&A, 323, 139
- Bouvier et al. (1998) Bouvier, J., Stauffer, J. R., Martín, E. L., Barrado y Navascués, D., Wallace, B., & Bejar, V. J. S. 1998, A&A, 336, 490
- Cameron (1985) Cameron, L. M. 1985, A&A, 147, 39
- Castelli (1999) Castelli, F. 1999, A&A, 346, 564
- Chabrier & Baraffe (2000) Chabrier, G. & Baraffe, I. 2000, ARA&A, 38, 337
- Cox (1955) Cox, A. N. 1955, ApJ, 121, 628
- Dachs & Kabus (1989) Dachs, J. & Kabus, H. 1989, A&AS, 78, 25
- D’Antona & Mazzitelli (1997) D’Antona, F. & Mazzitelli, I. 1997, Mem. Soc. Astr. It., 68, 807
- de la Fuente (1995) de la Fuente, R. 1995, A&A, 301, 407
- de la Fuente Marcos & de la Fuente Marcos (2000) de la Fuente Marcos, R. & de la Fuente Marcos, C. 2000, Ap&SS, 271, 127
- Duquennoy & Mayor (1991) Duquennoy, A. & Mayor, M. 1991, A&A, 248, 485
- Eaton et al. (2000) Eaton, N., Draper, P. W., & Allan, A. 2000, Photom – A photometry package, Starlink User Note 45.11, Rutherford Appleton Laboratory
- Eaton & Privett (1996) Eaton, N. & Privett, G. 1996, DAOPHOT stellar photometry package, Starlink User Note 42.5, Rutherford Appleton Laboratory
- Eggen (1972) Eggen, O. J. 1972, ApJ, 173, 63
- Eggen (1983) —. 1983, MNRAS, 204, 377
- Fisher & Marcy (1992) Fisher, D. A. & Marcy, G. W. 1992, ApJ, 396, 178
- Flower (1996) Flower, P. J. 1996, ApJ, 469, 355
- Gould et al. (1997) Gould, A., Bahcall, J. N., & Flynn, C. 1997, ApJ, 482, 913
- Hambly et al. (2001a) Hambly, N. C., Davenhall, A. C., Irwin, M. J., & MacGillivray, H. T. 2001a, MNRAS, in preparation
- Hambly et al. (2001b) —. 2001b, MNRAS, in preparation
- Hambly et al. (1993) Hambly, N. C., Hawkins, M. R. S., & Jameson, R. F. 1993, A&AS, 100, 607
- Hambly et al. (1999) Hambly, N. C., Hodgkin, S. T., Cossburn, M. R., & Jameson, R. F. 1999, MNRAS, 303, 835
- Harnden et al. (2001) Harnden, F. R., Adams, N. R., Damiani, F., Drake, J., Evans, N. R., Favata, F., Flaccomio, E., Freeman, P., Jeffries, R. D., Kashyap, V., Micela, G., Patten, B. M., Pizzolato, N., Schachter, J., Sciortino, S., Stauffer, J., Wolk, S. J., & Zombeck, M. 2001, ApJ, 547, L141
- Hawley et al. (1999) Hawley, S. L., Tourtellot, J. G., & Reid, I. N. 1999, AJ, 117, 1341
- Jeffries et al. (1998) Jeffries, R. D., James, D. J., & Thurston, M. R. 1998, MNRAS, 300, 550
- Jeffries et al. (1997) Jeffries, R. D., Thurston, M. R., & Pye, J. P. 1997, MNRAS, 287, 350
- Johnson (1966) Johnson, H. 1966, ARA&A, 4, 193
- Kähler (1999) Kähler, H. 1999, A&A, 346, 67
- Kerr & Lynden-Bell (1986) Kerr, F. J. & Lynden-Bell, D. 1986, MNRAS, 221, 1023
- King (1962) King, I. R. 1962, AJ, 67, 471
- Kroupa (1995) Kroupa, P. 1995, MNRAS, 277, 1522
- Kroupa (2001) —. 2001, MNRAS, 322, 231
- Kroupa et al. (2001) Kroupa, P., Aarseth, S., & Hurley, J. 2001, MNRAS, 321, 699
- Landolt (1992) Landolt, A. 1992, AJ, 104, 340
- Lasker et al. (1990) Lasker, B. M., Sturch, C. R., McClean, B. J., Russell, J., Jenkner, H., & Shara, M. M. 1990, AJ, 99, 2019
- Leggett et al. (1996) Leggett, S. K., Allard, F., Berriman, G., Dahn, C. C., & Hauschildt, P. H. 1996, ApJS, 104, 117
- Mermilliod et al. (1992) Mermilliod, J. C., Rosvick, J. M., Duquennoy, A., & Mayor, M. 1992, A&A, 265, 513
- Meusinger et al. (1996) Meusinger, H., Schilbach, E., & Souchay, J. 1996, A&A, 312, 833
- Meynet et al. (1993) Meynet, G., Mermilliod, J. C., & Maeder, A. 1993, A&AS, 98, 477
- Micela et al. (2000) Micela, G., Sciortino, S., Jeffries, R. D., Thurston, M. R., & Favata, F. 2000, A&A, 357, 909
- Monet et al. (1992) Monet, D. G., Dahn, C. C., Vrba, F. J., Harris, H. C., Pier, J. R., Luginbuhl, C. B., & Ables, H. D. 1992, AJ, 103, 638
- Montgomery et al. (1993) Montgomery, K. A., Marschall, L. A., & Janes, K. A. 1993, AJ, 106, 181
- Moraux et al. (2001) Moraux, E., Bouvier, J., & Stauffer, J. R. 2001, A&A, 367, 211
- Phelps & Janes (1993) Phelps, R. L. & Janes, K. A. 1993, AJ, 106, 1870
- Pinfield et al. (1998) Pinfield, D. J., Hodgkin, S. T., & Jameson, R. F. 1998, MNRAS, 299, 955
- Pinsonneault et al. (1998) Pinsonneault, M. H., Stauffer, J. R., Soderblom, D. R., King, J. R., & Hanson, R. B. 1998, ApJ, 504, 170
- Pinsonneault et al. (2000) Pinsonneault, M. H., Terndrup, D. M., & Yuan, Y. 2000, in Stellar clusters and associations: Convection, rotation and dynamos, ed. S. S. R. Pallavicini, G. Micela (San Francisco: ASP Conference Series, Vol. 198), 95
- Prosser (1992) Prosser, C. F. 1992, AJ, 103, 488
- Reid (1992) Reid, I. N. 1992, MNRAS, 257, 257
- Reid & Hawley (2000) Reid, I. N. & Hawley, S. L. 2000, New light on dark stars (Chichester, UK: Springer-Praxis)
- Reid et al. (1999) Reid, I. N., Kirkpatrick, J. D., Liebert, J., Burrows, A., Gizis, J. E., Burgasser, A., Dahn, C. C., Monet, D., Cutri, R., A., B. C., & Skrutskie, M. 1999, ApJ, 521, 613
- Robichon et al. (1999) Robichon, N., Arenou, F., Mermilliod, J. C., & Turon, C. 1999, A&A, 345, 471
- Sagar et al. (1988) Sagar, R., Myakutin, V. I., Piskunov, A. E., & Dluzhnevskaya, O. B. 1988, MNRAS, 234, 831
- Sagar & Richtler (1991) Sagar, R. & Richtler, T. 1991, A&A, 250, 324
- Salpeter (1955) Salpeter, E. E. 1955, ApJ, 121, 161
- Sarajedini et al. (1999) Sarajedini, A., von Hippel, T., Kozhurina-Platais, V., & Demarque, P. 1999, AJ, 118, 2894
- Sciortino et al. (2001) Sciortino, S., Micela, G., Damiani, F., Flaccomio, E., Briggs, K., Denby, M., Pye, J., Grosso, N., Read, A. M., Gondoin, P., & Jeffries, R. D. 2001, A&A, 365, L259
- Shortridge et al. (1999) Shortridge, K., Meyerdierks, H., Currie, M., Clayton, M., Lockley, J., Charles, A., Davenhall, C., Taylor, M., Ash, T., Wilkins, T., Axon, D., Palmer, J., & Holloway, A. 1999, FIGARO a general data reduction system, Starlink User Note 86, Rutherford Appleton Laboratory
- Siess et al. (2000) Siess, L., Dufour, E., & Forestini, M. 2000, A&A, 358, 593
- Spitzer & Shull (1975) Spitzer, L. J. & Shull, J. M. 1975, ApJ, 201, 773
- Stauffer et al. (1984) Stauffer, J. R., Hartmann, L., Soderblom, D. R., & Burnham, N. 1984, ApJ, 280, 202
- Stauffer et al. (1998a) Stauffer, J. R., Schild, R., Barrado y Navascués, D., Backman, D. E., Angelova, A. M., Kirkpatrick, J. D., Hambly, N., & Vanzi, L. 1998a, ApJ, 504, 805
- Stauffer et al. (1998b) Stauffer, J. R., Schultz, G., & Kirkpatrick, J. D. 1998b, ApJ, 499, L199
- Stetson (1987) Stetson, P. B. 1987, PASP, 99, 191
- Terndrup et al. (2001) Terndrup, D. M., Stauffer, J. R., Jeffries, R. D., Ford, A., Pinsonneault, M. H., & Sills, A. 2001, AJ, submitted
- Thurston (1999) Thurston, M. R. 1999, PhD thesis, University of Birmingham, England
- Upgren & Armandroff (1981) Upgren, A. R. & Armandroff, T. E. 1981, AJ, 86, 1898
- Urban et al. (1998) Urban, S. E., Corbin, T. E., & Wycoff, G. L. 1998, AJ, 115, 2161
- Wielen (1974) Wielen, R. 1974, in Highlights of Astronomy, Vol. 3, ed. G. Contopoulos (Dordrecht: Reidel), 395