Optical Detection of a Variable Millisecond Pulsar Companion in 47 Tucanae 11affiliation: Based on observations with the NASA/ESA Hubble Space Telescope obtained at STScI, which is operated by AURA, Inc. under NASA contract NAS 5-26555.
Abstract
Using results from radio and X-ray observations of millisecond pulsars in 47 Tucanae, and extensive HST imaging of the globular cluster core, we have derived a common astrometric solution good to 01. A close positional coincidence is found for 47 Tuc U, a 4.3 ms pulsar in a 0.429 day orbit, detected in radio and X-rays, with an = 20.9 blue star. Analysis of extensive time series data for this optical candidate shows a 0.004 magnitude semi-amplitude variation at the period and phase expected from the radio ephemeris, and the optical variations are spatially coincident with the candidate. This provides secure optical detection of the white dwarf companion to the millisecond pulsar, the first such detection in a globular cluster, allowing for comparisons to recent models for such companions with dependencies on mass and age.
1 Introduction
The huge improvement in spatial resolution of Chandra over previous X-ray missions is proving, like Hubble Space Telescope (HST), to have significant impact on globular cluster astrophysics. For example, using Chandra, 108 sources have been detected in the central 2 of the massive globular cluster 47 Tucanae (NGC104; Grindlay et al. 2001), compared to the detection of 9 central sources by ROSAT (Verbunt & Hasinger, 1998). These Chandra sources are a mixture of millisecond pulsars (MSPs), cataclysmic variables (CVs), quiescent low-mass X-ray binaries, and active binaries, many of which have also been detected (Edmonds et al. 2001, in preparation) in our extensive 8.3 day HST/WFPC2 observations of this cluster (Gilliland et al., 2000). Fifteen of the 20 MSPs detected in 47 Tuc by Camilo et al. (2000) with the Parkes radio telescope have timing positions accurate to 001 (Freire et al. 2001; hereafter FCL01), and 10 of these are detected in X-rays with the CIAO program wavdetect (errors ), allowing for excellent astrometry between the radio and X-ray coordinate frames. Combined with the large numbers of CVs and active binaries detected with both Chandra and HST, we exploit here the rare opportunity to perform astrometry at the 0.1′′ level between X-ray, optical, and radio observations, using only relative astrometry.
Of the 8 binary MSPs in 47 Tuc with timing solutions (FCL01), 5 have companions with masses of 0.15–0.20M⊙ (Camilo et al., 2000); by analogy with field MSPs these are expected to be helium white dwarfs (He WDs). Using our precise astrometry we report here the unambiguous detection of a He WD companion to one of these MSPs (PSR J00247203U, hereafter 47 Tuc U), the first such detection in a globular cluster. (He WDs have been reported in the globular cluster NGC 6397 by Cool et al. 1998, Edmonds et al. 1999, and Taylor et al. 2001, but none of these have yet been associated with an MSP.) The astrometry, photometry and time series for this identification are described here, along with a discussion of their consequences for the age of 47 Tuc U, the nature of He WDs and their cooling, and the heating effects of an MSP in a close binary.
2 Observations and Analysis
2.1 Astrometry
We assumed the astrometric coordinate system of the MSPs (based on the JPL DE200 planetary ephemeris; FCL01) as our reference. First, we transferred the Chandra coordinate frame onto the radio frame using only the relatively isolated MSPs with accurate Chandra positions (six MSPs including 47 Tuc U). We calculated and subtracted the mean positional offsets between the X-ray and radio coordinate systems and found the rms residuals were and for RA and Dec respectively (after correcting for small linear correlations between RA and RA error and Dec and Dec error). The total error of compares favorably with the mean predicted wavdetect error, at the relevant count levels and in the absence of background and crowding, of .
We then fixed the HST coordinate system, with positions based on the STSDAS program metric, onto that of Chandra using the X-ray detection of 6 CVs and active binaries found on the WF2 chip of the Gilliland et al. (2000) HST/WFPC2 data (this chip contains 4 of the 6 MSPs, including 47 Tuc U, used to perform the radio to Chandra astrometry). The rms residuals were found to be and , for RA and Dec respectively. Then, assuming the errors are random and dividing by , the resulting 1 errors matching X-ray to optical are and for RA and Dec, and for radio to optical are and .
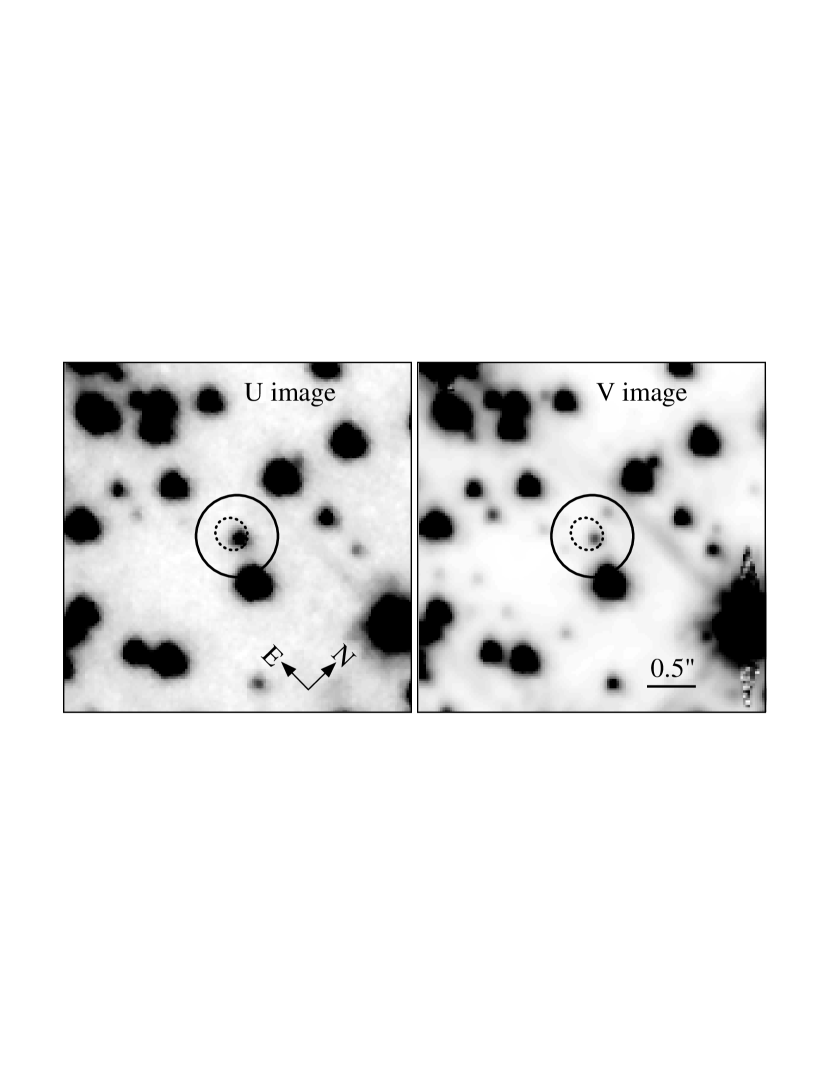
Using this astrometry we searched directly for MSP companions in the HST images and found an excellent candidate for a companion to 47 Tuc U (hereafter ) whose position is given in Table 1. Finding charts for (Fig. 1) show the -band and -band images, plus the 3 error circle for W11 (the Chandra X-ray source corresponding to 47 Tuc U) and the 3 error ellipse for 47 Tuc U. The offset between W11 and is , and between 47 Tuc U and is .
2.2 Photometry
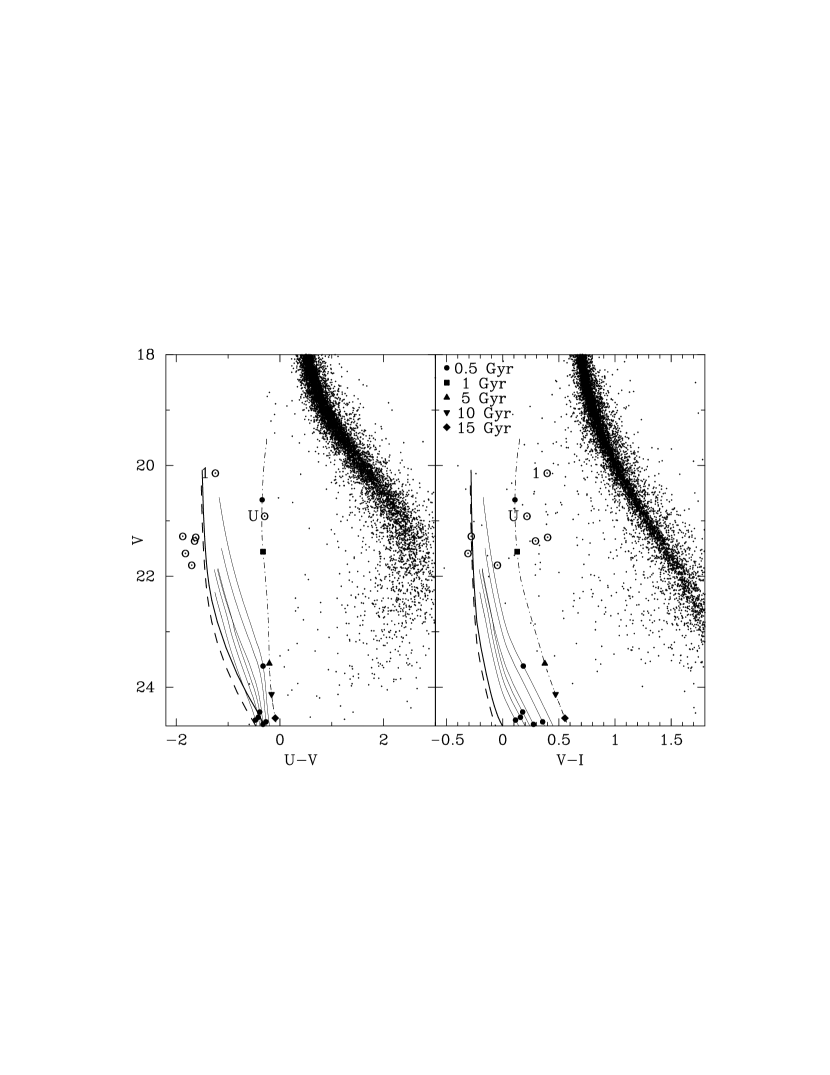
Figure 1 shows that is clearly blue, since other stars in the image of comparable brightness to are barely visible in the image. This impression is confirmed by our vs and vs color-magnitude diagrams (CMDs) from PSF-fitting photometry shown in Figure 2 (we have transformed from HST filters to Johnson-Cousins using Holtzman et al. 1995; see also Table 1). The star (labeled ‘U’; ) is blueward of the main sequence (MS) in both CMDs, where the internal error for is 0.03 mag for each filter, with absolute errors of mag in and and mag in , including transformation uncertainties. A likely CV is labeled (‘1’) as are 5 blue stars (circles) confirmed by visual examination to be relatively bright in like . One of these blue stars is probably a CO WD (see Zoccali et al. 2001), two others are variable and likely CO WD-MS binaries and the other two are possibly also binaries. Visual examination showed that the other apparently blue stars, with , are caused by crowding and photometric error, particularly in the crowded portions of the image nearest to the cluster center. Many of the fainter stars with and are bona-fide blue stars, likely to be dominated by MS stars from the SMC (see Zoccali et al. 2001).
The very small number of stars that are blue and detectable in each of , and highlights the unusual nature of and its likely association with 47 Tuc U. With 7 such blue stars the probability (averaged over the whole WF2 image) of detecting one in a circular aperture of radius is only 9.
2.3 Time Series
The HST/WFPC2 data of Gilliland et al. (2000) contain 636 -band and 653 -band 160 s images evenly spread over 8.3 days. Typical rms noise values in fractional intensity (Gilliland et al. 2000) are at and at . Since is relatively well isolated, the quality of its and time series, based on its extracted aperture of 0, is excellent. Its rms noise values are 0.021 () and 0.034 (), or and 0.6 away from the mean rms values for the 666 () or 551 () stars within 0.25 mag of , after iteratively removing outliers.
We then searched for evidence of low amplitude variations in . Lomb-Scargle (Scargle, 1982) power spectra of the and time series for 47 Tuc U are shown in the upper panel of Figure 3. This shows a peak in the -band, at (2.681Hz, which is coincident with the orbital period for 47 Tuc U (Hz) determined from radio observations. Although this peak is not statistically significant in a blind search, only one other peak, when measured out to 0.45 mHz (the ‘average’ Nyquist frequency; Scargle 1982) has a higher signal. No corresponding signal is seen in the –band.
We then carried out a least-squares fit of a sinusoid to the time series, by coordinating the radio ephemeris with the optical and correcting the mid-exposure HST times to the barycenter, using the IRAF task rvcorrect. We define phase (where is the barycentric time, is the time of ascending node, when the pulsar is moving with maximum velocity away from us, and is its orbital period) so that when phase the heated hemisphere of is facing towards us, giving maximum light (in a model where is heated by the pulsar wind). The derived period, time of optical maximum (phase = 0) and semi–amplitude for the -band time series are given in Table 1 ( phase plots are shown in the lower–left panel of Fig. 3). For the ‘unforced’ solution the period is 0.7 away from the orbital radio period, and the phase is 1.9 away from phase zero for the radio observations (as defined above). The amplitude is significant at the 3.4 level (the significance of this measurement is 3.4 when the 1/10 chance probability of the radio and optical phases aligning is considered). By forcing the period and phase of the sinusoidal variation to equal the radio values (the ‘forced’ solution), an amplitude of 0.00330.0012 is derived, significant at the 2.8 level; a forced fit in the -band yielded 0.00130.0018. Marginal evidence is found for variation in the much more limited (26 images of length 160 s – 900 s) -band data (see Fig. 3).
To test whether this small variation in is intrinsic to rather than a larger variation from a nearby fainter star we examined the power spectra of 3 fainter stars (with ) lying within of . None showed significant variations. We also examined a ‘phase difference’ image derived by adding together images where the phase of is within 0.07 of 1.0 and subtracting similar images for phase values of 0.50.07. This procedure gave a stellar-shaped source coincident, at the 0.5 pixel () error level, with , exactly as expected if is the only star varying with the radio period and phase. We therefore conclude we have made a solid detection of variability from at the expected period and phase, confirming it as the 47 Tuc U companion.
3 Discussion
Neutron stars (NSs) in binary radio pulsar systems have average masses of M⊙ (Thorsett & Chakrabarty, 1999). For 47 Tuc U, considering a NS mass 1.30 M⊙ and an edge-on orbit (inclination °), we derive from the mass function a minimum mass for of = 0.120 M⊙. This 4.3 ms pulsar has an approximate characteristic age of Gyr and spin-down luminosity of erg s-1 (Grindlay et al. 2001, in preparation). Such recycled pulsars may have accreted significant amounts of mass, and for every additional 0.05 M⊙ for the NS, ’s minimum value increases by 0.003 M⊙.
We now compare the colors of with expectations from H and He WD models to test whether it is a plausible He WD and if so, to estimate , log g, and the mass and age of this star. We focus on comparisons with the models of Serenelli et al. (2001; hereafter SAR01), who conveniently provide broadband color information. They find that for masses ranging from 0.18 M⊙ to 0.41 M⊙, diffusion-induced hydrogen-shell flashes take place which deplete the H envelope and cause evolution to proceed relatively quickly, while the He WDs with mass M⊙ evolve much more slowly because they retain relatively thick hydrogen envelopes. Althaus, Serenelli, & Benvenuto (2001) and SAR01 show that this dichotomy between low and high mass He WDs removes the discrepancies between MSP characteristic ages and WD cooling ages for several field systems including PSRs J00340534, J1012+5307, J1713+0747 and B1855+09.
Figure 2 shows the He WD cooling curves of SAR01 for masses of 0.169 – 0.406 M⊙. Since lies well to the red of the WD cooling sequence of Bergeron, Wesemael, & Beauchamp (1995) in both CMDs, it is unlikely to be a 0.55 M⊙ CO WD. The lowest mass models of SAR01 offer much better agreement, and since falls slightly to the red of the lowest mass sequence we infer that M⊙ (implying °). This would mean that 47 Tuc U is similar to the field system PSR J1012+5307, with period = 0.605 d and mass M⊙ (Callanan, Garnavich, & Koester, 1998).
The 0.17M⊙ SAR01 model with the same absolute magnitude as has =11000 K, log g = 5.6, luminosity = 0.14 , a radius111The estimated radius is fairly insensitive to the details of the Serenelli et al. (2001) WD models, since can be estimated accurately just from the color (Hansen & Phinney, 1998), and the luminosity using only the magnitude and . of cm and an age of Gyr. This cooling age is somewhat less than the characteristic age estimated by Grindlay et al. (2001, in preparation) and is at the low end of the conservative limits set by FCL01 of Gyr. Only the lowest mass model of SAR01 remains relatively bright at these significant cooling ages, while all of the higher mass WDs reach much fainter levels () at a cooling age of Gyr (see Fig. 2). Our data therefore provides tentative support for the evolutionary calculations of SAR01, in particular for the dichotomy in ages between different mass He WDs. For comparison, the He WD models of Hansen & Phinney (1998) (for all masses) reach =11.5 or fainter after 1 Gyr, for a relatively thick hydrogen envelope of M⊙.
Accretion should have ceased in the 47 Tuc U system, to explain the faint X-ray luminosity (erg s-1; Grindlay et al. 2001, in preparation) and the constant, uneclipsed radio emission (FCL01). Using the Roche-lobe formula from Paczyński (1971) (, where is the Roche-lobe radius, and is the binary separation), the WD radius given above (for = 0.17 M⊙; °) and the binary separation from Kepler’s Third Law, should under–fill its Roche lobe by a factor of 6. Therefore, as expected, no accretion will be occurring.
Assuming that the MSP radiates its wind isotropically, and that °, then the estimate implies that the pulsar energy intercepted by should be erg s-1 or 0.013 the luminosity of (assuming that the spin-down energy is re-radiated as a black-body, we derive a temperature of K, peaked at Å, for the re-radiated emission). Therefore, assuming that only one side of is heated we should see a relative variability amplitude of , allowing a factor of 1.4 decrease in possible amplitude because of the inclination. This is only slightly larger than the amplitude of the detected -band variation, implying a high efficiency factor for re-radiation of the pulsar’s wind as optical emission. However, because the variability expected from the effects of heating is small, we infer that the possible (2.3) much larger amplitude variation in the –band is either spurious or evidence for a separate source of emission.
4 Summary and Followup Observations
We have identified the binary pulsar 47 Tuc U with an optically variable blue star with period and phase of maximum light in excellent agreement with that expected from the precise radio ephemeris (FCL01). The companion is likely to be a He white dwarf with 0.17 M⊙, based on the published models of SAR01.
Although the optical time series photometry reported here is unlikely to be improved upon soon, time resolved spectroscopy with HST/STIS of appears promising. The co-added Doppler corrected spectrum could be used to spectroscopically determine and log g, and hence (see e.g. Edmonds et al. 1999). Combining with the radial velocity amplitude of () and the measured from the radio measurements would give a direct measurement of .
References
- Althaus, Serenelli, & Benvenuto (2001) Althaus, L. G., Serenelli, A. M., & Benvenuto, O. G. 2001, MNRAS, 323, 471
- Bergeron, Wesemael, & Beauchamp (1995) Bergeron, P., Wesemael, F., & Beauchamp, A. 1995, PASP, 107, 1047
- Callanan, Garnavich, & Koester (1998) Callanan, P. J., Garnavich, P. M., & Koester, D. 1998, MNRAS, 298, 207
- Camilo et al. (2000) Camilo, F., Lorimer, D. R., Freire, P., Lyne, A. G. & Manchester, R. N. 2000, ApJ, 535, 975
- Cool et al. (1998) Cool, A. M., Grindlay, J. E., Cohn, H. N., Lugger, P. M., & Bailyn, C. D. 1998, ApJ, 508, L75
- Edmonds et al. (1999) Edmonds, P. D., Grindlay, J. E., Cool, A., Cohn, H., Lugger, P., & Bailyn, C. 1999, ApJ, 516, 250
- Freire et al. (2001) Freire, P., Camilo, F., Lorimer, D. R., Lyne, A. G., Manchester, R. N. & D’Amico, N. 2000, MNRAS, In press (FCL01; astro-ph/0103372)
- Gilliland et al. (2000) Gilliland, R. L. et al. 2000, ApJ, 545, L47
- Grindlay et al. (2001) Grindlay, J. E., Heinke, C. O., Edmonds, P. D. & Murray, S. 2001, Science, 292, 2290
- Hansen & Phinney (1998) Hansen, B. M. S. & Phinney, E. S. 1998, MNRAS, 294, 557
- Holtzman et al. (1995) Holtzman, J. A., Burrows, C. J., Casertano, S., Hester, J. J., Trauger, J. T., Watson, A. M., & Worthey, G. 1995, PASP, 107, 1065
- Paczyński (1971) Paczyński, B. 1971, ARA&A, 9, 183
- Scargle (1982) Scargle, J. D. 1982, ApJ, 263, 835
- Serenelli et al. (2001) Serenelli, A. M., Althaus, L. G., Rohrmann R. D. & Benvenuto, O. G. 2001, MNRAS, 325, 607 (SAR01)
- Taylor, Grindlay, Edmonds, & Cool (2001) Taylor, J. M., Grindlay, J. E., Edmonds, P. D., & Cool, A. M. 2001, ApJ, 553, L169
- Thorsett & Chakrabarty (1999) Thorsett, S. E. & Chakrabarty, D. 1999, ApJ, 512, 288
- Verbunt & Hasinger (1998) Verbunt, F. & Hasinger, G. 1998, A&A, 336, 895
- Zoccali et al. (2001) Zoccali, M. et al. 2001, ApJ, 553, 733
| RAaaCoordinates from Freire et al. (2001) | DecaaCoordinates from Freire et al. (2001) | period | (phase=0)bbTime of optical maximum (see text) | amp | |||
|---|---|---|---|---|---|---|---|
| (J2000) | (J2000) | (days) | (MJD) | (mag) | |||
| 00 24 09.8325(5) | 72 03 59.667(3) | 20.6(1) | 20.91(5) | 20.70(5) | 0.432(4) | 51367.32(2) | 0.004(1) |