P-mode observations on Cen A††thanks: Based on observations collected with the CORALIE echelle spectrograph on the 1.2-m Euler Swiss telescope at La Silla Observatory, ESO Chile
We have made a clear detection of p-mode oscillations in the nearest solar-like G2V star Cen A with the CORALIE spectrograph on the 1.2-m Swiss telescope at the ESO La Silla Observatory. We report the 5 nights of observation on this star in May 2001 during which 1260 high precision radial velocity measurements were obtained. The power spectrum clearly shows several identifiable peaks between 1.7 and 3 mHz. The average large splitting of 105.7 Hz and the amplitude of about 35 cm s-1 of these modes are in agreement with theoretical expectations.
Key Words.:
Stars: individual: Cen A – Stars: oscillations – Techniques: radial velocities1 Introduction
One of the major objectives of the stellar physic is the understanding of stellar interiors and the modelisation of star evolution. Asteroseismology, which consists to measure amplitudes and frequencies of oscillation modes is an ideal tool to constrain stellar models and evolutionary theory.
Recent results of ground-based observations using Doppler techniques have permitted to detect solar-like oscillations in the F5IV-V star Procyon (Martic et al. martic99 (1999)) and the G2IV star Hydri (Bedding et al. bedding01 (2001); Carrier et al. carrier01 (2001)). These two stars exhibit good evidence for excess power centered at 1 mHz with peak amplitude of about 50 cm s-1.
A primary and challenging target for the search for p-mode oscillations is the G2V star Rigil Centaurus ( Cen A, HR 5459). Thanks to its proximity and its belonging to a binary system, its characteristics are well-determined which simplifies the interpretation of asteroseimological results. Scaling from the solar case, the frequency of its greatest mode is expected to be mHz, the primary frequency splitting Hz and the oscillation amplitude cm s-1 (Kjeldsen & Bedding 1995a ). Detailed Models with seismological analysis have been recently proposed for Cen A (see, e.g., Pourbaix et al. pourbaix99 (1999), Guenther & Demarque guenther00 (2000), Morel et al. morel00 (2000)).
Several groups have already conducted thorough attempts to detect signature of the p-mode oscillations on this star. Two groups claimed mode detections with amplitudes 3.2 - 6.4 greater than solar (Gelly et al. gelly86 (1986); Pottasch et al. pottasch92 (1992)). It was however infirmed by three others groups which obtained upper limits of mode amplitudes of 1.4 - 3 times solar (Brown & Gilliland brown90 (1990); Edmonds & Cram edmonds95 (1995); Kjeldsen et al. kjeldsen99 (1999)). More recently Schou & Buzasi (schou01 (2001)) have made photometric observations of Cen A with the WIRE spacecraft and reported a possible detection of P-modes.
We obtained high precision radial velocity (RV) measurements on Cen A and report in this paper our observations and the power spectrum analysis of this star.
2 Observations and data reduction
The observations of Cen A were carried out with the CORALIE fiber-fed echelle spectrograph (Queloz et al. queloz00 (2000)) mounted on the 1.2-m Swiss telescope at the ESO La Silla Observatory. CORALIE is the southern hemisphere twin of the ELODIE spectrograph (Baranne et al. baranne96 (1996)), both of them well known for their discoveries of extra-solar planets. The wavelength domain ranges from 3875 to 6820 Å recorded on 68 orders. Thanks to a slightly different optical combination at the entrance of the spectrograph and the use of a 2k by 2k CCD with 15-m pixels, CORALIE reaches a spectral resolution of 50 000 with a 3 pixels sampling. The total efficiency including atmosphere, telescope, spectrograph and detector was measured and reaches about 1.5 % at 5500 Å in the best seeing case. During stellar exposures, the spectrum of a thorium lamp carried by a second fiber is simultaneously recorded in order to monitor the spectrograph instability and thus to obtain high precision velocity measurements. Spectra are extracted and reduced in real time using the INTER-TACOS software package developed by D. Queloz and L. Weber at the Geneva Observatory (see Baranne et al. baranne96 (1996)).
The standard RV computation by a cross-correlation algorithm was replaced by an algorithm based on the optimum weight procedure first proposed by Connes (connes85 (1985)). We developed this method and showed that the optimum procedure is a factor 1.6 more efficient in term of photon noise than the cross-correlation procedure (Bouchy et al. bouchy01 (2001)). The method uses the full spectral information available and compares two spectra of the same source to compute their velocity difference. Its present limitation is that the Doppler shift must remain small compared to the line-width. This is the case in the time scale of few hours when the velocity change, dominated by Earth motion, is less than 100 m s-1 ( 1/50 of a typical stellar line-width). During a whole night, Earth motion can introduce a Doppler shift greater than 500 m s-1. An error of about 3 to 5 % is then introduced if an unique ”reference” spectrum is used during the whole night. However, this effect can be entirely eliminated by a low order polynomial fit subtraction without consequences for the characterization of high frequency oscillation modes.

Cen A was observed over 5 nights in May 2001. A journal of these observations is given in Table 1. We took sequences of 40-s exposures with a dead time of 110-s in-between. In total, 1260 spectra were collected with typical signal-to-noise ratio in the range 300 - 420 at 550 nm.
| Date | Nb spectra | ( m s-1) |
|---|---|---|
| 2001/04/29 | 220 | 1.58 |
| 2001/04/30 | 259 | 1.49 |
| 2001/05/01 | 268 | 1.39 |
| 2001/05/02 | 246 | 1.40 |
| 2001/05/03 | 267 | 1.53 |
Radial velocities are computed for each night relatively to the highest signal-to-noise ratio spectrum obtained in the middle of the night. The resulting velocities are presented in Fig. 1. The dispersion of these measurements reaches 1.47 m s-1 and the individual value of each night is listed in Table 1. The precision of our RV measurements is compared with the fundamental uncertainty due to photon noise using the method described by Bouchy et al. (bouchy01 (2001)). The uncertainties coming from the stellar spectrum and from the simultaneous thorium spectrum used in the instrumental tracking are typically the same and equal to 0.50 m s-1. The quadratic sum of these two photon noise contributions is 0.70 m s-1.
3 Power spectrum analysis
In order to compute the power spectrum of the velocity time series of Fig. 1, we used the Lomb-Scargle modified algorithm (Lomb lomb76 (1976), Scargle scargle82 (1982)) for unevenly spaced data. The resulting LS periodogram, shown in Fig. 2, exhibits a series of peaks between 1.7 and 3 mHz modulated by a broad envelope, which is the typical signature of solar-like oscillations. This signature also appears in the power spectrum of every individual night. Toward the lowest frequencies ( 0.5 mHz), the power rises and scales inversely with frequency squared as expected for instrumental instabilities. The mean white noise level , computed in the range 0.5-1.5 mHz, reaches m2 s-2. With 1260 measurements, the velocity accuracy corresponds thus to 0.98 m s-1.

Observed mode frequencies expected for solar-like stars correspond to low angular degree
and high radial order and are well approximated by the asymptotic
relation :
| (1) |
with .
The large splitting reflects the average stellar density and
is a constant near unity (1.46 for the Sun) sensitive to the
surface layers.
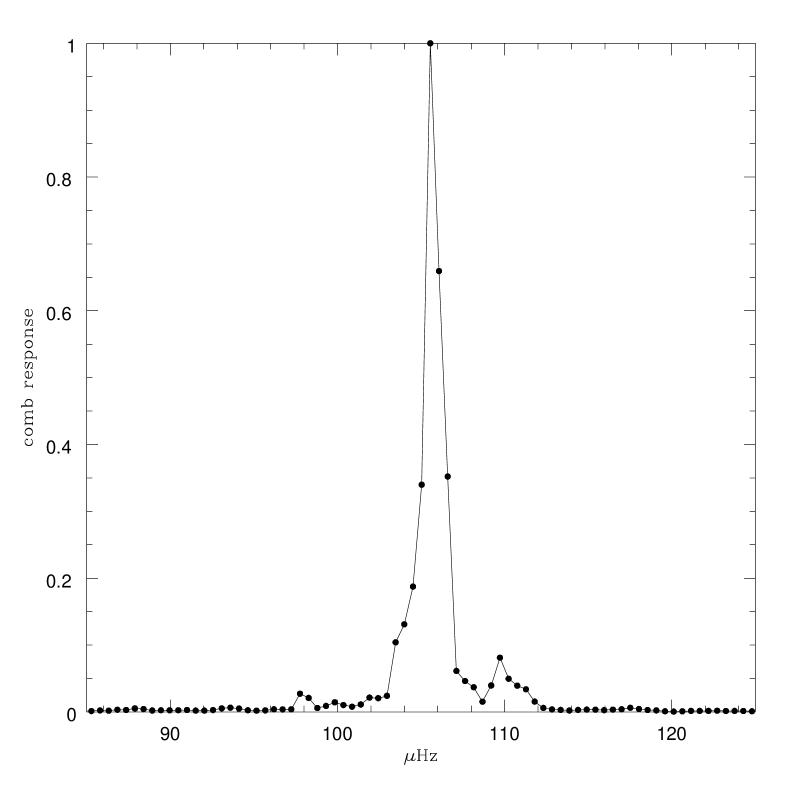
In order to determine the average large splitting
, we calculate the comb response of the power spectrum as
proposed by Kjeldsen et al. (1995b ). An average comb response
is computed using all peaks greater than 0.03 m2 s-2 (i.e. with
S/N greater than 3 in the amplitude spectrum) in the
frequency range 1.7 - 3 mHz. The resulting comb response shown in Fig. 3 gives
Hz.
In order to estimate the average amplitude of modes, we followed the method described and used by Kjeldsen & Bedding (1995a ). A simulated time series was generated with artificial signal plus noise using our window function. The generated signal corresponds to 20 modes centered at 2.36 mHz, separated by and convolved by a gaussian envelope. The generated noise is gaussian with a standard deviation of 1 m s-1. Several simulations show that the average amplitude of peaks is in the range 33 - 37 cm s-1.
An attempted identification of the strongest modes was processed with the CLEAN algorithm (Roberts et al. roberts87 (1987)) in order to remove the effect of the window function. The identified modes are listed in Table 2 and shown in Fig. 4. The values of and are deduced from the asymptotic relation (see Eq. 1) assuming that the main peak corresponds to and . With this configuration, the parameter is estimated to 1.35. This value is located in-between the Sun value (1.46) and the value deduced from theoretical models (Guenther & Demarque guenther00 (2000), Morel et al. morel00 (2000)) which give in the range 1.07 - 1.27. The last row in Table 2 gives the average large splitting for and . Both values are in agreement with this deduced from the comb response.
| = 0 | = 1 | |
| n=16 | 1833.1 | - |
| n=17 | - | - |
| n=18 | 2041.1 | 2095.6 |
| n=19 | 2146.4 | 2203.1 |
| n=20 | 2251.0 | 2308.4 |
| n=21 | 2358.9 | 2414.1 |
| n=22 | 2463.3 | 2519.1 |
| n=23 | 2566.5 | 2625.1 |
| n=24 | 2671.6 | 2732.7 |
| n=25 | - | 2838.0 |
| 105.5 0.6 | 106.1 0.4 |

4 Concluding remarks and prospects
Our observations of Cen A conduct to an obvious detection of p-mode oscillations. Several identifiable modes appear in the power spectrum between 1.7 and 3 mHz with an average large splitting of 105.7 Hz and an amplitude of about 35 cm s-1. These characteristics are in full agreement with the expected values scaling from the Sun presented in section 1 and will bring constraints on theoretical models.
This result demonstrates the power of the simultaneous thorium RV method which reaches here the precision of 1 m s-1 at frequency higher than 0.5 mHz. We hope to obtain similar convincing seismological results on some bright solar-like stars with CORALIE.
Observations of Cen A were conducted by T. Bedding and his collaborators during the same period with the UCLES spectrograph on the 3.9-m Anglo Australian Telescope and the UVES spectrograph on the 8.2-m Very Large Telescope. We hope that these observations will conduct to multi-site data combination in order to improve the spectral window and explore further the P-mode spectrum of Cen A.
We are aware that ground based observation is far from the expected accuracy of the future space missions like MOST, MONS and COROT. However the future spectrograph HARPS (Pepe et al. pepe00 (2000)), which will be installed on the 3.6-m ESO telescope at La Silla Observatory at the end of 2002, is expected to observe stars with magnitude 5 dimmer than CORALIE (Bouchy et al. bouchy01 (2001)). It will thus be able to conduct complementary ground based asteroseismological study on a large sample of stars.
Acknowledgements.
We are grateful to M. Mayor who encourages our program and gives us time allocation at the Euler Swiss telescope. D. Queloz and L. Weber are acknowledged for their help in the adaptation of the pipeline reduction needed for our observation sequences. This work was financially supported by the Swiss National Science Foundation.References
- (1) Baranne, A., Queloz, D., Mayor, M., et al., 1996, A&ASS, 119, 373
- (2) Bedding, T. R., Butler, R. P., Kjeldsen, H., et al., 2001, ApJ, 549, L105
- (3) Bouchy, F., Pepe, F., Queloz, D., 2001, A&A, in press
- (4) Brown, T. M., Gilliland, R. L., 1990, ApJ, 350, 839
- (5) Carrier, F., Bouchy, F., Kienzle, F., et al., 2001, A&A, submitted
- (6) Connes, P., 1985, Astrophys. & Space Sci, 110, 211
- (7) Edmonds, P. D., & Cram, L. E., 1995, MNRAS, 276, 1295
- (8) Gelly, G., Grec, G., Fossat, E., 1986, A&A, 164, 383
- (9) Guenther, D. B., & Demarque, P., 2000, ApJ, 531, 503
- (10) Kjeldsen, H., & Bedding, T. R., 1995a, A&A, 293, 87
- (11) Kjeldsen, H., Bedding, T. R., Viskum, M., et al., 1995b, AJ, 109, 1314
- (12) Kjeldsen, H., Bedding, T. R., Frandsen, S., et al., 1999, MNRAS, 303, 579
- (13) Lomb, N. R., 1976, Astrophys. & Space Sci, 39, 447
- (14) Martic, M., Schmitt, J., Lebrun, J.-C., et al., 1999, A&A, 351, 993
- (15) Morel, P., Provost, J., Lebreton, Y., et al., 2000, A&A, 363, 675
- (16) Pepe, F., Mayor, M., Delabre, B., et al., 2000, Proc. SPIE Vol. 4008, 582
- (17) Pottasch, E. M., Butcher, H. R., van Hoesel, F. H. J., 1992, A&A, 264, 138
- (18) Pourbaix, D., Neuforge-Verheecke, C., & Noels, A., 1999, A&A, 344, 172
- (19) Queloz, D., Mayor, M., Weber, L., et al., 2000, A&A, 354, 99
- (20) Roberts, D. H., Lehar, J., & Dreher, J. W., 1987, AJ, 93, 968
- (21) Scargle, J. D., 1982, ApJ, 263, 835
- (22) Schou, J., & Buzasi, D. L., 2001, Proc. SOHO 10/GONG 2000 Workshop, ”Helio- and Asteroseismology at the Dawn of the Millennium”, Tenerife, Spain (ESA SP-464)