A Composite Seyfert 2 X-ray Spectrum: Implications for the Origin of the Cosmic X-ray Background
Abstract
We present a composite 1–10 keV Seyfert 2 X-ray spectrum, derived from ASCA observations of a distance-limited sample of nearby galaxies. All 29 observed objects were detected. Above 3 keV, the composite spectrum is inverted, confirming that Seyfert 2 galaxies as a class have the spectral properties necessary to explain the flat shape of the cosmic X-ray background spectrum. Integrating the composite spectrum over redshift, we find that the total emission from Seyfert 2 galaxies, combined with the expected contribution from unabsorbed type 1 objects, provides an excellent match to the spectrum and intensity of the hard X-ray background. The principal uncertainty in this procedure is the cosmic evolution of the Seyfert 2 X-ray luminosity function. Separate composite spectra for objects in our sample with and without polarized broad optical emission lines are also presented.
1 Introduction
Extensive observational effort over the past two decades has provided compelling evidence that various types of radio-quiet active galactic nuclei (AGNs), despite the diversity of their apparent properties, are essentially similar objects that look different because of the presence or absence of dense circumnuclear material along our line of sight (Antonucci 1993). The primary effect of such material is to obscure the innermost regions of an active nucleus; this gives rise to a type 2 optical spectrum which consists of relatively narrow permitted and forbidden emission lines and lacks the very broad Balmer lines that characterize the spectra of unobscured (type 1) AGNs. In addition, the dense material preferentially attenuates the soft X-ray emission produced by an AGN, flattening its X-ray spectrum at lower energies (Awaki et al. 1991). This unified picture of AGNs has thus allowed significant progress to be made toward a resolution of the most enduring problem in X-ray astronomy—the origin of the cosmic X-ray background (XRB)—by providing a means by which the integrated emission from intrinsically steep-spectrum AGNs might be able to match the flat observed spectrum of the background. Models based on AGN unification have shown that absorbed active nuclei may indeed account for both the spectrum and intensity of the XRB over a broad range of energies (Setti & Woltjer 1989; Madau, Ghisellini, & Fabian 1994; Comastri et al. 1995).
These models, however, rely on several crucial assumptions: (1) that all type 2 AGNs are obscured type 1 objects; (2) that the absorption column densities of active galaxies have a specific distribution; and (3) that the X-ray luminosity function of absorbed AGNs evolves with redshift in a particular way. None of these conditions has been fully verified observationally. To explore the issue of whether or not all type 2 AGNs are hidden type 1 objects, we have conducted an optical spectropolarimetric survey of a well-defined sample of 31 nearby Seyfert 2 galaxies (Moran et al. 2000). Broad H emission has been detected in 13 of the objects, suggesting that at least 42% of Seyfert 2 galaxies are indeed obscured Seyfert 1s.111Re-observation of part of our sample has revealed faint polarized broad emission lines in NGC 5347 and NGC 5929, raising the number of hidden Seyfert 1s in our sample from 11 to 13. Details will be presented in a future paper. Recent progress has also been made toward a determination of the column density distribution in Seyfert galaxies (e.g., Bassani et al. 1999; Risaliti, Maiolino, & Salvati 1999). An alternative approach for assessing the contribution of absorbed AGNs to the XRB would be to measure their integrated broadband spectral properties within a known volume. A composite spectrum based on the summed emission of such objects would simultaneously represent several characteristics of the Seyfert 2 population that are free parameters in AGN models of the XRB. In this Letter, we present for the first time a composite 1–10 keV Seyfert 2 X-ray spectrum, derived from a large, unbiased sample of nearby objects, and discuss its implications for the origin of the XRB.
2 X-ray Observations and Analysis
Our study is based on the distance-limited sample of Ulvestad & Wilson (1989, hereafter UW89; see also Moran et al. 2000), which contains 31 type 2 Seyfert galaxies with recession velocities km s-1 and declinations . As of mid-1998, 22 objects in the sample had been (or were scheduled to be) observed with the ASCA and/or BeppoSAX satellites. We were awarded time for the nine remaining targets in ASCA Cycle 7 . Unfortunately, two of the observations scheduled prior to this were given low-priority status and were never carried out. The galaxies lacking X-ray data (NGC 5283 and NGC 5728) have average radio and optical luminosities compared to the rest of the sample, and their absence here is not expected to have a significant impact on our results. Although a number of objects were observed with both ASCA and BeppoSAX, all 29 were observed with ASCA, so we have limited our study to that dataset. In addition, because of the consistency of the response and field of view of ASCA’s Gas Imaging Spectrometers (GIS2 and GIS3), we have utilized data obtained with those instruments only.
We have employed “rev2”-processed and screened ASCA data.222See http://heasarc.gsfc.nasa.gov/docs/asca/ascarev2.html for details regarding rev2 data processing. Exposures for the majority of the sample range between 35 ks and 45 ks. All of the galaxies were observed at either the “1-CCD” or “2-CCD” positions in the field of view, so all objects are approximately the same distance off-axis in the GIS images. Two galaxies, NGC 1068 and Mrk 3, were observed twice each, but in both cases the additional data were obtained at different off-axis locations and have therefore been omitted. Source counts were extracted within a radius region centered on the galaxy for most objects; – radius regions were used for the weakest sources. The background was estimated within a radius circle centered on the optical axis, excluding an region around the source and small areas around resolved background sources, if present. Table 1 lists the galaxies observed, along with their distances (assuming km s-1 Mpc-1) and GIS exposure times. Also listed are the signal-to-noise ratios achieved with the combined GIS2 and GIS3 data in the 1–10 keV band. As the table indicates, all objects were detected above a significance of . Note, however, that over a third of the sample is detected at or below ; thus, it would be impossible to determine an accurate distribution of absorption column densities with these data. Source and background spectra with 128 channels were created for each object from the extracted events, and effective area files were generated for each of the source spectra.
Our objective is to construct a composite spectrum that is representative of the local Seyfert 2 population, i.e., one in which the contribution of individual objects is governed by their apparent luminosities, not their observed fluxes. Thus, we have multiplied the exposure times in the FITS headers of the background-subtracted spectra of each galaxy by the factor , where is the distance of the source in Mpc from Table 1. The modified GIS count rates are listed in the final column of Table 1. Summing the modified count rates of the objects (using the FTOOLS task mathpha), we obtain a composite spectrum that represents what we would observe if the objects were all located at 60 Mpc. The sums were carried out for the GIS2 and GIS3 data separately, yielding nearly identical results. The GIS2 and GIS3 sums were then averaged to produce a final composite 1–10 keV Seyfert 2 X-ray spectrum. Poisson errors were propagated at each step in the procedure. The individual effective area files were averaged with the addarf task. We note that if the objects were all 60 Mpc away, the data obtained would correspond to a total exposure time of s, which illustrates why it would be difficult to repeat this experiment for a more distant sample of comparable size.
3 The Composite Seyfert 2 X-ray Spectrum
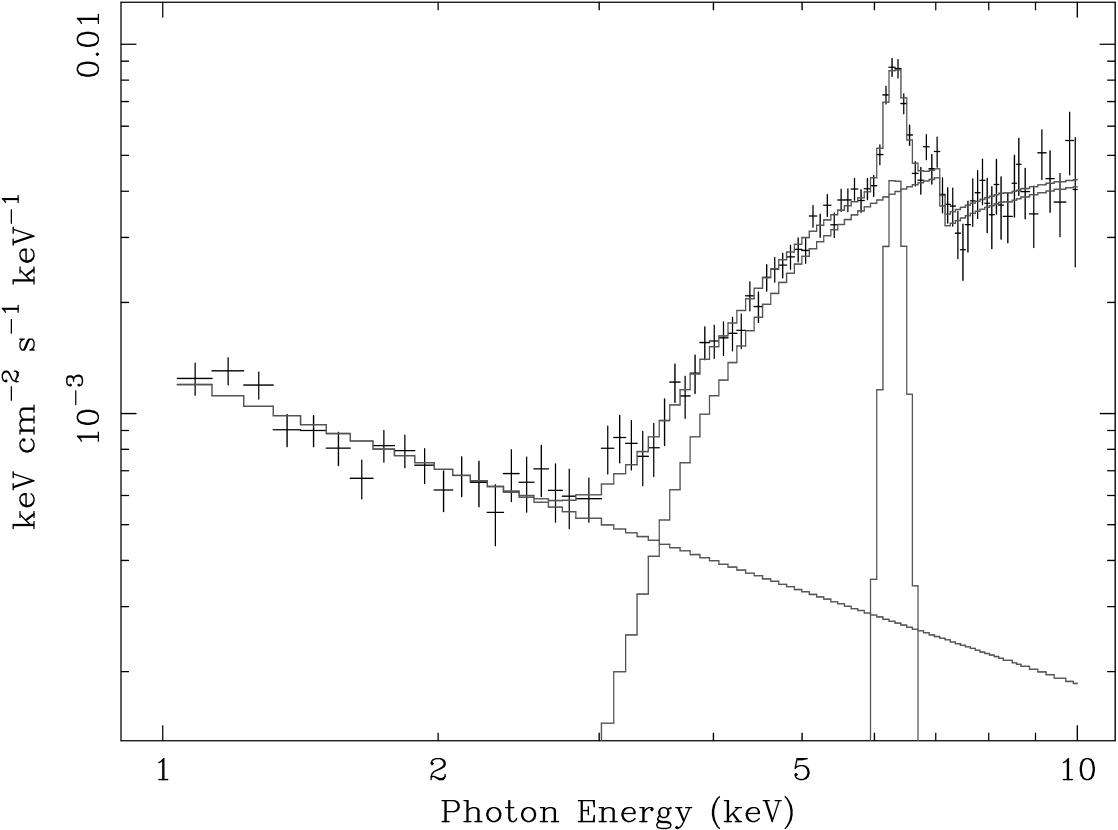
The composite 1–10 keV Seyfert 2 spectrum, derived from the combined emission of 29 galaxies, is displayed in Figure 1. There is a considerable amount of steep-spectrum emission below 3 keV, which was not anticipated in the original Seyfert 2 XRB models. Above 3 keV, however, the composite spectrum is inverted, with strong Fe K line emission at 6.4 keV (rest). Again, the objects in our sample are included on the basis of their distances and optical classifications, not their X-ray properties. The composite spectrum thus verifies that Seyfert 2 galaxies as a class have the X-ray spectral properties necessary to explain the flat shape of the XRB spectrum—something which cannot be claimed for any other extragalactic population. Examination of the modified count rates listed in Table 1 indicates that a single source, NGC 4507, contributes % of the flux of the composite spectrum and that eight other objects (Mrk 3, NGC 262, 424, 788, 1068, 3081, 3281, and 5135) are responsible for an additional %. Among these, NGC 424, 1068, and 5135 contribute mainly in the soft X-ray band. The others, which are the strongest sources above 4 keV, all have “Compton-thin” spectra with absorption column densities (inferred with the model described below) of = 2–8 cm-2.
We have modeled the composite spectrum as the sum of a Gaussian line and two power laws, one which is heavily absorbed and one which is not. An acceptable fit is obtained if we require the energy index of the power-law components to have the same value. Such a model corresponds to the “partial scattering” scenario, in which a single continuum component is observed both in transmission through dense material and via scattering along a less obscured line of sight. However, for a handful of Seyfert 2 galaxies that have been studied with BeppoSAX, this model underpredicts the observed flux in the 20–30 keV range (e.g., Cappi et al. 1999), probably because it fails to account for the presence of Compton-reflected emission. Limited to the 1–10 keV band, we are unable to constrain the strength of a reflection component in the composite spectrum. A double power-law model in which the energy indices are independent also provides an acceptable fit to the composite spectrum; the fit is shown in Figure 1. This model may not provide the correct physical description of the emission, but when it is applied to the ASCA spectra of individual Seyfert 2s observed with BeppoSAX (e.g., several of the objects studied by Cappi et al. 2000) it does accurately predict their measured fluxes in the 20–30 keV range. This is important because our estimate of the contribution of Seyfert 2 galaxies to the intensity of the XRB (§ 4) necessarily involves an extrapolation of the composite spectrum to higher energies.
We have compiled composite spectra separately for objects in our sample which do and do not exhibit evidence for polarized broad optical emission lines (see Table 1). These are displayed in Figure 2. Although there are differences in detail between these spectra, they have similar qualitative features: a declining continuum in the soft X-ray band which rises sharply at harder energies, and a prominent Fe K line. Thus, objects lacking optical evidence for a hidden broad-line region—at least the X-ray–brightest of them—display the characteristics of obscured type 1 Seyferts in the 1–10 keV range. Note that the steep soft X-ray component is relatively stronger in Seyfert 2s that do not have polarized optical emission lines, which casts some doubt on the possibility that the soft X-ray flux in these objects is mainly scattered emission.
4 Seyfert 2 Galaxies and the X-ray Background
As we have discussed previously (Moran et al. 2000), the UW89 objects comprise a reasonably complete, distance-limited sample of classical Seyfert 2 galaxies. Since they occupy a known volume, the composite spectrum we have derived is effectively an unbiased measure of the local Seyfert 2 volume emissivity (luminosity per unit volume) as a function of X-ray energy. This can be integrated over redshift using the following equation to provide an estimate of the sky brightness at energy due to such objects:
where is the volume emissivity at , is a term that describes the evolution of the volume emissivity with redshift, and and are the matter and vacuum-energy density parameters, respectively. Since we have “moved” all of the galaxies to Mpc, the composite spectrum shown in Figure 1 (which is the sum of their fluxes) is converted to a volume emissivity by multiplying by and dividing by 0.6 times the volume of a 60 Mpc sphere.333The sample does not cover the Galactic plane () or the south celestial cap (), hence the factor of 0.6. Although the evolution term is unmeasured for type 2 AGNs, it has been characterized for type 1 objects in the soft X-ray band by Miyaji, Hasinger, & Schmidt (2000). For simplicity, we have adopted their pure-density evolution model, which has the following form: for , and for (T. Miyaji 2001, private communication). This evolution model can account for all of the soft XRB with type 1 AGNs, so our results should be considered an upper limit for the contribution of type 2 Seyferts to the hard XRB. Finally, we have adopted an , cosmology for our calculations (Garnavich et al. 1998; Balbi et al. 2000; Hanany et al. 2000) and an upper integration limit of (AGNs have been detected out to this redshift).
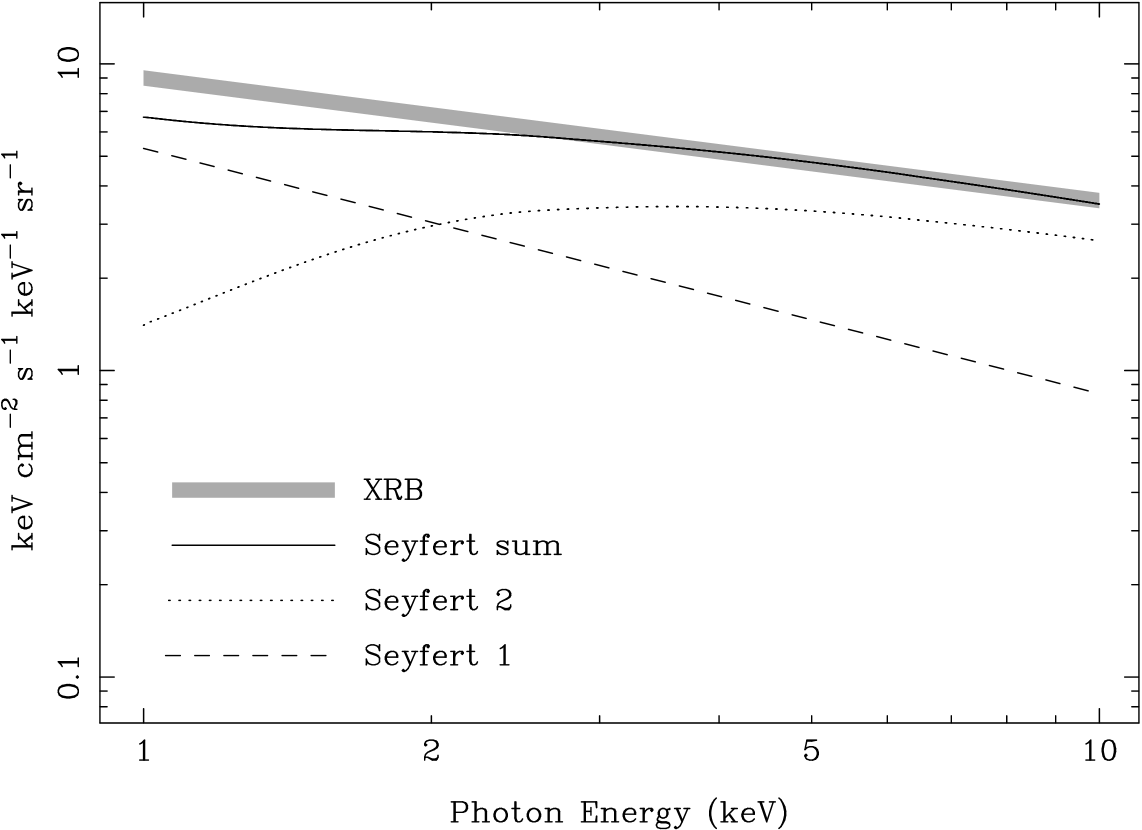
The results of the integration in the 1–10 keV band are displayed in Figure 3. As anticipated (see Gilli et al. 1999), the integration has smoothed out all of the bumps and wiggles in the composite Seyfert 2 spectrum. Assuming that steep-spectrum () type 1 AGNs produce 60% of the XRB at 1 keV—consistent with the findings of the ROSAT deep survey of the “Lockman Hole” (Schmidt et al. 1998)—the combined contribution of Seyfert 1 and Seyfert 2 galaxies agrees exceptionally well with the observed spectrum and intensity of the XRB (from Gendreau et al. 1995) above 3 keV. Our calculations are not particularly sensitive to the adopted cosmology. For example, if we assume and , the Seyfert 2 contribution we obtain has the same overall shape as that shown in Figure 3 and about two-thirds of the integrated intensity.
In conclusion, the spectrum of the summed broadband X-ray emission of nearby Seyfert 2 galaxies and its integration over redshift provide strong support for the hypothesis that absorbed AGNs play a significant (if not dominant) role in the production of the hard X-ray background. Some important details need to be investigated further before we can consider the XRB problem to be solved, namely, the average spectral properties of Seyfert 2 galaxies above 10 keV and the cosmic evolution of the Seyfert 2 X-ray luminosity function. In addition, if optically classified Seyfert 2 galaxies produce most of the hard XRB, as Figure 3 suggests, then the majority of the flat-spectrum sources being detected in deep Chandra images should be Seyfert 2s. Currently, this does not appear to be the case—a significant fraction of faint, hard Chandra sources have starlight-dominated optical spectra with emission lines that are weak or absent (Barger et al. 2001; Hornschemeier et al. 2001). It is possible that the Seyfert 2 X-ray luminosity function evolves less rapidly than we have assumed, which would leave room for other types of AGNs—objects so obscured there is no optical evidence of their activity—to emerge at faint flux levels. Alternatively, the limitations of ground-based observing have almost certainly affected our ability to classify faint Chandra sources. The majority of these sources are quite distant, so in spectroscopic observations most of the light from their host galaxies is collected along with the nuclear emission. At the low spectral resolution that is typically employed, this starlight dilution can have a profound impact on the appearance of the nuclear emission-line spectrum. A powerful demonstration of this effect has been presented by Kennicutt (1992). Thus, the faint, hard Chandra source population may not be significantly different from the nearby Seyfert 2 galaxies we have investigated here.
References
- (1) Antonucci, R. 1993, ARA&A, 31, 473
- (2) Awaki, H., Koyama, K., Inoue, H., & Halpern, J. P. 1991, PASJ, 43, 195
- (3) Balbi, A., et al. 2000, ApJ, 545, L1
- (4) Barger, A. J., Cowie, L. L., Mushotzky, R. F., & Richards, E. A. 2001, AJ, 121, 662
- (5) Bassani, L., et al. 1999, ApJS, 121, 473
- (6) Cappi, M., et al. 1999, A&A, 344, 857
- (7) Cappi, M., et al. 2000, in “Broad Band X-ray Spectra of Cosmic Sources,” eds. K. Makishima, L. Piro, & T. Takahashi (Pergamon Press), 815
- (8) Comastri, A., Setti, G., Zamorani, G., & Hasinger, G. 1995, A&A, 296, 1
- (9) Garnavich, P., et al. 1998, ApJ, 509, 74
- (10) Gendreau, K. C., et al. 1995, PASJ, 47, L5
- (11) Gilli, R., Comastri, A., Brunetti, G., & Setti, G. 1999, New Astronomy, 4, 45
- (12) Hanany, S., et al. 2000, ApJ, 545, L5
- (13) Hornschemeier, A. E., et al. 2001, ApJ, in press
- (14) Kennicutt, R. C. 1992, ApJ, 388, 310
- (15) Madau, P., Ghisellini, G., & Fabian, A. C. 1994, MNRAS, 270, L17
- (16) Miyaji, T., Hasinger, G., & Schmidt, M. 2000, A&A, 353, 25
- (17) Moran, E. C., Barth, A. J., Kay, L. E., & Filippenko, A. V. 2000, ApJ, 540, L73
- (18) Risaliti, G., Maiolino, R., & Salvati, M. 1999, ApJ, 522, 157
- (19) Setti, G., & Woltjer, L. 1989, A&A, 224, L21
- (20) Schmidt, M., et al. 1998, A&A, 329, 495
- (21) Tully, R. B. 1988, Nearby Galaxies Catalog (Cambridge: Cambridge Univ. Press)
- (22) Ulvestad, J. S., & Wilson, A. S. 1989, ApJ, 343, 659 (UW89)
| Galaxy | aaDistances (in Mpc) from Tully (1988). For the more distant sources ( km s-1), we assume . | Exp.bbAverage exposure time (in ks) per detector. | SNRccSignal-to-noise ratio for the combined 1–10 keV GIS data. | CRddModified 1–10 keV GIS count rate (in ct s-1), i.e., that which would be observed if the objects were at 60 Mpc. |
|---|---|---|---|---|
| IC 3639eeHas polarized broad optical emission lines. | 43.7 | 36.2 | 10.2 | |
| MCG 05-18-002 | 23.1 | 34.6 | 12.9 | |
| MCG 01-27-020 | 46.8 | 41.6 | 8.0 | |
| Mrk 3eeHas polarized broad optical emission lines. | 54.0 | 36.7 | 44.3 | |
| Mrk 1066 | 48.1 | 36.2 | 12.6 | |
| NGC 262eeHas polarized broad optical emission lines. | 60.1 | 45.5 | 41.4 | |
| NGC 424eeHas polarized broad optical emission lines. | 46.6 | 34.2 | 20.6 | |
| NGC 591eeHas polarized broad optical emission lines. | 60.7 | 40.9 | 7.3 | |
| NGC 788eeHas polarized broad optical emission lines. | 54.4 | 40.2 | 35.5 | |
| NGC 1068eeHas polarized broad optical emission lines. | 14.4 | 96.6 | 173.6 | |
| NGC 1358 | 53.8 | 36.2 | 9.9 | |
| NGC 1386 | 16.9 | 37.6 | 18.2 | |
| NGC 1667 | 60.7 | 42.3 | 4.2 | |
| NGC 1685 | 60.4 | 34.0 | 3.8 | |
| NGC 2273eeHas polarized broad optical emission lines. | 28.4 | 36.9 | 20.0 | |
| NGC 3081eeHas polarized broad optical emission lines. | 32.5 | 36.7 | 39.8 | |
| NGC 3281 | 42.7 | 18.4 | 19.1 | |
| NGC 3982 | 27.2 | 40.6 | 10.3 | |
| NGC 4117 | 17.0 | 38.0 | 25.3 | |
| NGC 4388eeHas polarized broad optical emission lines. | 16.8 | 28.1 | 37.1 | |
| NGC 4507eeHas polarized broad optical emission lines. | 47.2 | 40.4 | 102.9 | |
| NGC 4941 | 6.4 | 36.0 | 13.9 | |
| NGC 5135 | 54.9 | 44.0 | 18.6 | |
| NGC 5347eeHas polarized broad optical emission lines. | 36.7 | 36.7 | 6.6 | |
| NGC 5643 | 16.9 | 41.5 | 29.6 | |
| NGC 5695 | 56.4 | 24.6 | 4.6 | |
| NGC 5929eeHas polarized broad optical emission lines. | 38.5 | 42.2 | 22.1 | |
| NGC 6890 | 31.8 | 34.7 | 7.0 | |
| NGC 7672 | 53.5 | 39.3 | 4.7 |