First Application of the Fe XVII
I(17.10 Å)/I(17.05 Å) Line Ratio
to Constrain the Plasma Density of a Cosmic X-ray Source
Abstract
We show that the Fe XVII line ratio observed in the Chandra HETG spectrum of the intermediate polar EX Hydrae is significantly smaller than that observed in the Sun or other late-type stars. Using the Livermore X-ray Spectral Synthesizer, which calculates spectral models of highly charged ions based on HULLAC atomic data, we find that the observed line ratio can be explained if the plasma density . However, if photoexcitation is included in the level population kinetics, the line ratio can be explained for any density if the photoexcitation temperature kK. For photoexcitation to dominate the Fe XVII level population kinetics, the relative size of the hotspot on the white dwarf surface must be %. This constraint and the observed X-ray flux requires a density for the post-shock flow. Either way, then, the Chandra HETG spectrum of EX Hya requires a plasma density which is orders of magnitude greater than that observed in the Sun or other late-type stars.
1 Introduction
Because of the high abundance of Fe, the persistence of Ne-like Fe over a broad temperature range (–12 MK), and the large collision strengths for transitions, the – (, ) lines of Fe XVII at 15–17 Å are prominent in the X-ray spectra of high-temperature plasmas found in settings as diverse as tokamaks (Klapisch et al., 1978; Phillips et al., 1997; Beiersdorfer et al., 2001), the Sun (Rugge & McKenzie, 1985; Phillips et al., 1997; Saba et al., 1999), and both late- and early-type stars (Canizares et al., 2000; Ayres et al., 2001; Kahn et al., 2001; Waldron & Cassinelli, 2001). The importance of Fe XVII has engendered numerous studies of its atomic structure and level population kinetics, usually with an emphasis on the temperature dependence of line ratios within the – and – multiplets (Rugge & McKenzie, 1985; Smith et al., 1985; Raymond & Smith, 1986). In this paper, we focus on the density dependence of the Fe XVII X-ray spectrum.
The lowest-lying configurations of Fe XVII are the ground state, the multiplet (4 levels, –739.0 eV), the multiplet (10 levels, –789.6 eV), and the multiplet (12 levels, –826.0 eV). Because electron impact excitation from the ground state is strong for transitions into the configurations, but weak for transitions into the configuration, the population flux into the lowest-lying configuration is dominated by radiative cascades originating on higher-lying energy levels, rather than direct excitation from the ground state (Loulergue & Nussbaumer, 1973). The four levels of the configuration have, in increasing energy order, total angular momenta , 1, 0, and 1. The – transition is strictly forbidden, but the remaining three levels , 1, and 1 decay to ground, producing lines at 17.10, 17.05, and 16.78 Å, respectively. The 17.10 Å line is produced by a magnetic quadrupole transition, but it is nevertheless bright because the upper level is populated efficiently by radiative cascades, and its radiative branching ratio to ground is 1.0. Since the radiative decay rate of this transition is slow compared to the other – lines, collisional depopulation sets in at lower densities. Thus, the intensity ratio of the 17.10 Å line to any of the other – lines provides a diagnostic of the plasma density, as was first pointed out by Klapisch et al. (1978).
Of these density-dependent line ratios, we study primarily the line ratio, which has a critical density of a . To utilize this diagnostic in a cosmic X-ray source, we require an instrument with sufficient spectral resolution to cleanly resolve the two lines, and a bright X-ray source with high characteristic densities, intrinsically narrow lines, and low interstellar absorption. The instrumental requirements are supplied by the High-Energy Transmission Grating Spectrometer (HETGS; Markert et al., 1994) aboard the Chandra X-ray Observatory, and the source requirements are satisfied by nearby magnetic cataclysmic variables (CVs): semidetached binaries composed of a magnetic (–100 MG) white dwarf primary and a low-mass secondary. The global properties are different for polars (AM Her stars) and intermediate polars (DQ Her stars), but in both classes of magnetic CVs the flow of material lost by the secondary is channeled onto small spots on the white dwarf surface in the vicinity of the magnetic poles. Before reaching the stellar surface, the supersonic [] flow passes through a strong shock [ MK], where most of its kinetic energy is converted into thermal energy. For a mass-accretion rate () and a relative spot size , the density of the flow immediately behind the shock is . As the flow settles onto the white dwarf, it cools and its density increases, so the density is significantly higher where the temperature reaches a few million degrees, where Fe XVII is the dominant charge state of Fe. Doppler broadening of the emission lines is reduced because of the ordered, quasi-radial geometry, and the ever-decreasing velocity (, hence ) of the post-shock flow.
With its bright X-ray emission lines and low interstellar absorption, the well-studied (Hellier et al., 1987; Rosen, Mason, & Córdova, 1988; Hurwitz et al., 1997; Fujimoto & Ishida, 1997; Allan, Hellier, & Beardmore, 1998; Mauche, 1999) intermediate polar EX Hydrae is an ideal magnetic CV in which to study high-density plasmas. Spectroscopic evidence for high densities in this source is provided by Hurwitz et al. (1997), who used the ratio of the Fe XX/Fe XXIII 133 Å blend to the Fe XXI 129 Å line observed in an EUVE SW spectrum to infer a density for the MK plasma in EX Hya. Below, we use the Fe XVII line ratio observed in a Chandra HETG spectrum to infer a density for the MK plasma in EX Hya. We discuss the observations and analysis in §2, Fe XVII spectral models in §3, and close with a summary and discussion in §4.
2 Observations and Analysis
The Chandra HETG/ACIS-S observation of EX Hya was performed between 2000 May 18 and May 19 UT for a total exposure of 59.1 ks. Extraction of the grating spectra and calculation of the effective area files was accomplished with the CIAO 2.1 suite of software using the reprocessed data products and new calibration data files (version R4CU5UPD8) for sequence 300041. A preliminary discussion of the resulting Medium Energy Grating (MEG) and High Energy Grating spectra has been presented by Mauche et al. (2000) and Mauche (2000); here we discuss only the MEG spectrum as it bears on the Fe XVII emission spectrum.
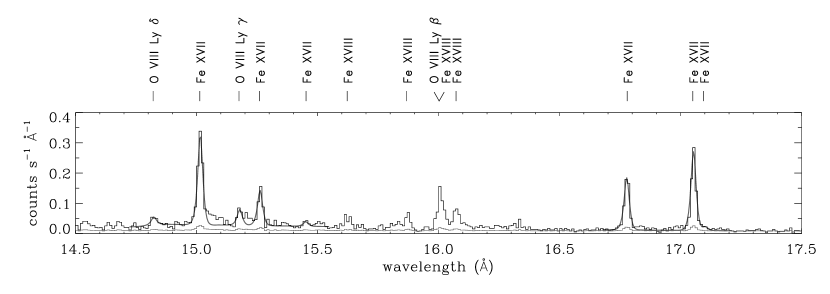
A detail of the MEG spectrum from 14.5 to 17.5 Å in shown in Figure 1. This representation of the spectrum, in , combines st orders and is binned by a factor of two to Å. As indicated along the top of the figure, the spectrum contains emission lines of Fe XVII, Fe XVIII, and O VIII. The striking aspect of this spectrum is the absence of the Fe XVII 17.10 Å emission line, a feature seen in X-ray spectra of the Sun (Rugge & McKenzie, 1985; Phillips et al., 1997; Saba et al., 1999) and other late-type stars (Canizares et al., 2000; Ayres et al., 2001).
To determine the flux in the Fe XVII emission lines, we fit the MEG spectrum over the 14.72–15.55 Å plus 16.68–17.20 Å wavelength interval with a model consisting of a linear background (to account for the thermal bremsstrahlung continuum obvious in the broadband spectrum) and eight Gaussians (to account for the six Fe XVII lines and two intervening O VIII Lyman lines). Assuming a common Gaussian width and offset, the fitting function . Fitting the MEG spectrum in Å bins, separately accounting for st orders, results in 540 data points and 528 degrees of freedom. For the wavelengths , we assume the values measured by Brown et al. (1998) for Fe XVII and tabulated by Kelly (1987) for O VIII. The resulting fit, combining st orders, is shown by the thick gray curve in Figure 1. It gives and fit parameters as follows: wavelength offset mÅ, Gaussian width mÅ, and line fluxes , , , , , and . Both the wavelength offsets and line widths are consistent with zero, given the absolute wavelength accuracy ( mÅ) and spectral resolution ( mÅ) of the MEG.
With six line fluxes we can form five independent line ratios, and to compare our values to those measured in the Sun we follow Phillips et al. (1997) and Saba et al. (1999) and use the 16.78 Å line as the reference; other line ratios of interest are and . These photon flux line ratios are listed in the middle column of Table 1. It is important to note that these ratios are virtually unaffected by interstellar absorption: for , the largest correction amounts to only 1%. For comparison, the Fe XVII photon flux line ratios for 33 solar active regions measured by Saba et al. with the Flat Crystal Spectrometer aboard the Solar Maximum Mission are listed in the right column of Table 1 (weighted mean and standard deviation). The photon flux ratios for EX Hya and the Sun are plotted in the middle panel of Figure 3. It is seen that the line ratios measured in EX Hya and the Sun are consistent with each other, with the exception of the line ratio [or, equivalently, the line ratio], which is far smaller in EX Hya.
3 Model Spectra
From the results of Klapisch et al. (1978), the small line ratio observed in EX Hya implies a plasma density in excess of a . To quantify this conclusion, we constructed model spectra for Fe XVII using the Livermore X-ray Spectral Synthesizer (LXSS), a suite of IDL codes which calculates spectral models of highly charged ions based on Hebrew University/Lawrence Livermore Atomic Code (HULLAC) atomic data. HULLAC calculates atomic wavefunctions, level energies, radiative transition rates, and oscillator strengths according to the fully relativistic, multiconfiguration, parametric potential method (Klapisch, 1971; Klapisch et al., 1977). Electron impact excitation rate coefficients are computed quasi-relativistically in the distorted wave approximation (Bar-Shalom, Klapisch, & Oreg, 1988) assuming a Maxwellian velocity distribution. Our Fe XVII model includes radiative transition rates for E1, E2, M1, and M2 decays and electron impact excitation rate coefficients for levels with principal quantum number and azimuthal quantum number for a total of 281 levels. Using these data, LXSS calculates the level populations for a given temperature and density assuming collisional-radiative equilibrium. The line intensities are then simply the product of the level populations and the radiative transition rates.
In addition to collisional excitation, photoexcitation must be accounted for in the calculation of atomic level populations in UV-bright sources like early-type stars and compact binaries. For example, in He-like ions, photoexcitation competes with collisional excitation to depopulate the level, leading to the conversion of the – forbidden line into the – intercombination blend (Gabriel & Jordan, 1969; Blumenthal, Drake, & Tucker, 1972). Thus, if the radiation field is strong enough at the appropriate wavelengths, the line ratio can be in the “high-density limit” () regardless of the density. Photoexcitation has been shown to explain the low line ratios of early-type stars (Kahn et al., 2001; Waldron & Cassinelli, 2001), and could explain the low and Fe XVII line ratios observed in EX Hya.
To account for photoexcitation, we included in the LXSS population kinetics calculation the photoexcitation rates , where is the continuum spectral energy distribution and are the oscillator strengths of the various transitions. For simplicity, we assume that (i.e., the radiation field is that of a blackbody of temperature ) and the dilution factor of the radiation field is equal to one-half (i.e., the X-ray emitting plasma is in close proximity to the source of the photoexcitation continuum). Both of these assumptions tend to overestimate the importance of photoexcitation. First, the actual intrinsic spectrum of EX Hya probably has a strong break at the Lyman limit, whereas a blackbody does not. This difference affects transitions with energy spacings eV such as the – () transitions in Si and S, but not those of O, Ne, and Mg. Second, the UV–EUV continuum in EX Hya must be due to both the accretion disk and the accretion-heated surface of the white dwarf. By assuming that the dilution factor is equal to one-half, we are in effect assuming that the accretion-heated surface of the white dwarf is the dominant source of the UV–EUV light. This assumption is justified on the basis of the similarity of the shape and intensity of the FUV spectra of EX Hya (with a disk) and AM Her (without a disk) (Mauche, 1999). With these assumptions, we find for a blackbody temperature kK (see below) that all of the He-like line ratios through Si XIII are significantly affected by photoexcitation, whereas the Fe XVII line ratio is not.
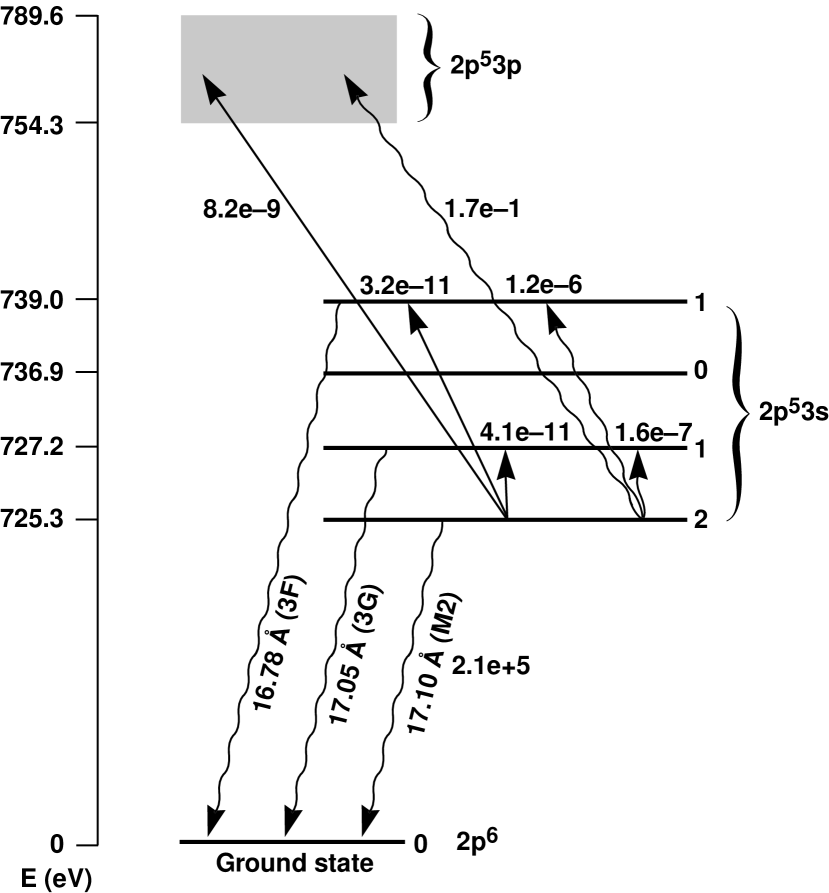
To understand this result, we show in Figure 2 a schematic of the important level population processes for the level of Fe XVII: the 17.10 Å radiative decay (downward-pointing wavy line), collisional excitations (upward-pointing lines), and photoexcitations (upward-pointing wavy lines). Since the level is the first excited level in Fe XVII, we denote it by the subscript “2.” The numbers associated with the lines are respectively the radiative decay rate , the collision rate coefficients for MK, and the oscillator strengths (we report and for the ten transitions into the manifold). Because of the large effective oscillator strength for photoexcitations into the manifold, the population of the level, and hence the strength of the 17.10 Å emission line, can be significantly reduced if the photoexcitation continuum is sufficiently strong in the 190–410 Å waveband responsible for the – transitions. In He-like ions, it is the strength of the continuum at the wavelengths of the – transitions which affects the line ratio. For O, Ne, Mg, Si, S, Ar, Ca, and Fe these wavelengths are 1623, 1263, 1036, 865, 743, 637, 551, and 404 Å, respectively. Because the relevant waveband for Fe XVII is at shorter wavelengths/higher energies than those of He-like ions, the Fe XVII line ratio is considerably less sensitive to photoexcitation.
We used LXSS to calculate Fe XVII spectral models for a blackbody photoexcitation continuum, densities –, and temperatures –8 MK (spanning the range for which the Fe XVII ionization fraction is ; Mazzotta et al. 1998). Assuming a white dwarf mass ( cm) and distance pc, Mauche (1999) found that the FUV flux density of EX Hya could be explained if the entire white dwarf surface radiates with a blackbody spectrum with a temperature kK. Consequently, we assumed for our first set of models that kK and , 4, and 8 MK. The results of these calculations are shown in the left panel of Figure 3. It is seen that the line ratio shows the most temperature sensitivity, while the line ratio shows the least. The theoretical ratios are compared to the observed ratios for EX Hya and the Sun in the middle panel of the Figure 3. As with other theoretical models of Fe XVII (Brown, Beiersdorfer, & Widmann, 2001), we are unable to reproduce the observed [hence the ] line ratio, although the value we measure for this ratio is consistent with that measured in the Sun. The observed and line ratios are as predicted by our models, but the and line ratios are too high and too low, respectively, unless the plasma density .
It is alternatively possible that the observed line ratio could be explained if the effective temperature of the photoexcitation continuum is greater than assumed for the set of models discussed above. Indeed, following Gänsicke, Beuermann, & de Martino (1995), Mauche (1999) proposed that the spin-phase modulation of the FUV flux of EX Hya is the result of the varying aspect of a kK hotspot on a kK white dwarf. To investigate the consequences of a hotter photoexcitation continuum, we assumed for our second set of models that MK (the peak of the Fe XVII ionization fraction) and , 40, 50, and 60 kK. The results of these calculations are shown in the right panel of Figure 3. It is seen that the and line ratios are sensitive to the temperature of the photoexcitation continuum, whereas the and line ratios are not. The line ratio is driven toward zero (the “high-density limit”) for blackbody temperatures kK.
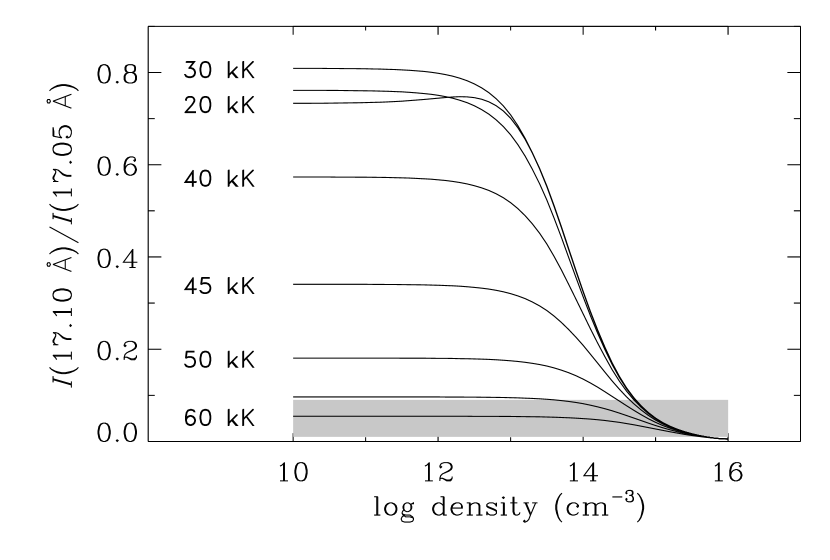
To demonstrate the level of sensitivity to photoexcitation of the line, we show in Figure 4 a plot of the line ratio as a function of density assuming a plasma temperature MK and blackbody temperatures , 30, 35, 40, 45, 50, 55, and 60 kK. The curve for kK is virtually identical to the curve without photoexcitation. As the blackbody temperature increases, the line ratio at low densities is seen first to increase slightly and then decrease strongly, approaching the high-density limit for kK. If the low line ratio observed in EX Hya is due solely to photoexcitation, the blackbody temperature kK. With there is no observable flux in the EUV for any of these models, so the only constraint is that they not produce too much flux in the UV. Assuming that the maximum 1010 Å flux density is (Mauche, 1999), the fractional emitting area of these hotspots must be , 2.6%, 2.0%, and 1.5% for , 50, 55, and 60 kK, respectively.
4 Summary and Discussion
We have shown that the Fe XVII line ratio observed in the Chandra HETG spectrum of EX Hya is significantly smaller than that observed in the Sun or other late-type stars. Using LXSS, a new plasma code based on HULLAC atomic data, we find that the observed line ratio can be explained if the plasma density . However, if photoexcitation is included in the level population kinetics, the line ratio can be explained for any density if the photoexcitation temperature kK. This latter model is consistent with the assumptions (blackbody emitter, dilution factor equal to one-half) and the observed UV flux density only if this hotspot, and the overlying volume of million-degree plasma, covers a very small fraction of the surface area of the white dwarf: . Such a hotspot is smaller and hotter than is usually inferred from optical and UV light curves, but it is possible that the accretion-heated photosphere of the white dwarf contains a range of temperatures, with the required kK spot applying only to that unfortunate piece of real estate lying directly beneath the accretion column. A surrounding larger () and cooler ( kK) suburb might then produce the flux modulations observed at longer wavelengths, but to account for its contribution to the UV flux density, the hottest part of the spot would have to be even smaller. The mean 0.5–10 keV flux of EX Hya during our observation was , and with a white dwarf mass ( cm) and distance pc, this implies an X-ray luminosity , hence a mass-accretion rate , hence a post-shock density for . Either way, then, the Chandra HETG spectrum of EX Hya requires a plasma density which is orders of magnitude greater than that observed in the Sun or other late-type stars. The Fe XVII density diagnostic is useful in sources in which the efficacy of the He-like density diagnostics is compromised by the presence of a bright UV continuum.
References
- Allan, Hellier, & Beardmore (1998) Allan, A., Hellier, C., & Beardmore, A. 1998, MNRAS, 295, 167
- Ayres et al. (2001) Ayres, T. R., et al. 2001, ApJ, 549, 554
- Bar-Shalom, Klapisch, & Oreg (1988) Bar-Shalom, A., Klapisch, M., & Oreg, J. 1988, Phys. Rev. A, 38, 1773
- Beiersdorfer et al. (2001) Beiersdorfer, P., von Goeler, S., Bitter, M., & Thorn, D. B. 2001, in preparation
- Blumenthal, Drake, & Tucker (1972) Blumenthal, G. R., Drake, G. W. F., & Tucker, W. H. 1972, ApJ, 172, 205
- Brown et al. (1998) Brown, G. V., Beiersdorfer, P., Liedahl, D. A., Widmann, K., & Kahn, S. M. 1998, ApJ, 502, 1015
- Brown, Beiersdorfer, & Widmann (2001) Brown, G. V., Beiersdorfer, P., & Widmann, K. 2001, Phys. Rev. A, 63, 032719
- Canizares et al. (2000) Canizares, C. R., et al. 2000, ApJ, 539, L41
- Fujimoto & Ishida (1997) Fujimoto, R., & Ishida, M. 1997, ApJ, 474, 774
- Gabriel & Jordan (1969) Gabriel, A. H., & Jordan, C. 1969, MNRAS, 145, 241
- Gänsicke, Beuermann, & de Martino (1995) Gänsicke, B. T., Beuermann, K., & de Martino, D. 1995, A&A, 303, 127
- Hellier et al. (1987) Hellier, C., Mason, K. O., Rosen, S. R., & Córdova, F. A. 1987, MNRAS, 228, 463
- Hurwitz et al. (1997) Hurwitz, M., Sirk, M., Bowyer, S., & Ko, Y.-K. 1997, ApJ, 477, 390
- Kahn et al. (2001) Kahn, S. M., et al. 2001, A&A, 365, L312
- Kelly (1987) Kelly, R. L. 1987, Atomic and Ionic Spectrum Lines below 200 Angstroms: Hydrogen through Krypton (New York: AIP)
- Klapisch (1971) Klapisch, M. 1971, Computer Phys. Comm., 2, 239
- Klapisch et al. (1977) Klapisch, M., Schwob, J., Fraenkel, B., & Oreg, J. 1977, J. Opt. Soc. Am., 67, 148
- Klapisch et al. (1978) Klapisch, M., et al. 1978, Phys. Letters, 69A, 34
- Loulergue & Nussbaumer (1973) Loulergue, M., & Nussbaumer, H. 1973, A&A, 24, 209
- Markert et al. (1994) Markert, T. H., et al. 1994, Proc. SPIE, 2280, 168
- Mauche (1999) Mauche, C. W. 1999, ApJ, 520, 822.
- Mauche et al. (2000) Mauche, C. W., et al. 2000, BAAS, 32, #3, 1179
- Mauche (2000) Mauche, C. W. 2000, BAAS, 32, #4, 1561
- Mazzotta et al. (1998) Mazzotta, P., Mazzitelli, G., Colafrancesco, S., & Vittorio, N. 1998, A&AS, 133, 403
- Phillips et al. (1997) Phillips, K. J. H., Greer, C. J., Bhatia, A. K., Coffey, I. H., Barnsley, R., & Keenan, F. P. 1997, A&A, 324, 381
- Raymond & Smith (1986) Raymond, J. C., & Smith, B. W. 1986, ApJ, 306, 762
- Rosen, Mason, & Córdova (1988) Rosen, S. R., Mason, K. O., & Córdova, F. A. 1988, MNRAS, 231, 549
- Rugge & McKenzie (1985) Rugge, H. R., & McKenzie, D. L. 1985, ApJ, 297, 338
- Saba et al. (1999) Saba, J. L. R., Schmelz, J. T., Bhatia, A. K., & Strong, K. T. 1999, ApJ, 510, 1064
- Smith et al. (1985) Smith, B. W., Raymond, J. C., Mann, J. B., & Cowan, R. D. 1985, ApJ, 298, 898
- Waldron & Cassinelli (2001) Waldron, W. L., & Cassinelli, J. P. 2001, ApJ, 548, L45
| Ratio | EX Hya | Sun |
|---|---|---|
| . | ||
| . | ||
| . | ||
| . | ||
| . | ||
| . | ||
| . |