Environment and Galaxy Evolution at Intermediate Redshift in the CNOC2 Survey
Abstract
The systematic variation of galaxy colors and types with clustering environment could either be the result of local conditions at formation or subsequent environmental effects as larger scale structures draw together galaxies whose stellar mass is largely in place. Below redshift 0.7 galaxy luminosities (k-corrected and evolution compensated) are relatively invariant, whereas galaxy star formation rates, as reflected in their colors, are a “transient” property that have a wide range for a given luminosity. The relations between these galaxy properties and the clustering properties are key statistics for understanding the forces driving late-time galaxy evolution. At the co-moving galaxy correlation length, , measured in the CNOC2 sample is strongly color dependent, rising from 2 Mpc to nearly 10 Mpc as the volume-limited subsamples range from blue to red. The luminosity dependence of at is weak below in the R band, although there is an upturn at high luminosity where its interpretation depends on separating it from the -color relation. In the B band there is a slow, smooth increase of with luminosity, at least partially related to the color dependence. Study of the evolution of galaxies within groups, which create much of the strongly nonlinear correlation signal, allows a physical investigation of the source of these relations. The dominant effect of the group environment on star formation is seen in the radial gradient of the mean galaxy colors which on the average become redder than the field toward the group centers. The color differentiation begins around the dynamical radius of virialization of the groups. The redder-than-field trend applies to groups with a line-of-sight velocity dispersion, . There is an indication, somewhat statistically insecure, that the high luminosity galaxies in groups with become bluer toward the group center. Monte Carlo orbit integrations initiated at the measured positions and velocities show that the rate of galaxy merging in the groups is very low, whereas for about 25% of the galaxies will merge in 0.5Gyr. We conclude that the higher velocity dispersion groups largely act to suppress star formation relative to the less clustered field, leading to “embalmed” galaxies. On the other hand, the low velocity dispersion groups are prime sites of both strong merging and enhanced star formation that leads to the formation of some new massive galaxies at intermediate redshifts. The tidal fields within the groups appear to be a strong candidate for the physical source of the reduction of star formation in group galaxies relative to field. Tides operate effectively at all velocity dispersions to remove gas rich companions and low density gas in galactic halos. We find a close resemblance of the color dependent galaxy luminosity function evolution in the field and groups, suggesting that the clustering dependent star formation reduction mechanism is important for the evolution of field galaxies as a whole.
1 Introduction
Environment plays a major role in the formation and evolution of galaxies as is dramatically manifest in the differences between galaxies in rich clusters and the field (Dressler, 1980). The environmental effect is mainly one to alter the distribution over galaxy type, with even the somewhat exotic E+A galaxies being found in the field (Zabludoff et al, 1996). A notable exception is the cD galaxies, but even those are believed to originate from an early-epoch field population (Dubinski, 1998). It is ambiguous at any single redshift whether the systematically redder and earlier morphological types of cluster galaxies, as compared to the field galaxy population, are the result of different local conditions at the time of formation, or, whether all galaxies begin as a fairly uniform distribution of types which subsequent evolutionary forces differentiate as a function of environment. Examining the redshift dependence of galaxy populations is a powerful tool to separate low redshift environmentally driven changes from high redshift formation mechanisms as the primary cause of the differences.
An example of the study of the environmental dependence of populations with redshift is the star formation rate of cluster galaxies at intermediate redshift. On the average, cluster galaxy star formation rates are smaller than those in field galaxies, with a progressive decline to the cluster center (Dressler, 1980; Whitmore Gilmore & Jones, 1993; Balogh et al., 1999; Poggianti et al, 1999; Ellingson Lin Yee & Carlberg, 2001). This suggests that a field “mix” of galaxies is capable of being transformed into an earlier type cluster population in response to the cluster environment. Cluster galaxies provide important clues of environmental forcing but they are a moderately rare population subject to exceptionally strong environmental forces.
Galaxy groups show many of the differences from the field galaxy population that cluster galaxies exhibit (Zabludoff & Mulchaey, 1998; Hashimoto & Oemler, 2000; Tran Simard & Zabludoff, 2001). The evolution of group galaxies is necessarily a significant component of the evolution of the entire galaxy population. Approximately of galaxies reside in small virialized galaxy groups (Nolthenius & White, 1987; Carlberg et al, 2001), and virtually all galaxies are in groups if the luminosity limit for inclusion is lowered sufficiently. For instance, the Milky Way Galaxy, with the Large and Small Magellanic Clouds, constitutes a small virialized group (which falls just slightly short of meeting the luminosity requirements of the groups we define below). The Local Group also usefully illustrates that the lowest velocity dispersion groups overlap the velocity dispersion range of individual and pairs of galaxies. The mean pairwise 1D peculiar velocity dispersion of galaxies is 300-500 km s-1 (Davis & Peebles, 1983; Marzke Geller da Costa & Huchra, 1995; Peacock et al, 2001; Zehavi et al., 2001) indicating that groups with one dimensional velocity dispersions, , in the range of 200-300 km s-1 dominate the clustering of field galaxies.
Some combination of internal clocks and external agents drives galaxy evolution. Internal timescales are regulated by dynamical and thermal processes, with generally fairly fast clocks, whereas the external timescales are controlled by the structures in which galaxies find themselves and the rate of development of large scale clustering, clocks running at approximately the Hubble rate. At a given galaxy type, both field and group galaxies have essentially identical internal processes. Consequently, clustering dependent population differences must be due to either conditions at formation or subsequent environmental interactions. Galaxy formation is not a process that occurs at a sharply defined time. However, for the intermediate redshift range we examine here normal luminous galaxies of a wide range of type can be taken to essentially “formed” with varying degrees of ongoing star formation and merging that do not grossly alter the stellar mass of the galaxies.
Gravitational tides, dynamical friction and intergalactic gas pressure are two physical forces present in groups that can affect their galaxy contents. Small galaxy groups have been investigated extensively at low redshift (Burbidge & Burbidge, 1960; Huchra & Geller, 1982; Ramella Geller & Huchra, 1989; Mahdavi & Geller, 2001) and at intermediate redshift (Carlberg et al, 2001) to show that the total mass of a virialized group is dominated by dark matter. One action of the dark matter is to cause dynamical friction, whose in-spiral timescale varies in proportion to . Detailed dynamical analysis (Merritt, 1984, 1985) and n-body simulations (Mamon, 1987; Dubinski, 1998) provide quantitative evidence that high velocity dispersion clusters do not suffer much internal dynamical evolution of their galaxy populations after their primary formation phase. However, low velocity dispersion groups are found to produce mergers on a cosmologically short timescale, even at low redshift where the virialization density, approximately 200 times the critical density, is at a minimum (Barnes, 1985, 1990; Bode Cohn & Lugger, 1993; Bode Berrington Cohn & Lugger, 1994; Mamon, 1987; Diaferio Geller & Ramella, 1994; Moore Lake & Katz, 1998). Galaxy groups also contain X-ray emitting hot gas that work on the gas content of galaxies (Mulchaey, 2000). Ram pressure stripping declines in proportion to the velocity dispersion (squared), so plays a relatively less important role in groups than in large clusters (Abadi Moore & Bower, 1999; Balogh Navarro & Morris, 2000).
The evidence that groups play a significant role in galaxy evolution is strong, but the observationally confirmed effects of groups vary with the group definition and are largely confined to low redshift samples. For instance, the Hickson (1982) compact groups are deliberately designed to be quite high density groups. They are found to include a number of strongly interacting and likely-to-be-merging systems with enhanced star formation (Hickson, 1997; Hashimoto & Oemler, 2000). The ultimate fate predicted for the galaxies in isolated low velocity dispersion groups is to join to form a single massive elliptical galaxy (Barnes, 1990; Mulchaey & Zabludoff, 1999). Groups defined with a lower density threshold are observed to have suppressed star formation relative to the field (Allam Tucker Lin & Hashimoto, 1999; Tran Simard & Zabludoff, 2001) reminiscent of the effect that is seen in rich clusters.
An empirical study of groups uniformly selected from the field at opens up the possibility of detecting differential evolutionary effects between groups and the field. Galaxy evolution over the range from to is substantial (Broadhurst Ellis & Shanks, 1988) particularly in relatively blue galaxies less luminous than (Lilly et al., 1995; Lin et al., 1999). The physical origin of this evolution remains uncertain, although it is clear that in indvidual galaxies it is superimposed on a slowly aging underlying stellar population and that it primarily requires regulation of the star formation rate (Lilly Le Fevre Hammer & Crampton, 1996). Galaxy groups in this redshift range have been defined with photometric data (de Mello Infante & Menanteau, 1997) and with radio-galaxies as centers (Allington-Smith Ellis Zirbel & Oemler, 1993) but large, kinematically accurate redshift catalogs are needed to put intermediate redshift groups on the same standing as those at low redshift.
In the next section we review the Canadian Network for Observational Cosmology field galaxy redshift survey (CNOC2) sample which contains about 6000 galaxies with velocities measured to a precision of about 70-100 km s-1 over the redshift range. The sample was selected to minimize clustering dependent differential selection effects so that the relative evolution of group and field galaxies can be readily examined. We first use the field sample as a whole to show the correlation function’s strong dependence on color and relatively weak luminosity dependence. Section 3 discusses the color and luminosity distribution of field and group galaxies and their change with redshift. The variation of the mean galaxy colors with distance from the group center is discussed for high and low velocity dispersion groups in Section 4. The orbits of the group galaxies are Monte Carlo integrated in Section 5 to determine their likelihood of merging. Section 6 discuses the implications of our findings for galaxy evolution and states our conclusions. Most quantities in this paper are derived with and an , cosmology, with exceptions noted.
2 The Galaxy Clustering-Color Relation at
The CNOC2 field galaxy redshift survey covers approximately 1.5 square degrees of sky spread over 4 widely separated sky patches (Yee et al., 2000). The unbiased redshift sample covers the 0.1 to 0.55 redshift range. The survey has an accurately measured selection function that varies from nearly 100% at R=19 mag down to about 20% at the limit of R=21.5 mag. The selection function is used to correct the spectroscopic sample numbers back to what a complete sample would, on the average, contain. For each galaxy k-corrections are evaluated in all observed colors using the closest approximating Coleman, Wu & Weedman (1980) spectral energy distribution (SED) using a finely interpolated set of SEDs. The evolution of the k-corrected galaxy luminosity function as a function of non-evolving SED type has been discussed elsewhere (Lin et al., 1999). We use these results to define a luminosity evolution compensation term, intended to identify statistically the same population over our entire redshift range. This is valid for the population as a whole or two color sub-classes which are our samples of interest. An accurate galaxy-by-galaxy correction requires more information, ideally using a mass indicator such as IR luminosity or dynamical masses. The k-corrected and evolution compensated R band luminosities, , are calculated as , where the mean evolution rate, , is approximately compensated with a fading of one magnitude per unit redshift for all SED types. This approach is statistically acceptable for the relatively high luminosity galaxies we use in this paper, but cannot be extended to lower luminosity blue galaxies which require either an allowance for more luminosity evolution or number evolution.
The central observational results presented in this paper address the dependence of colors on clustering environment. Within our photometric dataset the color which best serves as our star formation rate indicator is the k-corrected color . We are motivated to use this color because all our galaxies have and observations, with less deep coverage in and a limited redshift range for the [OII] 3727Å line. Of course has a dependence on factors other than star formation alone, such as metallicity, dust and the details of the star formation history. Our study depends on a comparison of various sub-samples where serves to indicate the relative star formation rates.
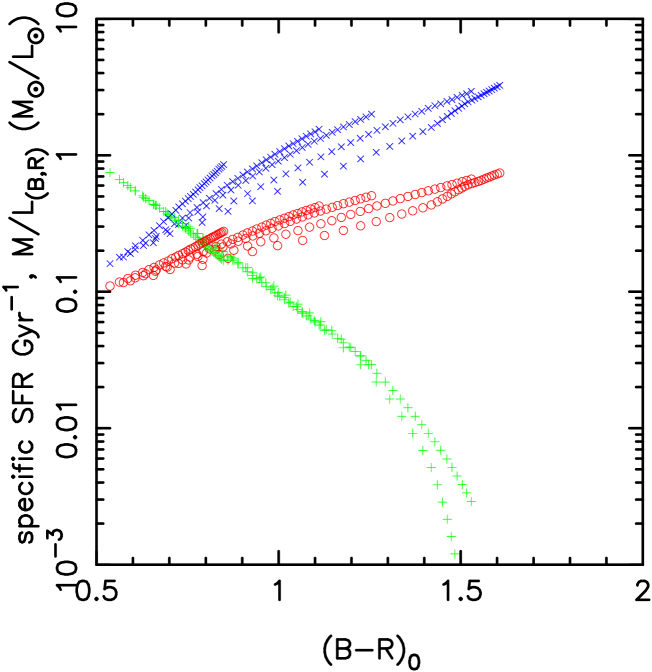
To explicitly relate the colors to star formation rates we use the PEGASE.2 models (Fioc & Rocca-Volmerange, 1997). We also examine the stellar mass-to-light ratio, , for its population dependence. Figure Environment and Galaxy Evolution at Intermediate Redshift in the CNOC2 Survey plots the star formation rate and the mass-to-light ratio, M/L, in the R and B bands, against the rest-frame color. Points are plotted every model years of age. All the photometric models are assumed to be dust free and have exponentially declining star formation rates, , with 2, 4 and 6 Gyr at solar metallicity and a Gyr at twice solar. The colors are plotted for model ages of 3 to 12 Gyr. The figure shows that color (assuming no dust) indicates the current star formation rate, largely independent of the details of the history of the star formation, although we see the well known effect that the metallicity is important in the color of galaxies with low star formation rates. We note that the M/L value of the stellar population varies about a factor of two less in the R band than in the B band.
Our analysis of the redshift dependence of the two-point correlation function of the CNOC2 sample finds that the correlation length, , is nearly constant in co-moving co-ordinates (Carlberg et al 2000b, ). The sample is volume limited on the basis of k-corrected and evolution compensated luminosities, mag. Our correlation measurements are consistent with the theoretical predictions of a slow increase of biasing of galaxies relative to the dark matter increasing with redshift.
The intermediate redshift clustering of the CNOC2 sample varies strongly with the mean SED type of the galaxies (Shepherd et al., 2001), with late type galaxies being far less clustered than early type galaxies. The clustering analysis divides galaxies based on non-evolving SED types, hence, the dependence of clustering with type evolves with redshift as galaxies move to later types with increasing redshift (Shepherd et al., 2001). Here we complement our earlier analysis with a larger sample, in a narrower redshift range. We are particularly interested in the relative sensitivity of to star formation and luminosity. We use the redshift range 0.25 to 0.45, in which the bulk of the CNOC2 sample falls. Figure Environment and Galaxy Evolution at Intermediate Redshift in the CNOC2 Survey shows the dependence of the co-moving correlation length on , analyzed in a flat cosmology ( gives that are about 10% smaller at the average redshift of 0.39). The sample is volume limited, with mag. The correlation measurements are made with exactly the same procedures as discussed in Carlberg et al. (2000). We fit the measured projected correlation function to the projection of a power law correlation function, , where all lengths are measured in co-moving units. The derived and are shown in Figure Environment and Galaxy Evolution at Intermediate Redshift in the CNOC2 Survey along with the errors estimated on the basis of the variance of the four observational patches in the sample. The slope of the correlation function, becomes steeper with increasingly red color. Both of these effects are known at lower redshift as morphological type or emission/absorption line galaxy correlations although the large range of correlation amplitudes we find is not so readily apparent at low redshift (Davis & Geller, 1976; Saunders Rowan-Robinson & Lawrence, 1992; Fisher et al., 1994; Guzzo et al., 1997; Willmer da Costa & Pellegrini, 1998; Loveday Tresse & Maddox, 1999). The most relevant measure of correlation amplitude in a situation where the vary systematically is to show the correlation length normalized to a fixed , here chosen to be . As shown in Figure Environment and Galaxy Evolution at Intermediate Redshift in the CNOC2 Survey these values range from about 2 Mpc for the bluest galaxies to nearly 10 Mpc for the reddest galaxies. The errors in these figures are estimated using the patch to patch variance over our four widely separated patches, which is a robust empirical estimator.
Shepherd et al. (2001) found that there is a weak luminosity increase (or none) of clustering within each SED class over a luminosity range of 1.5 magnitudes. Here we examine the luminosity dependence of clustering over a 3.0 magnitude range, displaying the result in Figure Environment and Galaxy Evolution at Intermediate Redshift in the CNOC2 Survey. Recall that in the R band mag and in the B band mag. At lower luminosities, to , the Figure shows that could rise about 10% for the factor of ten luminosity increase (for ), but the difference is statistically consistent with an even weaker relation. Galaxies more luminous than show a highly significant increase in clustering, rising from for to 8 Mpc. However, the mean color in this bin is mag, which is about 0.25 mag redder than the lower luminosity members of the sample. Referring to the color dependence of Figure Environment and Galaxy Evolution at Intermediate Redshift in the CNOC2 Survey indicates that at a mean color of we expect . The highest luminosity galaxies here have . Consequently the increase in clustering in this high luminosity sample could be largely the result of the correlation-color relation. This is difficult to disentangle, since virtually all high luminosity galaxies are quite red, leaving too few luminous blue galaxies in the present sample for an accurate clustering measurement.
We can compare our intermediate redshift results with similar low redshift results. We show in Figure Environment and Galaxy Evolution at Intermediate Redshift in the CNOC2 Surveya the clustering-luminosity relation found in the low redshift SDSS (Zehavi et al., 2001) using R band luminosity, where we convert SDSS to Cousins using (Fukugita Shimasaku & Ichikawa, 1995). A similar low redshift R band luminosity dependence of clustering was seen in the LCRS (Lin et al, 1996). In Figure Environment and Galaxy Evolution at Intermediate Redshift in the CNOC2 Surveyb we show our measurements of the dependence of clustering on B band luminosity along with the relation found in the 2dF survey (Norberg et al., 2001). The 2dF paper interprets the luminosity dependence as a result of the natural bias mechanism, in which dark matter halo clustering increases with halo mass. However, galaxies of all masses are subject to considerable clustering dependent evolutionary forces. Here we note that our clustering results at have a luminosity dependence statistically identical with those of the SDSS and 2dF surveys at low redshift, confirming our “no co-comoving co-ordinate clustering evolution” result. However, we also note that is a function of both galaxy mass, a relative fixed property at late times, and the current star formation rate, which can vary substantially. The advantage of some range of redshift is that we can use it to deepen the study of the relation of clustering, mass, star formation and their evolution.
The theoretical predictions for clustering are clearest for dark halos, which are increasingly clustered with mass (Mo & White, 1996; Jing, 1998). The theory works quite well to predict the relative clustering of our small galaxy groups relative to the clustering of individual galaxies (Carlberg et al, 2001). However, the luminosity dependence of clustering requires a procedure to associate a luminosity with dark halos, ultimately requiring a fairly detailed parameterization of the galaxy formation history. Within semi-analytic models (Kauffmann Colberg Diaferio & White, 1999; Benson et al 2000a, ; Benson et al 2000b, ; Somerville et al., 2001) galaxy clustering is expected to have a dependence on the star formation rate and a weak luminosity dependence, but the details (even the sign of the effect) depend significantly on the adopted cosmology, as well as the merger and gas cooling history. At this stage no published model simultaneously quantitatively predicts the CNOC2 overall correlation evolution and its star formation dependence. Some models find that the bluest galaxies are very strongly clustered at late times, likely as a result of a high merger rate driving star formation, which is in significant contrast to our observational results. Understanding the origin of the strong color- relation is fundamental to understanding the late time evolution of galaxies. Since galaxies in small groups and pairs generate much of the correlation function, this paper empirically investigates this question through the evolution of galaxies in small groups.
The clustering-color (or density-star formation) relation shown in Figure Environment and Galaxy Evolution at Intermediate Redshift in the CNOC2 Survey must evolve with redshift. At the current epoch a similar relation holds, but the bluest galaxies are a relatively smaller fraction of the galaxy population as a consequence of ongoing evolution. Clustering is predicted to change slowly with redshift. Clearly, for some fixed total stellar mass, the galaxies with the lowest star formation rates at intermediate redshift must have had higher than average star formation rates at high redshift. If the clustering properties of those galaxies change slowly relative to the rate at which their colors change, then it follows that at some higher redshift the most strongly clustered galaxies are also the ones with the highest star formation rates. The Mo-White formalism predicts that the high redshift progenitors of the galaxies with must have correlations at redshifts of two or three that increase over their lower redshift values. Even Lyman break galaxies at are only clustered with (Adelberger et al., 1998).
3 Global Properties of Group and Field Galaxies
The CNOC2 redshifts have a velocity precision of 70 to 100 km s-1 in the rest frame of the galaxies. Our group selection procedure (Carlberg et al, 2001) is applied to the mag sample used in the clustering analysis above. The CNOC2 approach to finding galaxy groups is, in brief, as follows. Groups with three or more members are identified using an algorithm that begins with a friends-of-friends linking in redshift space. These trial groups are refined to a “virialized” set using an iterative procedure designed to ensure that all galaxies are within the estimated radius of virialization for a low density cosmology, , where is the radius at which the mean interior over-density is 200 times the critical value. Kinematic group definitions are the most objective approach available, but remain subject to the redshift space interlopers. The resulting groups have centers in position and redshift that do not depend strongly on the group identification details. However, the velocity dispersion of the groups is sensitive to the search distance in the redshift direction and as individuals the groups are subject to large statistical errors, see Carlberg et al. (2001) for a discussion. In spite of these complications the statistical properties of the groups appear to be fairly robust.
The groups used in this paper are identified with a maximum projected distance linking length of 0.25 Mpc and a “standard” redshift distance maximum linking length of 5 Mpc. These parameters, applied within our group identification procedure, yield 195 groups containing 754 galaxies in the 0.1 to 0.55 redshift range. The sample is complete to about redshift 0.45.
On the average, the groups have 3.8 members with redshifts. Given the small numbers, there are large errors in the derived size and velocity dispersion. Figure Environment and Galaxy Evolution at Intermediate Redshift in the CNOC2 Survey shows the number of group members with redshifts and the completeness corrected numbers versus the estimated velocity dispersion of the groups. The total number of groups with a given number of redshifts is given at the top of the figure. The numbers of group members could be increased at the cost of more complete spectroscopy at our current mag limit, or, by going deeper. However, the small numbers of members are fundamental to these small groups. Similarly small groups have an unavoidable and significant contamination from redshift space interlopers. We have demonstrated (Carlberg et al, 2001) that as a population these groups have the statistical properties one would expect to find and they cannot possibly be simply chance groupings of randomly distributed field galaxies.
3.1 Color-Luminosity and Color-Color Relations
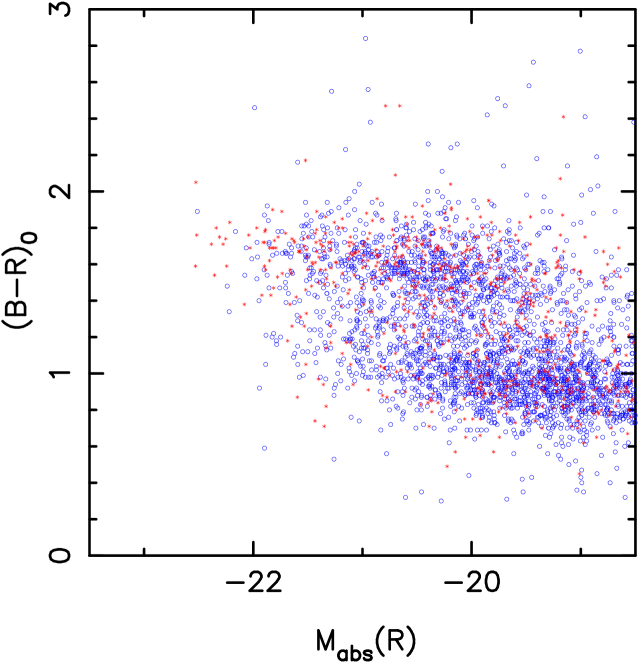
Differential evolution could lead to either completely different galaxy populations with types non-existent in the other group, or, a milder version in which the distribution of galaxies over type is different, but all types are represented in both populations. To test for this the k-corrected colors, , of the galaxies are plotted against the k-corrected and evolution compensated absolute R band absolute magnitudes for field and group galaxies in Figure Environment and Galaxy Evolution at Intermediate Redshift in the CNOC2 Survey. Groups have relatively more red galaxies, but, irrespective of environment, galaxies in both environments occupy the same total range of colors and luminosities. At low redshift this effect is seen as a morphological type difference, albeit in somewhat higher velocity dispersion groups (Zabludoff & Mulchaey, 1998). We classify galaxies into blue and red sub-samples using a color of mag. Since this color is near the minimum of the number-color relation, it can be shifted 0.05 mag either direction with minimal change in the two sub-samples.
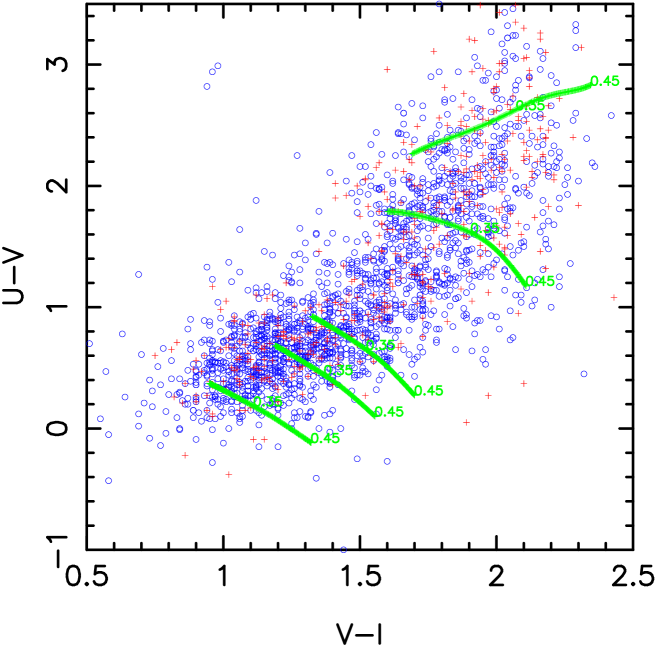
The plot of the observed vs in the redshift range 0.25 to 0.45 displayed in Figure Environment and Galaxy Evolution at Intermediate Redshift in the CNOC2 Survey further demonstrates that field and group galaxies have essentially the same range of properties present in different proportions. The limited redshift range allows us to compare the colors without k-corrections. Over-plotted are exponential star formation models from the PEGASE.2 spectral synthesis code at solar metallicity and no dust (Fioc & Rocca-Volmerange, 1997). Virtually the entire color-color plane is spanned by the exponential models. The bluest points, which are predominantly field galaxies, clearly imply fairly strong star formation over an extended period and require a burst component. The reddest points can be reached from low star formation rate models with a modest amount of dust, or, increasing the metallicity above solar. However, many of these points have fairly large errors in the observed flux so may simply be scattered out of the main distribution.
The important conclusion from these color relations is that group and field galaxies cover the same range of properties, however the relative frequency of blue and red galaxies is quite different in the two environments. One interpretation is that all the galaxies have been drawn from the same parent population, and been subject to similar evolutionary forces, but that these have been applied to different degrees in field and group environments. We can exclude the possibility that the color-luminosity relations of the two populations require unique evolutionary scenarios, even for a small subset of their population.
3.2 Color and Luminosity Distributions
The color distributions, in k-corrected , of field and group galaxies are shown for two approximately equal-volume redshift ranges, and , in Figure Environment and Galaxy Evolution at Intermediate Redshift in the CNOC2 Survey. The sample is restricted to galaxies with mag to ensure completeness to redshift 0.55. In this case we have not applied any overall redshift compensation to the luminosities in order that the redshift dependence, if present, is explicitly visible. The figure shows that the group galaxies are on the average redder than the field, for both redshift ranges. The rise in the numbers (selection function weighted) of blue field galaxies with redshift is clearly evident. However, the blue fraction in the groups, those with mag, only rises from 28% to 31% across the two redshift bins, which is not significant.
Luminosity functions allow us to sharpen the comparison of group and field galaxy evolution. We first divide the galaxies into red and blue sub-samples. A second division of the group galaxies is required since groups with low velocity dispersions, , are subject to strong dynamical friction which will lead to galaxy merging being important at a level not present in the higher velocity dispersion groups. We therefore split the group galaxies into two roughly equal sub-samples at a line-of-sight group velocity dispersion . Even though we do not directly volume normalize the samples, the sample is split into the redshift ranges of 0.1–0.36 and 0.36–0.47, which yields two nearly equal volumes of about . The average redshifts of the two bins are 0.26 and 0.40. The luminosity functions are calculated as the luminosity binned sums of the magnitude selection function weights (Lin et al., 1999), which is adequate for our purposes, although it leads to some uncorrected incompleteness at lower luminosities at higher redshift.
The field and two group luminosity functions are shown as summed weights in Figure Environment and Galaxy Evolution at Intermediate Redshift in the CNOC2 Survey where the thick and thin lines are, respectively, for the low and high redshift volumes. There is little evolution of the red galaxy luminosity functions, for either the field or group population. We measure a small increase in the mean luminosity with redshift, approximately 0.1 mag, but this difference is not statistically significant. On the other hand the blue galaxies show about mag of increase of the mean luminosity, even across this small redshift range. The low velocity dispersion groups have poor statistics, but there is weak evidence that they have a negative luminosity evolution with increasing redshift. That is, they contain relatively more high luminosity galaxies at lower redshift.
The strong field galaxy evolution of the blue population and weak evolution of the red population of left panels of Figure Environment and Galaxy Evolution at Intermediate Redshift in the CNOC2 Survey is a restatement of the results presented in our more detailed paper (Lin et al., 1999) where quantitative measures of the evolution are given. Here, our primary interest is to compare the field galaxy evolution to the group galaxy evolution. In the high velocity dispersion groups evolution is largely equal to the evolution of the field galaxies. The one possible difference is that the groups appear to have relatively more very high luminosity red galaxies than the field. Although this is not statistically significant in this sample it is reminiscent of the cD galaxies found in clusters.
The important point established in this section that both the field and group galaxy populations have very similar evolution of their color dependent luminosity functions with redshift. That is, in these two environments, the red galaxy luminosity function evolves little with redshift, whereas the blue galaxy luminosity function appears to move to higher luminosities with increasing redshift. Groups with velocity dispersion less than have poorer statistics and do not show evidence for any significant luminosity function change with redshift.
4 Radial Color Gradients within Groups
The radial dependence of the colors allows a test of the various physical forces that may affect evolution. Evolutionary forces that are universal, such as the meta-galactic ionizing flux or internal processes of individual galaxies, should have almost no radial dependence across a group. Environmentally dependent evolutionary forces, such as the tidal fields of the group and its member galaxies, or gas stripping due to an inter-group medium, should have a radial dependence within a group. Orbital mixing will dilute the visibility of these effects but statistically they will remain visible, if present.
Figure Environment and Galaxy Evolution at Intermediate Redshift in the CNOC2 Survey displays the radial dependence of color in the redshift ranges (solid line) and (dashed line), the same ranges as used for our luminosity functions. The sample is restricted to mag. In making these radial plots we make no distinction between group and field galaxies, proceeding as follows. For each group center we search the entire volume limited sample for galaxies having . For the galaxies in this sheet we calculate , the projected separation from the group center. We display normalized to the nominal virialization radius, , where is the line of sight velocity dispersion and is the Hubble constant at the redshift of the group (Carlberg et al, 2001). Here we restrict the sample to groups with to exclude the low velocity dispersion groups that we consider below. The two redshift ranges have different average k-corrected colors at large radii, a straightforward reflection of the increasing blueness with redshift of the field population. The mean color of the inner is (low bin) and (high bin) whereas at larger radii the mean color is (low bin) and (high bin). We conclude the mean color difference between field and group is highly significant. A related effect is seen at low redshifts in the galaxy morphologies, albeit in somewhat richer groups (Tran Simard & Zabludoff, 2001).
The color gradient found in these groups is not as dramatic as the equivalent measures in rich clusters (Balogh et al., 1999; Ellingson Lin Yee & Carlberg, 2001). These groups are not as “tidy” as clusters. At the outer radius of the groups, , the mean local volume density is about . For a group with a velocity dispersion of 200 km s-1 the outer radius is about 0.3 Mpc. The redshift slice used in the color analysis would extend 600 km s-1 or about 5 Mpc in either direction. Hence the over-density of the group in that redshift slice is about 6 relative to the unperturbed background. The same is true in clusters but the total population is so much greater (typically at least 30 members, instead of 3) that the overall dilution is much less in clusters. The probability that the galaxy is outside the group but part of the extended group “halo” is about 50% (Carlberg et al, 2001). The halo is a correlated structure that may well contain a color gradient relative to the field. Hence, the projected color gradient without a background correction is expected to be relatively unaffected by field galaxy interlopers. A second issue is that the velocity dispersions of the groups, hence the calculated values have quite large statistical errors. This will lead to some radial scrambling of the summed group which will blur the true color gradient. As an aside we note that the existence of this color gradient is strong support for the physical reality and approximately correct centers (in ) of the majority of these kinematically selected groups.
A striking feature of Figure Environment and Galaxy Evolution at Intermediate Redshift in the CNOC2 Survey is that the mean galaxy colors appear to begin to become redder near , the radius of virialization. The current data are insufficient to precisely locate the radius at which the change begins. Within the group the mean colors do not vary much with redshift. In these groups star formation is, on the average, suppressed relative to the field. Figure Environment and Galaxy Evolution at Intermediate Redshift in the CNOC2 Survey also shows that the suppression process operates on a timescale short compared to the overall evolutionary timescale, since the group galaxies “quickly” (as measured by group radius) reach the same colors for the two redshift ranges examined. The radius of virialization is where one expects in-falling correlated structure, both associated galaxies and loosely distributed gas, to begin to be stripped away from individual galaxies and to spread through the group. The groups are selected to have mean interior densities that are approximately 200 times the critical density. This means that tidal fields, which scale as mean density alone, will have a similar effect at all velocity dispersions. However, ram pressure stripping, which depends on , where is the gas density, will be much less effective in low velocity dispersion systems. The fact that groups with velocity dispersions near 150 km s-1 have a color gradient that resembles that present in clusters with , at least in sign and radial range, suggests that the color change mechanism is not related to velocity dispersion, but to density. Tidal fields are then an acceptable mechanism to differentiate field and group galaxies, whereas ram pressure stripping is not.
The low velocity dispersion groups have an interesting variant on the color gradient. Color gradients of groups with maximum and in the redshift range 0.25 to 0.45 are shown in Figure Environment and Galaxy Evolution at Intermediate Redshift in the CNOC2 Survey. Near the centers of low velocity dispersion groups the mean color of the high luminosity galaxy sample becomes bluer than the field, as shown in Figure Environment and Galaxy Evolution at Intermediate Redshift in the CNOC2 Survey. Note that the color scale has twice the range of Fig. Environment and Galaxy Evolution at Intermediate Redshift in the CNOC2 Survey. The remarkable result is that the low velocity dispersion groups seem to have centers that are bluer than the surrounding field. The errors are based on the standard deviation on the points in the bins. It should be noted that the inner-most bin for the 27 low velocity dispersion groups bins contain only 3 galaxies. These measurements suggest that in very low velocity dispersion groups that galaxies can interact (and very likely merge) with an accompanying burst of star formation. The sample is so small that this result has to be viewed with caution.
5 Galaxy Orbits in Groups
Merging is predicted to occur in low velocity dispersion groups on a timescale of a few group crossing times. Theoretical studies have used n-body simulations to examine quite a large range of idealized groups (Barnes, 1985; Mamon, 1987; Barnes, 1990; Bode Cohn & Lugger, 1993; Bode Berrington Cohn & Lugger, 1994). Empirical evidence, such as we have reported here (and reviewed in a low redshift context in Hickson 1997) confirms the presence of merging in such groups. Here we quantitatively assess, using the parameters of our observed groups, the impact of merging on the overall evolution of the field population in our sample. Our groups are uniformly selected on a kinematic basis from a field galaxy survey, so we know how to relate the group merging to its overall impact on the galaxy population as a whole. We use the measured components of the positions and velocities of the observed galaxies, and then fill in the missing components by randomly sampling three dimensional distributions in position and velocity which we know from our statistical study of groups (Carlberg et al, 2001).
Rather than full n-body integrations we follow the orbits of galaxies in a static potential but include the dynamical friction. We undertake the group orbit integrations in a co-ordinate system where is the co-ordinate in the plane of the sky relative to the group center and is the (physical) co-ordinate along the line of sight. For each group galaxy we have an observed and . To complete the initial conditions we need an and the two components of velocity that are in the plane of the sky. In Carlberg et al (2001) we found that group galaxies are distributed with a volume density that is consistent with the power law and that the velocity distribution is consistent with being drawn from an isotropic Gaussian distribution. Therefore, the two unknown velocity components are set by drawing from a Gaussian velocity distribution having the measured . The three dimensional distance to the center, , must lie between and the largest value that keeps it within the virialized region of the group which we take as , as appropriate to a low density universe. The density distribution is generated from randomly sampled numbers in . We therefore find from . The line of sight position is calculated from , with a randomly assigned sign. Although the galaxy is initially within the virialized region it is possible that the combination of radius and velocity is such that orbits move outward for the entire duration of the integration.
The gravitational potential of the group is approximated as a static isothermal sphere, , consistent with the dynamical analysis (Carlberg et al, 2001). This captures the bulk of the overall dynamics of groups, but neglects the potential fluctuations of other galaxies orbiting in the group. The mass of each galaxy is taken to be an assigned , in R band, times the luminosity of the galaxy. We use values of 10, 30 and 100 where is the total mass, including dark halo, of individual galaxies. Here we present the results only for . Integrations for have reduced merger rates with a factor of about 3 drop in merger rates for . A vital ingredient in the calculation is to include dynamical friction. We use Chandrasekhar’s formula (Binney & Tremaine, 1987), adopting a Coulomb logarithm, . The galaxy orbit is then integrated for a set maximum time, usually around 1Gyr. Two example orbits over a 2 Gyr interval are shown in Figure Environment and Galaxy Evolution at Intermediate Redshift in the CNOC2 Survey.
The statistics of galaxy mergers in groups are shown in Figure Environment and Galaxy Evolution at Intermediate Redshift in the CNOC2 Survey. We show velocity dispersion binned merger fractions for integrations of 0.5, 1 and 5 Gyr. Here we only count as mergers those galaxies which simultaneously have and which are approximately the criteria for merging of any galaxy with a galaxy sitting at the potential bottom of a group. The figure shows that the only groups in which mergers will occur with any significant rate are those with . The expected merger rate declines with time since the reservoir of groups is exhausted in our simulations which have no ongoing formation of new groups. Most of the groups that will have a merger will do so in the first 0.5 Gyr or so. The rate of merging over a longer time is dependent on the creation of new groups, which is not rapid over this interval where clustering is barely increasing (Carlberg et al 2000b, ). The merger rate in groups, averaged over the entire sample, is about 2.5% per Gyr, with about 25% of all groups below 150 km s-1 having at least one luminous galaxy merger in 1 Gyr. Although there is no strong astrophysical justification for alternate values of the critical velocity for merging, raising it to increases the merger rate by about 50% and lowering it to reduces the merger rate by about a factor of four. We conclude that groups below 150 km s-1 are short lived, although their impact on the population as a whole to redshift one is a 15% or so effect. The higher velocity dispersion groups are not affected by merging at all, so their differences from the field are due to other effects.
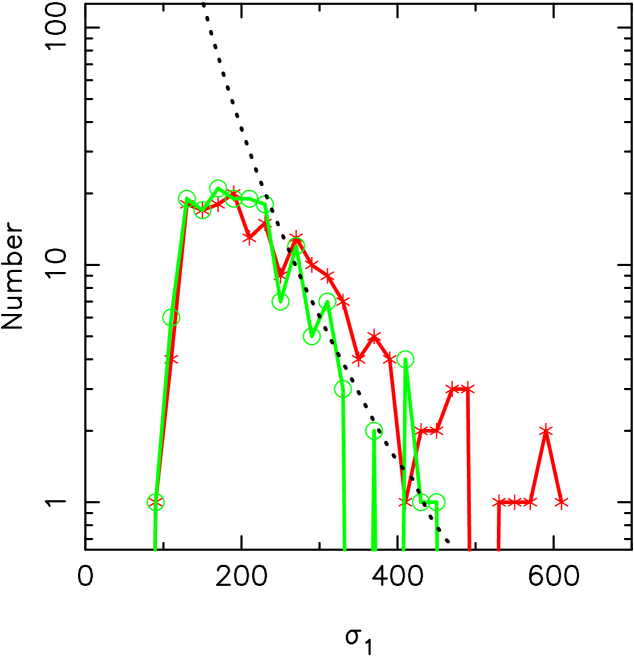
Figure Environment and Galaxy Evolution at Intermediate Redshift in the CNOC2 Survey shows the distribution of number of groups with a given line-of-sight global velocity dispersions, , for our standard groups and an alternate group sample defined using a maximum redshift linking length of 3 Mpc. The numbers of high velocity dispersion groups are in good agreement with the rich cluster normalized Press-Schechter (1974) prediction. Below 200 km s-1 the numbers of groups falls well below the prediction, mainly because they are halos that contain only one or two galaxies above our luminosity limit, rather than the three we require.
6 Discussion and Conclusions
The theme of this paper is to use the differential evolution of field and group galaxies to examine the dominant processes that drive galaxy evolution at low redshift. We find three empirical relations between clustering environment and the star formation rate, as indicated by colors. First, the correlation length - star formation rate relation of Figures Environment and Galaxy Evolution at Intermediate Redshift in the CNOC2 Survey and Environment and Galaxy Evolution at Intermediate Redshift in the CNOC2 Survey shows that galaxies of low star formation rates usually occur in very strongly clustered regions. Second, the luminosity function evolution of the field population is very similar to that of galaxies in groups having , Figure Environment and Galaxy Evolution at Intermediate Redshift in the CNOC2 Survey. Third, galaxy groups with become redder toward their centers, Figure Environment and Galaxy Evolution at Intermediate Redshift in the CNOC2 Survey. There is a statistically weak indication that groups with low velocity dispersions appear to have much bluer than average galaxies at the group center.
It is natural to ask if the changes in group galaxies and the field population as a whole are physically related. Three physical possibilities are outlined below.
-
•
Field and group galaxies may have a common internal “clock” that causes them to evolve at similar rates. For instance, the rate of cooling of gas and subsequent star formation in the part of the galactic potential well that is occupied by stars may have little environmental dependence. In this approach the population differences between group and field are set in place at some much earlier epoch. This idea doesn’t account for the color gradients in groups and is therefore unattractive.
-
•
Groups undergo continuing infall of field galaxies, so the evolution of the field is naturally mirrored in groups. In this picture field galaxies are where the bulk of “normal, quiescent” star formation occurs. The origin of the strong evolution of this star formation is not specified, but, once galaxies enter groups their star formation rates tend to decline, as they do in the rich clusters. The combination of infall and subsequent transformation then explains both the common evolution and the population difference between field and group galaxy populations. This idea can account for color gradients, but provides no insight into the mechanism driving the rapid evolution of blue galaxies in the field.
-
•
In hierarchical cosmologies all galaxies are created from smaller pre-existing galaxies. Moreover, many of the field galaxies in our sample would be found to be in groups if we counted galaxies further down the luminosity function. Hence, most galaxies can be considered to have been group galaxies at some time. In this approach the natural state of weakly clustered galaxies is to be undergoing star formation. However, as galaxies enter a more clustered environment their star formation is reduced. The reduction is controlled by processes that operate on a timescale comparable to the orbital time in the virialized unit which is initially comparable to the Hubble time so the rate of reduction is slow. This picture is a “two-stage” evolutionary picture. The first stage occurs in regions of low velocity dispersion where there is ongoing star formation, accompanied by mergers from time to time that can lead to major star bursts. As the velocity dispersion of the group grows the dynamical friction timescale ascends so that mergers are no longer important. In the second stage the dominant action of the group is to tidally remove small gas-rich companion galaxies and more generally distributed gaseous material at large radii that would normally be available to support ongoing star formation. Given that the pairwise velocity dispersion at low redshift is 300-500 km s-1 (Davis & Peebles, 1983; Marzke Geller da Costa & Huchra, 1995; Peacock et al, 2001; Zehavi et al., 2001) this means that relatively few field galaxies are in low velocity dispersion groups where merging is strong. At some yet-unidentified higher redshift the pairwise velocity is the range where low velocity dispersion groups are much more prevalent and merging is likely to be the dominant effect of those groups. Below redshift one clustering has grown sufficiently that the groups have increased their velocity dispersion sufficiently that the dominant environmental evolutionary effect of groups is suppression of star formation by tidal effects. Given that a large fraction of all galaxies are found in groups and that clustering increases to lower redshift, the group dependent star formation suppression will have an increasing affect on the field population as a whole. Mergers are relatively rare over our redshift range (Patton et al., 1997, 2000; Le Fèvre et al., 2000; Carlberg, et al. 2000a, ), hence clustering related suppression, rather than merger enhancement, may be the dominant source of low redshift galaxy evolution.
There are two observational tests that should be made of these scenarios. First, a general test is that if clustering is a property that changes slowly with time, then at some redshift greater than one there should be a population of of galaxies with , or more, that are very strongly star forming. These would be the progenitors of the reddest galaxies at low redshift. Second, beyond redshift one, begins to rise toward unity, the dark matter clustering declines, the fraction of galaxies in groups with velocity dispersion larger than 150 km s-1 starts to become small and the pairwise velocity likely declines (for modest clustering biases). This then is the time when merging in groups, possibly with much more gas rich galaxies than observed below redshift one, leads to a dramatic buildup of the stellar mass of spheroids through merging. Although there are indirect suggestions of this activity a direct test with redshifts having the kinematic precision to identify groups is required.
References
- Abadi Moore & Bower (1999) Abadi, M. G., Moore, B. & Bower, R. G. 1999, MNRAS, 308, 947
- Adelberger et al. (1998) Adelberger, K. L., Steidel, C. C., Giavalisco, M., Dickinson, M., Pettini, M., & Kellogg, M. 1998, ApJ, 505, 18
- Allington-Smith Ellis Zirbel & Oemler (1993) Allington-Smith, J. R., Ellis, R., Zirbel, E. L., & Oemler, A. J. 1993, ApJ, 404, 521
- Allam Tucker Lin & Hashimoto (1999) Allam, S. S., Tucker, D. L., Lin, H. & Hashimoto, Y. 1999, ApJ, 522, L89
- Balogh Navarro & Morris (2000) Balogh, M. L., Navarro, J. F., & Morris, S. L. 2000, ApJ, 540, 113
- Balogh et al. (1999) Balogh, M. L., Morris, S. L., Yee, H. K. C., Carlberg, R. G., & Ellingson, E. 1999, ApJ, 527, 54
- Barnes (1985) Barnes, J. 1985, MNRAS, 215, 517
- Barnes (1990) Barnes, J. E. 1990, Nature, 344, 379
- (9) Benson, A. J., Cole, S., Frenk, C. S., Baugh, C. M., & Lacey, C. G., 2000, MNRAS, 311, 793
- (10) Benson, A. J., Baugh, C. M., Cole, S., Frenk, C. S., & Lacey, C. G., 2000, MNRAS, 316, 107
- Binney & Tremaine (1987) Binney, J. & Tremaine, S. 1987, Galactic Dynamics, (Princeton University Press)
- Bode Cohn & Lugger (1993) Bode, P. W., Cohn, H. N., & Lugger, P. M. 1993, ApJ, 416, 17
- Bode Berrington Cohn & Lugger (1994) Bode, P. W., Berrington, R. C., Cohn, H. N. & Lugger, P. M. 1994, ApJ, 433, 479
- Broadhurst Ellis & Shanks (1988) Broadhurst, T. J., Ellis, R. S., & Shanks, T. 1988, MNRAS, 235, 827
- Burbidge & Burbidge (1960) Burbidge, E. M.& Burbidge, G. R. 1961, AJ, 66, 541
- Carlberg et al. (1996) Carlberg, R. G., Yee, H. K. C., Ellingson, E., Abraham, R., Gravel, P., Morris, S. & Pritchet, C. J. 1996, ApJ, 462, 32
- Carlberg et al. (1997) Carlberg, R. G., et al. 1997, ApJ, 485, L13
- Carlberg Morris Yee & Ellingson (1997) Carlberg, R. G., Morris, S. L., Yee, H. K. C. & Ellingson, E. 1997, ApJ, 479, L19
- (19) Carlberg, R. G., and 13 colleagues 2000, ApJ, 532, L1
- (20) Carlberg, R. G., Yee, H. K. C., Morris, S. L., Lin, H. Hall, P. B., Patton, D., Sawicki, M. & Shepherd, C. W. 2000, ApJ, 542, 57
- Carlberg et al (2001) Carlberg, R. G., Yee, H. K. C., Morris, S. L., Lin, H. Hall, P. B., Patton, D., Sawicki, M. & Shepherd, C. W. 2001, ApJ, 552, 427
- Coleman Wu & Weedman (1980) Coleman, G. D., Wu, C., & Weedman, D. W. 1980, ApJS, 43, 393
- Davis & Geller (1976) Davis, M. & Geller, M. J. 1976, ApJ, 208, 13
- Davis & Peebles (1983) Davis, M. & Peebles, P. J. E. 1983, ApJ, 267, 465
- de Mello Infante & Menanteau (1997) de Mello, D. F., Infante, L., & Menanteau, F. 1997, ApJS, 108, 99
- Diaferio Geller & Ramella (1994) Diaferio, A., Geller, M. J., & Ramella, M. 1994, AJ, 107, 868
- Dressler (1980) Dressler, A. 1980, ApJ, 236, 351
- Dubinski (1998) Dubinski, J. 1998, ApJ, 502, 141
- Dubinski & Carlberg (1991) Dubinski, J. & Carlberg, R. G. 1991, ApJ, 378, 496
- Ellingson Lin Yee & Carlberg (2001) Ellingson, E., Lin, H., Yee, H. K. C., & Carlberg, R. G. 2001, ApJ, 547, 609
- Evrard (1987) Evrard, A. E. 1987, ApJ, 316, 36
- Fioc & Rocca-Volmerange (1997) Fioc, M. & Rocca-Volmerange, B. 1997, A&A, 326, 950
- Fisher et al. (1994) Fisher, K. B., Davis, M., Strauss, M. A., Yahil, A. & Huchra, J. 1994, MNRAS, 266, 50
- Fukugita Shimasaku & Ichikawa (1995) Fukugita, M., Shimasaku, K., & Ichikawa, T. 1995, PASP, 107, 945
- Girardi & Giuricin (2000) Girardi, M. & Giuricin, G. 2000, ApJ, 540, 45
- Gott & Turner (1976) Gott, J. R. , III & Turner, E. L. 1976, ApJ, 209, 1
- Governato et al. (1998) Governato, F., Baugh, C. M., Frenk, C. S., Cole, S., Lacey, C. G., Quinn, T. & Stadel, J. 1998, Nature, 392, 359
- Guzzo et al. (1997) Guzzo, L., Strauss, M. A., Fisher, K. B., Giovanelli, R. & Haynes, M. P. 1997, ApJ, 489, 37
- Hashimoto & Oemler (2000) Hashimoto, Y. & Oemler, A. J. 2000, ApJ, 530, 652
- Heisler, Tremaine & Bahcall (1985) Heisler, J., Tremaine, S. and Bahcall, J. N. 1985, ApJ, 298, 8
- Hickson (1982) Hickson, P. 1982, ApJ, 255, 382
- Hickson (1997) Hickson, P. 1997, ARA&A, 35, 357
- Huchra & Geller (1982) Huchra, J. P. & Geller, M. J. 1982, ApJ, 257, 423
- Jing (1998) Jing, Y. P. 1998, ApJ, 503, L9
- Kauffmann Colberg Diaferio & White (1999) Kauffmann, G., Colberg, J. M., Diaferio, A. & White, S. D. M. 1999, MNRAS, 307, 529
- Le Fèvre et al. (2000) Le Fèvre, O. et al. 2000, MNRAS, 311, 565
- Lilly et al. (1995) Lilly, S. J., Tresse, L., Hammer, F., Crampton, D., & Le Fevre, O. 1995, ApJ, 455, 108
- Lilly Le Fevre Hammer & Crampton (1996) Lilly, S. J., Le Fevre, O., Hammer, F., & Crampton, D. 1996, ApJ, 460, L1
- Lin et al (1996) Lin, H., Kirshner, R. P., Shectman, S. A., Landy, S. D., Oemler, A., Tucker, D. L., & Schechter, P. L. 1996, ApJ, 471, 617
- Lin et al. (1999) Lin, H., Yee., H. K. C., Carlberg, R. G., Morris, S. L., Sawicki, M., Patton, D., Wirth, G. & Shepherd, C. W. 1999, ApJ, 518, 533
- Loveday Tresse & Maddox (1999) Loveday, J., Tresse, L. & Maddox, S. 1999, MNRAS, 310, 281
- Mahdavi & Geller (2001) Mahdavi, A. & Geller, M. J. 2001, ApJ, 554, L129
- Mamon (1987) Mamon, G. A. 1987, ApJ, 321, 622
- Marzke Geller da Costa & Huchra (1995) Marzke, R. O., Geller, M. J., da Costa, L. N., & Huchra, J. P. 1995, AJ, 110, 477
- Merritt (1984) Merritt, D. 1984, ApJ, 276, 26
- Merritt (1985) Merritt, D. 1985, ApJ, 289, 18
- Mo & White (1996) Mo, H. J. & White, S. D. M. 1996, MNRAS, 282, 347
- Moore Lake & Katz (1998) Moore, B., Lake, G., & Katz, N. 1998, ApJ, 495, 139
- Mulchaey & Zabludoff (1998) Mulchaey, J. S. & Zabludoff, A. I. 1998, ApJ, 496, 73
- Mulchaey & Zabludoff (1999) Mulchaey, J. S. & Zabludoff, A. I. 1999, ApJ, 514, 133
- Mulchaey (2000) Mulchaey, J. S. 2000, ARA&A, 38, 289
- Navarro, Frenk & White (1996) Navarro, J. F., Frenk, C. S. & White, S. D. M. 1996, ApJ, 462, 563
- Nolthenius & White (1987) Nolthenius, R. & White, S. D. M. 1987, MNRAS, 225, 505
- Norberg et al. (2001) Norberg, P. et al (the 2dF Collaboration) 2001, MNRAS, (submitted) astro-ph/0105500
- Patton et al. (2000) Patton, D. R., Carlberg, R. G., Marzke, R. O., Pritchet, C. J., da Costa, L. N., & Pellegrini, P. S. 2000, ApJ, 536, 153
- Patton et al. (1997) Patton, D. R., Pritchet, C. J., Yee, H. K. C., Ellingson, E., & Carlberg, R. G. 1997, ApJ, 475, 29
- Peacock et al (2001) Peacock, J. A. et al 2001, Nature, 410, 169
- Peebles (1980) Peebles, P. J. E. 1980, Large Scale Structure of the Universe (Princeton University Press: Princeton)
- Peebles (1993) Peebles, P. J. E. 1993, Principles of Physical Cosmology (Princeton University Press: Princeton)
- Pildis Evrard & Bregman (1996) Pildis, R. A., Evrard, A. E. & Bregman, J. N. 1996, AJ, 112, 378
- Poggianti et al (1999) Poggianti, B. M., Smail, I., Dressler, A., Couch, W. J., Barger, A. J., Butcher, H., Ellis, R. S. & Oemler, A. 1999, ApJ, 518, 576
- Press & Schechter (1974) Press, W. H. & Schechter, P. 1974, ApJ, 187, 425
- Ramella Geller & Huchra (1989) Ramella, M., Geller, M. J. & Huchra, J. P. 1989, ApJ, 344, 57
- Saunders Rowan-Robinson & Lawrence (1992) Saunders, W., Rowan-Robinson, M. & Lawrence, A. 1992, MNRAS, 258, 134
- Shepherd et al. (2001) Shepherd, C. W., Carlberg, R. G., Yee, H. K. C., Morris, S. L., Lin, Sawicki, M. H., Hall, P. B. & Patton, D. ApJ, in press (astro-ph/0106250)
- Somerville et al. (2001) Somerville, R. S., Lemson, G., Sigad, Y., Dekel, A., Kauffmann, G. & White, S. D. M. 2001, MNRAS, 320, 289
- Tran Simard & Zabludoff (2001) Tran, K.-V. H., Simard, L. & Zabludoff, A. I. 2001, ApJ, 549, 172
- Whitmore Gilmore & Jones (1993) Whitmore, B. C., Gilmore, D. M. & Jones, C. 1993, ApJ, 407, 489
- Willmer da Costa & Pellegrini (1998) Willmer, C. N. A., da Costa, L. N. & Pellegrini, P. S. 1998, AJ, 115, 869
- Yee et al. (2000) Yee, H. K. C., et al. 2000, ApJS, 129, 475
- Yun, Ho & Lo (1994) Yun, M. S., Ho, P. T. P. & Lo, K. Y. 1994, Nature, 372, 530
- Zabludoff et al (1996) Zabludoff, A. I., Zaritsky, D., Huan, L., Tucker, D., Hashimoto, Y., Schechtman, S. A., Oemler, A., & Kirshner, R. P. 1996, ApJ, 466, 104
- Zabludoff & Mulchaey (1998) Zabludoff, A. I. & Mulchaey, J. S. 1998, ApJ, 496, 39
- Zehavi et al. (2001) Zehavi, I. et al (the SDSS Collaboration) 2001, ApJ(submitted) astro-ph/0106476
The relation between rest-frame and the instantaneous star formation rate, normalized to the mass, is shown as the (green) plus signs that falls as increases. The mass-to-light ratio is shown, using the same axes, for blue (crosses) and red (circles) rest-frame luminosities. A variety of exponential models are shown for solar and solar (the reddest set of model results) abundance. Points are plotted every years.
The fitted (filled circles) as a function of the k-corrected color . The fitted slopes, , are shown in the inset. The correlation lengths normalized to are shown as the pincushion symbols. The color bins are 50% overlapped in width.
The fitted (filled circles) as a function of the k-corrected and evolution compensated absolute magnitude (R band in Environment and Galaxy Evolution at Intermediate Redshift in the CNOC2 Surveya and B in Environment and Galaxy Evolution at Intermediate Redshift in the CNOC2 Surveyb) in 1 mag bins around the central color. The fitted slopes, , are shown in the inset. The correlation lengths normalized to are shown as the pincushion symbols. The open circles are the SDSS (Environment and Galaxy Evolution at Intermediate Redshift in the CNOC2 Surveya) and 2dF (Environment and Galaxy Evolution at Intermediate Redshift in the CNOC2 Surveyb) measurements at low redshift.
The distribution of groups as a function of number. The plus marks indicate the number of spectroscopic redshifts in the identified group. The circles give the completeness corrected numbers in the group. The groups lie in the redshift range 0.15 to 0.55.
The color vs absolute magnitude for group (red asterisk) and field (blue circle) galaxies.
The observed versus colors of the group (red plus signs) and field (blue circles) galaxies. The lines are for a series of exponentially declining star formation rate models with decay rates ranging from 1 Gyr (reddest) to 6 Gyr (bluest) with star formation starting at .
The distribution of colors of field galaxies (solid line) and group galaxies (dashed line) that are more luminous than mag. The left panel is for redshifts between 0.15 and 0.36 the right is for redshifts 0.36 to 0.47. The error bars are simply for the bins.
The k-corrected luminosity functions in the (thick lines) and (thin lines) redshift ranges. The galaxies are separated into field, high and low velocity dispersion groups. These redshift ranges have nearly equal volumes. Blue galaxy, , luminosity functions are shown in the lower panels and red galaxies in the upper panels. The luminosity functions are not normalized to the volume, approximately . The errors are simply for the bin.
The mean colors of galaxies as a function of projected distance from the centers of the groups. The galaxies are selected to have velocities with respect to the group center of . The solid line is for galaxies with redshifts between 0.1 and 0.36 and the dashed for 0.36 to 0.47.
The color-radius relation galaxies around groups having and (solid, dashed and dot-dashed lines, respectively) for high luminosity galaxies with . Lower luminosity galaxies show little effect.
The Monte Carlo orbits for two of the galaxies in a random group. The box size is given in Mpc units.
The merger rate for the groups as a function of the group velocity dispersion as derived from the Monte Carlo integrations. The lines increase in width as the integration time increases from 0.5, to 1.0 to 5.0 Gyr. The left panel gives the merged fraction in each bin of velocity dispersion, whereas the right panel gives the fraction of the entire sample that merges.
The distribution of measured line-of-sight velocity dispersions in 20 km s-1 bins, plotted at the bin centers. The asterisks (red line) are for the standard 5 Mpc groups and the open circles (green line) are for the 3 Mpc groups. The dotted line shows the Press-Schechter prediction for the distribution using the cluster normalization.