1]Max-Planck-Institut für extraterrestrische Physik, Postfach 1312, 85741 Garching, Germany 2]NRC-NASA/Goddard Space Flight Center, Code 660, Greenbelt, MD 20771, U.S.A. 3]Institute of Nuclear Physics, M. V. Lomonosov Moscow State University, 119 899 Moscow, Russia
aws@mpe.mpg.de
A 3D time-dependent model for Galactic cosmic rays and -rays
Abstract
In studies of cosmic-ray (CR) propagation and diffuse continuum -ray emission from the Galaxy it has usually been assumed that the source function can be taken as smooth and time-independent. However, especially for electrons at high energies where energy losses are rapid, the effect of the stochastic nature of the sources becomes apparent and indeed has been invoked to explain the GeV excess in the diffuse emission observed by EGRET. In order to address this problem in detail a model with explicit time-dependence and a stochastic SNR population has been developed, which follows the propagation in three dimensions. The results indicate that although the inhomogeneities are large they are insufficient to easily explain the GeV excess. However the fluctuations should show up in the gamma-ray distribution at high energies and this should be observable with GLAST. Estimates of the TeV continuum emission from the plane are consistent with the Whipple upper limit.
1 Introduction
The diffuse continuum -ray emission from the Galaxy measured by EGRET and COMPTEL has been the subject of many studies relating to CR origin and propagation. Usually it has been assumed that the source function can be taken as smooth and time-independent, an approximation justified by the long residence time of CR in the Galaxy, but which ignores the stochastic nature of the sources.
One motivation for studying the high-energy electrons is the observation of the GeV excess in the EGRET spectrum of the Galactic emission, which has been proposed to originate in inverse-Compton emission from a hard electron spectrum; this hypothesis can only be reconciled with the local directly-observed steep electron spectrum if there are large spatial variations which make the spectrum in our local region unrepresentative of the large-scale average. Strong et al. (2000) presented a study of diffuse -rays based on a smooth time-independent 2D model. The new 3D model and its application to nuclei is presented in Strong & Moskalenko “New developments in the GALPROP CR propagation model”, these proceedings (hereineafter Paper I). Here we concentrate on electrons and diffuse Galactic -rays .
2 Effect of SNR on the electron spectrum
The current version of the model is described in Paper I. The main enhancement is the inclusion of stochastic SNR events as sources of cosmic rays. The SNR are characterized by the mean time between events in a 1 kpc3 unit volume, and the time during which an SNR actively produces CR. For high-energy electrons (TeV) which lose energy on timescales of years the effect is a very inhomogeneous distribution. The amplitude of the fluctuations depends on these two parameters, both of which are poorly known. is adjusted to be consistent with estimates of the SNR rate (e.g., Dragicevich et al. 1999).
We consider a model with a hard electron injection spectrum (index 1.8) as used by Strong et al. (2000) following the suggestion of Pohl and Esposito (1998) that fluctuations could allow such a spectrum to be consistent both with the GeV -ray excess and the locally observed electron spectrum.
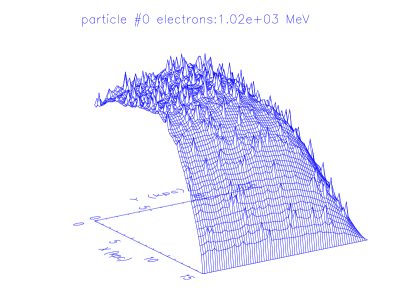
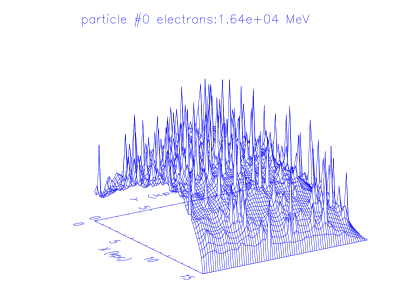
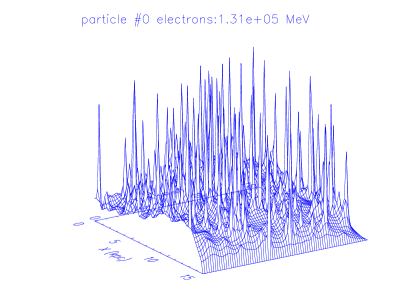
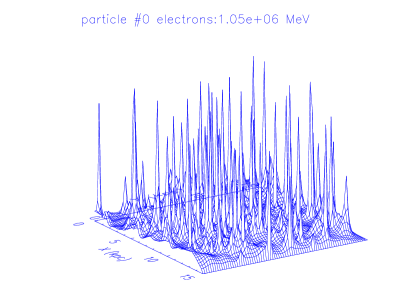
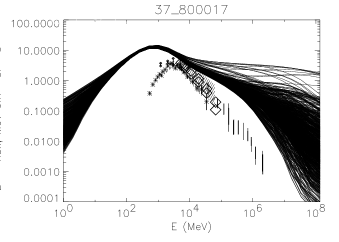
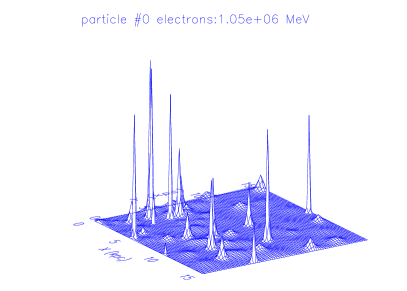
Figs. 1 and 2 show the distribution of electrons with 1, 16, 130 and 1000 GeV, for years (corresponding to a “standard” Galactic SN rate 3/century). At GeV energies the distribution shows only small fluctuations, the particle density being dominated by the long storage times. At higher energies the losses increase and the fluctuations become significant as the individual SNR events leave their imprint on the distribution. The TeV electron distribution is quite inhomogeneous, but still none of the spectra around resemble even remotely that observed locally (Fig. 2). For years (Galactic SN rate 0.3/century) the distribution above 100 GeV is even more inhomogeneous and the spectrum fluctuates even more (Fig. 3). Some of the spectra resemble that observed locally within a factor of a few, although still none is fully compatible with the local spectrum.
We conclude that the “hard electron spectrum” hypothesis for the EGRET -ray excess would require an SN rate much lower than standard, with correspondingly large power requirements for acceleration of electrons per SNR. It is possible that the rate of CR-producing SNR could be lower than that of all SNR, so that a sufficiently low rate could be possible, but this is unlikely in view of the power requirements. The CR luminosity (electrons + nuclei) in this model is erg s-1; for 3 SNR/century we require erg/SNR in CR which is plausible (for erg and 20% acceleration efficiency: see Fields et al. 2001 for discussion) but for 0.3 SNR/century we need erg/SNR in CR which would require quite another class of objects.111 We note that hypernovae may have energies of erg (Nomoto et al., 2001). It would also result in large fluctuations in the -ray emission which are not evident in the EGRET data (although this aspect should be investigated in detail).
Our conclusion differs from that of Pohl and Esposito (1998), who found that a hard electron spectrum model is consistent with observations considering the fluctuations, but they included however a dispersion in the electron injection spectral index which increases the variations further; however our tests with such a dispersion do not suggest that it eases the problem much since a large number of SNR still contribute to the local electron spectrum at 1 TeV.

2.1 Effect on the -ray sky
The inverse-Compton emission becomes increasingly clumpy at high energies due to the effect of SNR, even for the standard SNR rate, as shown in longitude distributions obtained from our model (Fig. 4). The effect is already visible at 1 GeV and will be an important signature for the GLAST -ray observatory, which will measure up to 100 GeV.
3 Galactic diffuse TeV -rays
Recently observations of the Galactic plane (around ) have been reported by the Whipple Observatory (LeBohec etal., 2000), which place limits on the GeV intensity. We have extended our predicted spectrum for a hard electron injection spectrum to the TeV range (Fig. 5). Since the maximum energy of accelerated electrons is unknown we consider the extreme case of 100 TeV.
Even for this case the predicted spectrum from inverse-Compton emission is compatible with the Whipple upper limit, and a lower cutoff energy will be also consistent with Whipple; it is clear that an improved limit would quickly provide a critical test for models with hard electron injection spectra. The SNR shock-acceleration models of Baring et al. (1999) suggest a cutoff around 1 TeV which imply a cutoff in the -rays around 10 GeV, in which case the predicted intensities are well below the Whipple limit and detection of TeV diffuse emission will be difficult.
![[Uncaptioned image]](/html/astro-ph/0106505/assets/x8.png)
![[Uncaptioned image]](/html/astro-ph/0106505/assets/x9.png)
Acknowledgements.
IVM acknowledges support from the NRC/NAS Research Associateship Program.References
- Baring et al. (1999) Baring, M. G., et al., Astrophys. J., 513, 311–338, 1999.
- Dragicevich et al. (1999) Dragicevich, P. M., Blair, D. G., and Burman, R. R., Mon. Not. Roy. Astr. Soc., 302, 693–699, 1999.
- Fields et al. (2001) Fields, B. D., et al., Astron. Astrophys., 370, 623–634, 2001.
- Kinzer et al. (1999) Kinzer, R. L., et al., Astrophys. J., 515, 215–225, 1999.
- Kobayashi et al. (1999) Kobayashi, T., et al., in Proc. 26th ICRC, 3, 61–64, 1999.
- LeBohec etal. (2000) LeBohec, S., et al., Astrophys. J., 539, 209–215, 2000.
- Nomoto et al. (2001) Nomoto, K., et al., astro-ph/0105127, 2001.
- Pohl and Esposito (1998) Pohl, M., and Esposito, J. A., Astron. Astrophys., 507, 327–338, 1998.
- Strong and Mattox (1996) Strong, A. W., and Mattox, J. R., Astron. Astrophys., 308, L21–L24, 1996.
- Strong et al. (2000) Strong, A. W., Moskalenko, I. V., and Reimer, O., Astrophys. J., 537, 763–784, 2000.
- Strong et al. (1999) Strong, A. W., et al., Astrophys. Lett. Comm., 39, 209–212, 1999.