Microwave plasma emission of a flare on AD Leo
An intense radio flare on the dMe star AD Leo, observed with the Effelsberg radio telescope and spectrally resolved in a band of 480 MHz centred at 4.85 GHz is analysed. A lower limit of the brightness temperature of the totally right handed polarized emission is estimated as K (with values K considered to be more probable), which requires a coherent radio emission process. In the interpretation we favour fundamental plasma radiation by mildly relativistic electrons trapped in a hot and dense coronal loop above electron cyclotron maser emission. This leads to densities and magnetic field strengths in the radio source of cm-3 and G. Quasi-periodic pulsations during the decay phase of the event suggest a loop radius of cm. A filamentary corona is implied in which the dense radio source is embedded in hot thin plasma with temperature K and density . Runaway acceleration by sub-Dreicer electric fields in a magnetic loop is found to supply a sufficient number of energetic electrons.
Key Words.:
Stars: activity – Stars: flare – Stars: coronae – Radio continuum: stars – Radiation mechanisms: non-thermal – Acceleration of particles1 Introduction
Several nearby flare stars occasionally show intense radio outbursts. The most prominent events were observed from AD Leonis, a very active single M dwarf star (Gliese 388, dM3.5e, cm, cm). Its radio flares have been detected mainly in the decimetric range at various observing wavelengths around 20 cm (Lang et al. Lan83 (1983); Lang & Willson LW86 (1986); White et al. WKJ86 (1986); Jackson et al. JKW89 (1989); Güdel et al. Gud89 (1989); Bastian et al. BBDD90 (1990); Abada-Simon et al. 1994a ; Aba97 (1997)). The estimates of the brightness temperature of these emissions range from K to K, which all imply a coherent emission process. The circular polarization is often high, but can vary from event to event between negligible values and %. The emission can be different or even absent at a neighbouring frequency only % apart. On several occasions, dynamic spectra have shown a wealth of fine structures in the time-frequency plane (pulsations, sudden reductions, spikes, fast-drift bursts), largely similar to solar dynamic radio spectra. All these properties — high polarization degree, narrow bandwidth, and fine structures — require a coherent emission process.
AD Leo flare observations in the microwave range, performed mainly near 6 cm, are less numerous and have produced a less coherent picture so far. Possibly the observed events belong to two or three groups. (1) There are long-lasting ( hour), relatively weakly polarized bursts of low to moderate flux density, mJy (Gary et al. GBB87 (1987); Jackson et al. JKW89 (1989); Rodonò et al. Rod90 (1990)). If a source radius equal to the stellar radius is assumed, these flux densities correspond to brightness temperatures K, consistent with incoherent emission by mildly relativistic electrons. (2) A more impulsive, completely left-handed polarized event of min duration and flux density mJy was observed by Gary et al. (GBB87 (1987)). Of similar nature may be the impulsive onset phase of the gradual burst observed by Rodonò et al. (Rod90 (1990)), which had min duration, a flux density mJy, and was seen only at 2 cm, not at 6 or 20 cm (no information on the polarization was provided). If the source diameter is estimated from the rise time using the Alfvén velocity cm s-1 (where the ratio of electron cyclotron and plasma frequencies is assumed here to be for the purpose of an estimate), one obtains K for the burst observed by Gary et al. (GBB87 (1987)) and K for the burst observed by Rodonò et al. (Rod90 (1990)). At least the former of these bursts requires a coherent emission mechanism. (3) Lecacheux et al. (Lec93 (1993)) observed one event of mJy peak flux and s duration, which was considered likely to originate from AD Leo. The burst was resolved by an acousto-optical spectrograph operating in the 4.5–5 GHz range at the Arecibo telescope. It was extremely narrow-banded, clearly discernible only between 4.78 and 4.91 GHz, and only moderately polarized ( %). The brightness temperature was estimated as K, where it is clear from the short duration that the source radius must have been much smaller than the stellar radius, ; again a coherent emission mechanism is required.
The stellar origin of these radio bursts has been confirmed, in the majority of cases, by simultaneous observing with up to three widely separated telescopes, by imaging with the VLA, by eliminating interference based on its characteristic appearances in dynamic spectra, or (in case of single dishes) by using two feeds simultaneously with one feed in an “off” position. Also the similarity of the fine structures with solar radio fine structures suggests a stellar origin.
In the 2–6 cm range, a transition from coherent emission at long wavelengths to incoherent emission at short wavelengths appears to occur in the flare emission of AD Leo, similar to the situation at other flare stars (Bastian Bas90 (1990)) and the Sun, perhaps shifted to somewhat shorter wavelengths at flare stars. It is understood as being due to three effects. First, the characteristic frequencies of coherent emission ( for the cyclotron maser and for plasma emission) are limited to GHz by the available field strengths and plasma densities in stellar coronae. Second, a general increase of the ratio with decreasing height in the corona, which makes cyclotron emission processes more important and plasma emission less important or quenches the latter completely. Third, increasing free-free absorption of plasma emission and of low-harmonic cyclotron maser emission at increasing plasma density (implied by higher observing frequency ), see, e.g., Dulk (Dul85 (1985)), Benz (Ben84 (1984)). However, also similar to the solar case, coherent emissions observed in this range, albeit being rare and possibly becoming progressively weak at decreasing wavelength, are likely to originate closest to, or from within, the primary flare energy release volume (e.g., Benz et al. BMM01 (2001)).
We have therefore begun a search for bursts from AD Leo in the 6 cm range using the Effelsberg radio telescope and a bandwidth of MHz centred near 4.85 GHz, which provides a sensitivity limit of mJy in dynamic spectra. A well developed, intense burst was detected, which warrants a detailed study, presented in this paper. The burst had a peak flux of mJy, duration of min, a broadband spectrum that varied slightly during the event, and was % right-handed circularly polarized. The estimated brightness temperature, K, implies a coherent emission process. The temporal modulations of the decay phase resemble quasi-periodic pulsations.
Simultaneous soft X-ray observations using ROSAT were not successful, since the burst occurred during source occultation by the Earth.
Our analysis of the event focuses on the nonthermal radio emission mechanism. There are two mechanisms that can lead to the required high brightness temperature: electron cyclotron maser (ECM) emission and plasma emission (e.g., Dulk Dul85 (1985); Kuijpers Kui89 (1989)). Since gyroresonance absorption of ECM emission by ambient thermal electrons presents a severe problem for temperatures and densities supposed to be typical of M dwarf coronae, we consider plasma emission in detail. The high polarization degree requires that the plasma emission arises at the fundamental. We assume that a population of mildly relativistic electrons is trapped in a coronal loop, develops a loss-cone distribution, and excites electrostatic upper-hybrid modes (analogous to the canonical source model of broadband solar plasma emission). Calculations of the brightness temperature of fundamental and harmonic plasma radiation for typical M dwarf coronal parameters confirm the possibility of fundamental emission. This mechanism implies smaller magnetic field strengths and higher plasma densities than ECM emission. Electron acceleration by a sub-Dreicer DC electric field at the chromospheric footpoints of a coronal loop is briefly considered and found to be consistent with the requirements on the number and energy of accelerated electrons in the observed radio flare. Finally, a consideration of the pulsations supports the assumption that the radio source was formed by particle trapping in a loop.
The observations are presented in Sect. 2, the ECM and plasma emission processes are discussed and source parameters are estimated in Sect. 3, the calculation of the brightness temperature for fundamental and harmonic plasma emission is given in Sect. 4, and the particle acceleration is considered in Sect. 5. The origin of the pulsations is discussed in Sect. 6, and the results are summarized in Sect. 7.
2 Radio observations of the AD Leo flare at Effelsberg
The radio observations of AD Leo at Effelsberg lasted a total of about 27 hours on the days May 17-19, 1997. During the first two days the meteorological conditions were not favourable so that possible bursts could not be identified with certainty, but a well developed burst with a duration of min was recorded on May 19, 1997, 18.945 UT.
The observations were performed with the new 8192-channel autocorrelation system (AK) and in parallel with the pulsar receiving equipment. The centre frequency of the measurements was 4.85 GHz. The total effective bandwidth was 500 MHz for the pulsar mode and 480 MHz for the spectroscopic mode. Both observing systems recorded the two total power signals (LHC and RHC) of the four channel receiving system.
2.1 The pulsar mode
Left and right handed circular polarized radio power was detected from the two feeds of the receiver, one being centred on the source and the other one in an “off” position. The same centre frequency of 4.85 GHz was employed and the detectors operated at an effective bandwidth of 500 MHz. Using fast (10 MHz) V/f converters, the four frequency encoded intensity channels provided the input to the Effelsberg Pulsar Observing System (EPOS). The V/f frequencies of the four channels, typically about 4 MHz, were continuously measured in 1.0 ms intervals. Hence a resolution of in detected power and 1.0 ms in time were the limits of the pulsar data aquisition as it was operated. For a system temperature of 30 K and a telescope efficiency of 46 %, about 6 counts per sample correspond to the achievable sensitivity of 32 mJy. After each collection of 1024 data samples, these, together with a s timestamp, synchronized to the station clock, were recorded on disk.
Figure 1 shows the time profile of the event. Here the data were binned down to a time resolution of 1 s to obtain a better signal to noise ratio. The contribution of the ground radiation has been removed by a parabolic fit to the data. The r.m.s. noise after binning is about 2 mJy. Some low level structures, especially before 18.94 UT, are visible in all four channels and are very likely caused by weather effects. Only the feed centred on the source observed the strong burst of radio emission, which was also highly polarized. While the typical flux density of the radio burst is mJy in the right handed polarization, the signal in the left handed polarization channel is below the 3 sigma level of 6 mJy. The polarization degree of the detected signal is, therefore, larger than 97 %.

2.2 The spectroscopic mode
The new AK was used to record the left handed and right handed polarization with a large bandwidth. Four frequency bands were recorded, each 160 MHz wide. The centre frequencies of the individual bands were -180 MHz, -60 MHz, +60 MHz, and +180 MHz with respect to 4850 MHz. Each band consisted of 128 channels that were 1.25 MHz wide. The integration time was set to 128 ms. The reduction of the data was done by calculating (where is the signal and is the background flux), and the calibration used a flux density of 7.5 Jy for 3C286. Where the sub-bands overlapped, the 16 overlapping data points (20 MHz) were skipped because different baseline characteristics at the end of the bands prohibited their individual comparison. Differences of the flux density between the edges of adjacent bands were corrected by applying linear baselines in such a way that the corrected value became equal to the mean of the adjacent edges. The four bands were then merged to the effective bandwidth of 480 MHz. In most cases the systematic uncertainty resulting from this procedure is below 30 mJy, but values of up to 100 mJy were occasionally noted. It is assumed that there is no other flare emission outside the flare event visible in Fig. 1. A linear baseline along the time axis was subtracted to remove the background emission (i.e., the flux level before and after the considered event was set to zero). Finally, a method of unsharp masking invented by Sofue & Reich (SR79 (1979)) was used to remove “scanning effects” along the time axis. The r.m.s. in quiet regions of the spectral data was found to be mJy.
The resulting dynamic spectrum is shown in Fig. 2 for the right handed polarization. Due to internal problems of the new AK, we lost the signal during certain periods. These time intervals have been cleared in Fig. 2. No signals were detected in left handed polarization. The right handed data show a clear signal between 18.945 and 18.965 universal time. Between 18.952 and 18.955 UT the largest differences between adjacent bands were detected (mean mJy, peak 100 mJy) at frequencies near 4630 MHz. The data in this time interval have, therefore, the lowest accuracy. The other time slices show systematic errors of only mJy in addition to the statistical error of mJy.
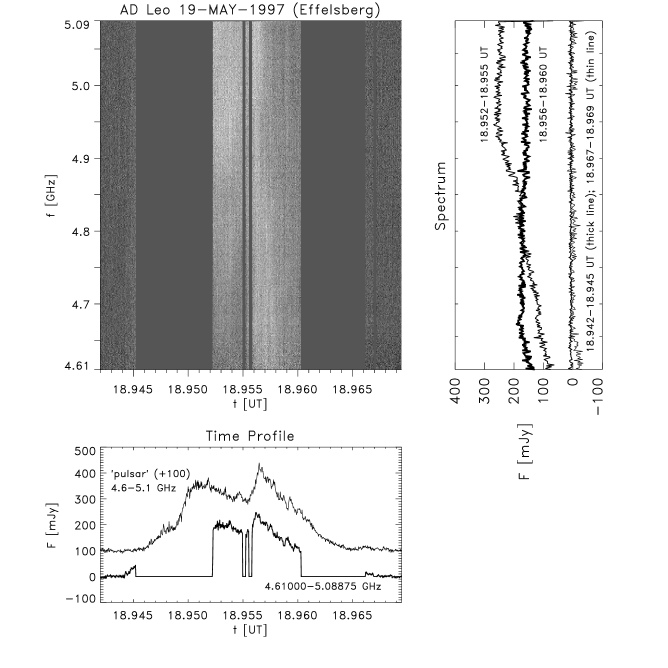
2.3 Spectral and temporal details
The bottom panel of Fig. 2 displays the flux obtained in spectral mode integrated over the whole bandwidth. The comparison with the time profile obtained from the pulsar data set, binned down to the same time resolution of 125 ms, shows excellent agreement after 18.956 UT, but also some deviations in the time interval 18.952–18.955 UT. These deviations reflect the systematic errors discussed above. The upper right panel shows the average spectra in each of the four time intervals indicated. Some spectral evolution during the lifetime of the burst is evident.
The burst showed an irregular pulsating structure during its decay phase (18.956–18.961 UT), visible in the dynamic spectrum (Fig. 2 top left) as well as in the broad-band time profiles (Fig. 2 bottom). This structure is shown in greater detail in Fig. 3. In this figure, we have subtracted the underlying flux level, obtained by taking the average over the whole band of the spectral data set at 18.956 UT and 18.9602 UT and linearly interpolating in between. An irregular sequence of about 6 pulses is clearly discernible in the subtracted time profile shown in the bottom panel. The subtracted spectrum (Fig. 3, top) reveals also an irregular spectral structure. The first three pulses do not extend over the whole observed band and definitely show the flux maximum at different frequencies. The final two pulses seem to extend over the whole band, i.e., their bandwidth exceeds 10 %.
The power spectrum of the pulse sequence (Fourier transform of the autocorrelation function of the background-substracted time profile of Fig. 3) is shown in Fig. 4. It reveals a pulsation period of s (0.5 Hz), which is clearly different from the telescope oscillation period of s. Furthermore, since the pulses possess spectral structure, they cannot be of purely instrumental origin.

3 Emission mechanism and source parameters
3.1 Characteristics of M dwarf coronae
First we recall a few basic findings about the physical conditions in the atmospheres and coronae of M dwarf stars. Such stars possess outer convections zones and show universal X-ray emission (Schmitt Schm97 (1997)). Model fitting of low resolution X-ray spectra (Schmitt et al. Schm90 (1990); Schmitt Schm97 (1997)) as well as studies of selected stars at significantly higher spectral resolution (Hawley et al. Haw95 (1995)) has shown that the coronae of these stars contain plasma at a variety of temperatures with the emission measure usually rising to beyond K. Unfortunately, direct measurements of density in the coronae of M dwarf stars have not been made yet; Fossi & Landini (FL94 (1994)) quote an upper limit of cm-3 for AU Mic. Katsova et al. (KBL87 (1987)) estimated the average density at the base of the corona from the X-ray emission measure of AD Leo, assuming a hydrostatic stratification and a temperature of K, as cm-3, a value probably smaller than the true value of density. From kinetic pressure balance, one expects the hot component to possess a significantly smaller average density ( cm-3) and because of the high temperature the corresponding scale height is of order of a stellar radius. The photospheric magnetic field strength of AD Leo is G with a high filling factor of order 75 % (Saar & Linsky SL85 (1985)). The magnetic scale height is unknown; it is often assumed to be smaller than the density scale height, but such estimates are very model-dependent (see Saar & Linsky SL85 (1985)). Similar to the Sun, the plasma-beta of the corona must be very small, even for G we find for the density and temperature given above. Hence, already a weak twist in the magnetic field is able to support large perpendicular pressure gradients, for example, loops with K and much higher densities of cm-3 embedded in an average corona. A filamentary corona, where magnetically confined dense loops, generally cooler than the average due to enhanced radiative or conductive losses, are embedded in a dilute hot corona of lower field strength is consistent with the observation (White et al. WLK94 (1994)) that the hot component in dMe stars is permeated by relatively weak magnetic fields, G.
3.2 Estimate of the brightness temperature
The brightness temperature of fully polarized radio emission is related to the flux density by
| (1) |
where is Boltzmann’s constant, is the distance to the object, and is the projected source area. Taking , one obtains K at peak flux. This is a very conservative lower limit on the brightness temperature, because the emission is expected to arise from magnetically dominated structures, e.g., a loop or a group of loops, which do not cover the whole stellar surface.
By estimating the source extent from the timescale of the flux rise and a characteristic velocity, one can attempt to obtain a tighter limit on the brightness temperature. Let us first consider the velocity of the radiating mildly relativistic electrons, , which is appropriate if the expansion of a cloud of fast electrons in a more or less stable configuration, e.g. a magnetic trap, is seen as rise of the radio flux. The flare shows two main phases of flux rise. If extrapolated backwards to zero flux level, both phases last s. Using for keV particles, we obtain a source extent at peak flux of cm — about two stellar radii. As reviewed in Sect. 3.1, one cannot expect that the high densities implied by the plasma emission mechanism or the high field strengths implied by the ECM emission mechanism exist on such spatial scales; rather, loops of much smaller height are to be expected. Typically, loop heights are smaller than the pressure scale height (Rosner et al. RTV78 (1978)), which is of order for K. Therefore, the rise of the radio flux cannot be explained as a source expansion with the velocity .
Alfvénic (or sub-Alfvénic) source expansion can be expected in case of progression of the energy release process to neighbouring loops. Using (in accordance with the interpretation of the burst as plasma emission), we obtain source sizes of cm and brightness temperatures of K.
Alternatively, the rise of the flux is due to an increasing number of fast particles in the trap. For this case we suppose a loop length based on the expectation that dense loops in general are cooler and possess a smaller pressure scale height than the average corona. The timescale of the flux pulsations, evident in Figs. 3 and 4, provides an estimate of the loop radius. If the pulsations are caused by radial MHD-oscillations of a coronal loop (as suggested in Sect. 6), their period is given by (e.g., Aschwanden Asch87 (1987)), which yields the loop radius as cm. The resulting brightness temperatures range from K (for , taking into account that the trapped particles develop a loss cone only in a section of the loop) to K (for a source viewed along the loop axis, ).
It should be noted that even higher result in the latter case if the source is filamentary at scales (i.e., if “loops” are composed of fine “threads”), as recent EUV observations of the solar corona suggest (Reale & Peres RP00 (2000)). Higher brightness temperatures would also be obtained for Alfvénic source expansion if the expansion is only one-dimensional (e.g., along an arcade of loops as in large solar flares) or under the assumption of ECM emission, which requires . Although there remains a substantial uncertainty in the value of the brightness temperature, all estimates imply that the radiation is coherent.
Two coherent mechanisms are generally considered relevant in the context of stellar (and solar) radio emission: electron cyclotron maser (ECM) emission and plasma emission. Both mechanisms are intrinsically narrow-banded and require an inhomogeneous source to explain broadband spectra. The inhomogeneity arises naturally in a magnetic trap, usually supposed to be a magnetic loop, where energetic particles develop a loss-cone distribution function (e.g., Dulk Dul85 (1985)). As discussed in detail by Bastian et al. (BBDD90 (1990)), both mechanisms do have the potential to explain a high brightness temperature, a high degree of circular polarization, and strong time variability. However, the absorption problem presents a severe difficulty for both mechanisms, particularly for the ECM mechanism.
3.3 Electron cyclotron maser emission
For various models of a loss-cone distribution function of the energetic particles and a wide range of background plasma temperatures [ K] it was found that one can expect growth of the electromagnetic modes due to the ECM instability only at the first cyclotron harmonic, slightly above (Sharma & Vlahos SV84 (1984); Melrose et al. MHD84 (1984)). The extraordinary () mode grows fastest in the range and the ordinary () mode grows fastest in the range . Maximum growth occurs at large propagation angles, , for both modes. Second and higher harmonics dominate the ECM instability for , but these waves cannot grow in reality since the electrostatic and whistler mode instabilities attain even higher growth rates in this range and exhaust the free energy contained in the fast particle distribution (Sharma & Vlahos SV84 (1984); Winglee et al. WDP88 (1988)). (It should be noted that a somewhat different result – dominant growth of the mode at the second harmonic for – was obtained for cold background plasma [Winglee Win85 (1985)]). Furthermore, the ECM instability of mildly relativistic ( keV) electrons at the second and higher harmonics is too weak to survive collisional damping for background temperatures K (supposing a density ratio of accelerated electrons [] to background electrons [] of ; see Fig. 3 in Sharma & Vlahos SV84 (1984)).
The modes that grow at the first harmonic are strongly damped by thermal electrons as their ray path crosses the second, third, and fourth cyclotron harmonic layers for decreasing magnetic field strength outside of the source. This gyroresonance absorption increases with increasing background plasma temperature and prevents propagation of the primary growing ECM emission through the low harmonic layers in hot coronae. Detailed calculations (Stepanov et al. Ste95 (1995, 1999)) for realistic coronal temperatures [ K] and densities ( cm-3) have shown that there is no escape window for the mode at the second harmonic (), only a very narrow escape window () for the mode at and the mode at , and only a moderately narrow escape window () for the mode at ; also the fourth harmonic contributes significantly to the damping. This is illustrated in Fig. 5 for parameters relevant to the burst under consideration (where we have assumed that the magnetic field gradient scale, cm, lies between the plausible values of the loop radius and the loop length discussed in Sect. 3.2). The optical depth scales roughly as . A narrow escape window of the mode at and nearly perpendicular propagation is often discussed, but does not exist for our parameters and probably also not for conditions of AD Leo in general (note that in the figure we have taken the minimum temperature of the hot coronal component and a rather small value of ).

ECM emission can reach the escape window at near-parallel propagation only through a substantial amount of angle scattering. Such scattering, which tends to isotropize the primary radiation pattern, is possible (Stepanov et al. Ste99 (1999)), but its efficiency is difficult to estimate. Considering the narrow angular interval of the ECM instability and the narrow escape window, a reduction of the brightness temperature by about one order of magnitude results from geometrical considerations alone. Non-perfect efficiency of angle scattering is expected to lead to a further significant reduction of the brightness temperature.
Assuming that nearly all of the energy contained in the fast particles can be transferred to the maser emission, maximum intrinsic brightness temperatures of ECM radiation at GHz of K are obtained (Melrose & Dulk MD84 (1984)). The saturation levels of the ECM instability obtained from quasilinear theory (Aschwanden Asch90 (1990)) or from the condition of phase locking between the particles and waves (Wentzel & Aschwanden WA91 (1991)) are strongly dependent on the density and energy of the energetic particles but reach values of K or higher for typical parameters. With these values, only a moderate efficiency of angle scattering () is required for ECM emission at the estimated brightness temperature of K (for ). Hence, one cannot exclude first-harmonic () -mode ECM emission, but the difficulties with the gyroresonance absorption do not suggest it to be the prime candidate as was often assumed in the literature.
3.4 Plasma emission
Due to the strong gyroresonance absorption of ECM, we consider only the plasma emission mechanism in the following, showing that it can, in fact, explain the observations in spite of the high observing frequency. For a trapped energetic particle distribution, plasma emission is based on the electrostatic upper-hybrid instability. This instability was investigated over a broad parameter range and for several slightly different loss-cone distribution functions of the fast particles by Zheleznyakov & Zlotnik (ZZl75 (1975)), Winglee & Dulk (WD86 (1986)), Stepanov et al. (Ste99 (1999)), and many others (see the references therein). Only the range is relevant, since in the opposite case, the growth rate of the electrostatic loss-cone instability drops significantly and the gyroresonance absorption comes into play. The electrostatic waves are always excited close to the upper-hybrid frequency based on the density of the background plasma, , at wavenumbers scaling with the cyclotron radius of the energetic particles, , and at near-perpendicular propagation angles, . Nonlinear scattering processes lead to radiation at the fundamental, , and at the harmonic, (see Sect. 4). We have for all relevant values of the parameter .
If thermal effects are taken into account, the electrostatic waves and the fundamental emission occur at , where is the wavenumber and is the electron thermal velocity. This frequency lies below the mode cutoff frequency for (e.g., Bastian et al. BBDD90 (1990)), which naturally leads to complete mode polarization. Also harmonic plasma emission (which is much less affected by gyroresonance and free-free absorption than fundamental plasma emission) can lead to strongly polarized radio waves from hot coronae in the range , but polarization degrees of % over a considerable bandwidth, as observed in the present event, would be difficult to explain (Stepanov et al. Ste99 (1999)). Therefore, fundamental plasma emission has to be considered.

Fundamental plasma emission at high frequencies suffers from free-free absorption due to the implied high plasma densities. The free-free optical thickness for fundamental plasma emission of frequency (neglecting for the moment the influence of the magnetic field) is (Dulk Dul85 (1985))
| (2) |
where the density in the source is given by and is the scale length of the density decrease along the ray path. For GHz ( cm-3), the scale length leading to becomes cm. It is immediately seen that the radiation could not escape if the radio source were surrounded by plasma at K; the ray path must run primarily through the hot coronal component. It is also clear that even the hot component of M dwarf coronae ( K) would not permit escape of the radiation if the implied high densities would slowly decrease along the ray path according to a hydrostatic atmosphere: cm. However, as noted above, such densities, being two orders of magnitude above the average, can exist in the corona of AD Leo only in thin filaments. If the external density is cm-3, we obtain , permitting escape of the radiation. Since the average density of the hot coronal component is lower than this value and since refraction into regions of low density tends to “guide” the radiation through the hot component, we expect that fundamental plasma emission at GHz can escape.
Whether free-free absorption is important also within the source remains open. For GHz, K, and cm, we have . Under such conditions, the radiation can come from a surface layer of the source only. However, for somewhat higher temperatures, K, which may exist even under quiescent conditions (Schmitt et al. Schm90 (1990)) or may be exceeded due to the flare heating. The calculations in the subsequent section suggest that the free-free absorption within the source looses importance at sufficiently high plasma wave energy densities (and brightness temperatures), where the emission is stimulated.
Fundamental plasma emission can be influenced also by gyroresonance absorption. For , the radiation has to cross the harmonic layer and possibly even the layer . However, the effect is expected to be much weaker than for ECM emission in most cases, since fundamental plasma emission arises in the mode, which is less damped than the mode, and in two symmetric cones parallel and antiparallel to the magnetic field (Fig. 6), i.e., in the direction of the escape windows. Depending on the actual value of and on changes of the magnetic field direction outside of the inhomogeneous source, the emission may escape without significant attenuation in some, perhaps many, cases and be completely absorbed in others.
Finally, we remark that, also due to the high coronal temperature, the conversion efficiency of plasma waves into electromagnetic radiation in a stellar environment exceeds the corresponding solar efficiency by one to two orders of magnitude (Abada-Simon et al. 1994a ; 1994b ; Stepanov et al. Ste99 (1999)).
3.5 Estimate of source parameters
From the condition GHz, and using again for the purpose of an estimate, we obtain the plasma density cm-3 and the magnetic field G. With K, the plasma-beta becomes and the mean free path is cm. With K, we have and cm. For both temperatures, the plasma is confined by the magnetic field and , hence the source can in fact be inhomogeneous, as is required for broadband plasma emission. The range of densities and field strengths corresponding to the lower and upper limits of the observed band is cm-3 and G.
In comparison, if the burst were interpreted as ECM emission, we would have GHz, equivalent to G, and the condition would lead to cm-3 and .
Minimum field strengths in the flare volumes of dMe stars have been derived from the observed X-ray luminosities and the estimated source volumes by van den Oord (vdO99 (1999)). Values G appear to be typical. Both ECM and plasma emission are consistent with these estimates.
4 Brightness temperature of plasma radiation
In this section we consider the relative role of fundamental (subscript f) and harmonic (subscript h) plasma radiation from a flaring loop on AD Leo. The plasma waves are excited near the upper hybrid frequency, which is expected to be rather close to the plasma frequency since . They are transformed into electromagnetic radiation at the fundamental () by the scattering on ions of the background plasma (Rayleigh scattering). The conservation law for this scattering has the form
| (3) |
where , and , are the frequency and wave vector of electromagnetic and plasma waves, respectively, and is the particle (ion) velocity.
The second harmonic plasma radiation arises from a nonlinear coupling of two plasma waves (Raman scattering), which obeys the resonance conditions
| (4) | |||||
| (5) |
The magnetic field is important in determining the frequency spectrum of the radiation which results from the conversion of plasma waves into electromagnetic waves, but it does not affect the total power of the radiation (Akhiezer et al. Akh75 (1975)). Moreover, for the loss-cone instability, the spectrum of plasma waves can be considered as isotropic (Zaitsev & Stepanov ZS83 (1983); Stepanov et al. Ste99 (1999)). Hence, to estimate the brightness temperature, we can use the formulas for the weak magnetic field case given by Zheleznyakov (Zhe96 (1996)) (see also Zaitsev & Stepanov ZS83 (1983)).
The solution of the transfer equation for the brightness temperature of radiation can be represented in the form
| (6) |
with the emissivities for the fundamental and the second harmonic
| (7) | |||||
| (8) |
and the absorption coefficients due to the electron-ion collisions
| (9) |
due to the scattering of the waves on background plasma ions
| (10) |
and due to the decay of an electromagnetic wave into two plasma waves
| (11) |
Here
| (12) |
is the electron-ion collision frequency, and are the group velocities of the electromagnetic waves at the fundamental and at the second harmonic, respectively, is the thermal velocity of the background electron component, is the velocity of the energetic electrons, is the mass ratio, and is the normalized energy density of the electrostatic waves, where . The formal parameter is related to the width of the electrostatic wave spectrum by
| (13) |
We shall use and (which takes damping of the electrostatic waves at the thermal background into account and implies ).
For dominance of fundamental emission, we require stimulated emission (maser effect), i.e., a negative absorption coefficient. This happens for , which is valid if the plasma wave spectrum is sufficiently flat or has a positive slope. This condition is easily satisfied for plasma wave turbulence spectra formed by nonlinear processes (Kaplan & Tsytovich KT73 (1973)).
The exponent in Eq. (6) is evaluated as , assuming a flat plasma wave spectrum. Since the density in the source is inhomogeneous with a scale length , the integral is carried out only in a thin layer of depth
| (14) |
in which the frequency of the electromagnetic waves is approximately constant. Since , we have . Furthermore, the relation is used (see Zaitsev & Stepanov [ZS83 (1983)] for details). The resulting brightness temperatures for fundamental and harmonic radiation are
| (15) | |||||
| (16) |
where we have introduced the abbreviations
| (17) | |||||
| (18) | |||||
| (19) | |||||
| (20) | |||||
| (21) | |||||
| (22) |
The brightness temperatures are plotted in Fig. 7 for plasma parameters supposed to be representative of a flaring loop on AD Leo ( K, K, cm), i.e., we suppose that the dense loop is heated up by the flare to about the temperature of the hot coronal component. The thermal level of plasma wave fluctuations for these parameters is (where is the Debye radius). An exponential increase of the brightness temperature of fundamental radiation (stimulated emission) occurs for . The two curves intersect at , and K. Fundamental emission dominates above this level of plasma turbulence. Our estimates in Sect. 3.2 suggested a brightness temperature K, which is roughly in accordance with the calculated minimum fundamental brightness temperature, given the uncertainty of the estimate and the approximate nature of Eqs. (15) and (16).
Fundamental radiation reaches brightness temperatures exceeding the estimated lower limit of K also in the range , in which a brighter continuum around 10 GHz due to harmonic plasma radiation would have remained unobserved. Such a situation cannot be excluded but does not appear very probable, since it is not supported by solar radio observations.
The brightness temperature of fundamental radiation increases rapidly with increasing , reaching K within a short interval of values. Strong turbulence effects will then limit the brightness temperature to K, at which level the energy density in the electromagnetic waves becomes comparable to the thermal (background) plasma energy density. Viewed reversely, in the regime of dominating fundamental emission, the plasma wave energy density stays within a rather small range.

We have to ask whether the plasma wave energy density at saturation of the electrostatic upper-hybrid instability of the trapped particles can reach the level . A summary of the diverging answers to this question, found in the literature, was given by Stepanov et al. (Ste99 (1999)). We mention here only the estimates quoted by Dulk (Dul85 (1985)), , which are consistent with our interpretation of the burst as fundamental plasma emission, and the estimate by Zaitsev et al. (Zai97 (1997)), who considered the case of saturation by moderate quasilinear diffusion (with almost isotropic energetic electrons):
| (23) |
Here is the mirror ratio of the trap and is the loop length. Taking the same parameters as in Fig. 7 with and cm, the latter estimate yields . Dominance of fundamental plasma emission then requires a density ratio , which is quite high but still reasonable (it can be reduced somewhat if is larger). We conclude that the 4.85 GHz emission in the considered radio flare can be due to fundamental plasma radiation.
A comparison with the case of decimetric emission is of interest. Repeating the calculation for a density that corresponds to a plasma frequency GHz with the same values of , , and gives the crossing point of the fundamental and harmonic brightness temperatures at and K. Hence, harmonic plasma emission tends to dominate at longer wavelengths (Stepanov et al. Ste99 (1999)).

An overview of the parameter dependence of the brightness temperature and plasma wave energy density at the intersection is given in Fig. 8. It is seen that this brightness temperature increases with increasing background temperature and decreasing density gradient scale. Brightness temperatures K are achieved in a large range of parameter space.
5 Electron acceleration
In order to provide long-lasting radio radiation from a coronal loop, emitted by nonthermal electrons, a permanent source of energetic electrons is required, because the particles are lost from the magnetic trap due to diffusion into the loss cone. Under steady-state conditions, the acceleration rate equals the loss rate into the loss cone. The particle loss rate due to pitch-angle diffusion of electrons by scattering on waves, which are excited by the loss-cone instability, is of the order for two-sided precipitation in a nearly symmetrical loop, where is the average number density of precipitating electrons and is the loop cross-sectional area at the footpoints. The fraction of precipitating electrons was estimated by Stepanov & Tsap (ST99 (1999)) as . Hence,
| (24) |
Combining Eqs. (23) and (24), we find
| (25) |
The level of plasma turbulence, , can be estimated from the calculations of Sect. 4. Figure 7 shows that stays rather close to in the range where fundamental plasma emission dominates.
We assume plasma parameters in the coronal loop as follows: cm-3, K, K (43 keV), cm, cm2, . From Fig. 7 we then have , and Eq. (25) yields the acceleration rate required for the observed continuum brightness temperature as electrons s-1, which is nearly of the same order as the electron acceleration rate during large solar flares (e.g., Miller et al. Mil97 (1997)).
One possible origin for the particle acceleration in coronal magnetic loops on red dwarf stars is the production of run-away electrons in sub-Dreicer quasi-stationary electric fields, which can be a very efficient acceleration mechanism. Most authors who considered electron acceleration in DC electric fields have used the electric field of the currents in a plasma with the Spitzer resistivity or with anomalous resistivity (e.g., Holman Hol85 (1985); Tsuneta Tsu85 (1985)). Zaitsev et al. (ZUS00 (2000)) considered another situation, namely the electron acceleration by electric fields that result from charge separation, which is caused (for strongly different electron and ion magnetization) by flows of partly ionized plasma at the loop footpoints. They obtained the electric field component parallel to the magnetic field as
| (26) |
where is the relative density of neutrals, is the “effective” frequency of ion-neutral collisions, is the small radial component of the magnetic field in a flux tube arising due to the expansion of the flux tube from the photosphere to the chromosphere, and is the radial component of the flow velocity. For sub-Dreicer fields, , the electron acceleration rate is
| (27) |
(Knoepfel & Spong KS79 (1979)). Here the index “a” denotes quantities in the acceleration region, which has a volume .
To estimate the resulting acceleration rate, we take the parameters of the acceleration region in the stellar chromosphere as follows: K, cm-3, , and cm s-1 (similar to fast solar convection). With we obtain V cm. An acceleration length km is then sufficient for the acceleration of keV electrons. To obtain an acceleration rate of s-1, the cross section of the chromospheric acceleration volume has to be cm2, which is consistent with the chosen value of and the coronal loop radius estimated in Sect. 3.2. The density of energetic electrons required for the observed radio fux was estimated in Sect. 4 as cm-3. This can be supplied by the chromospheric accelerator to a coronal loop with a volume of cm3 in s. We conclude that this process is able to explain the acceleration underlying the observed intense radio burst.
6 Origin of pulsations
There are indications of flux pulsations with an average period of s during the decay phase of the event under consideration (Figs. 3, 4). Usually four modulation mechanisms for stellar and solar radio emission are discussed in the literature: (1) modulation due to MHD oscillations of a flux tube containing the source, (2) intensity oscillations of the underlying electrostatic waves during the nonlinear stage of the wave-wave or wave-particle interactions, (3) modulation of the particle acceleration rate, and (4) modulation due to electric current oscillations in an equivalent LRC-circuit (Aschwanden Asch87 (1987); Zaitsev et al. Zai98 (1998)).
In order to obtain estimates of the radio source dimension, we considered the first mechanism of pulsations in Sect. 3.2, supposing radial oscillations of a loop which have a period , and obtained a quite reasonable value for the loop radius, cm.
As for mechanism (2), the maximum value of the pulsation period can be estimated as s (Zaitsev Zai71 (1971); Aschwanden Asch87 (1987)), which is too small in comparison to the observed period.
The period of eigen-mode oscillations in a current-carrying coronal loop modeled as an equivalent LRC-circuit is . The total inductance of a slender loop can be estimated as (Alfvén & Carlquist AC67 (1967)). The capacitance depends on the current flowing through the cross section of a loop, because just this current determines the self-consistent magnetic field and the effective dielectric permittivity of a loop plasma: (Zaitsev et al. Zai98 (1998)). Supposing again cm2, we obtain . Taking s, we find the value of the electric current, A, and thus the magnetic field in the loop as kG. This magnetic field value exceeds the photospheric field strength, which is highly improbable for the 4.85 GHz source.
Hence, only a modulation of the radio source by MHD oscillations or a modulated particle acceleration appear to be consistent with the observed period of the radio pulsations. It should be noted that MHD oscillations of a loop can lead also to a quasi-periodical regime of electron acceleration or electron injection into the loop. Alternative models exist, for example the quasi-periodic modulation of particle acceleration by dynamic magnetic reconnection (Kliem et al. KKB00 (2000)). However, the fact that the pulsations are more clearly developed during the decay phase of the flare suggests MHD oscillations of a loop, which can be triggered by the primary flare energy release.
7 Conclusions
1. Coherent plasma radiation can explain the intense broad-band AD Leo radio flare on 19 May 1997 at microwave frequencies (4.6–5.1 GHz), whose brightness temperature is estimated to be at least of order K (with values K considered to be more probable). Electron cyclotron maser emission appears less probable than plasma emission, primarily due to the strong gyroresonance absorption in the hot stellar corona, but cannot be excluded.
2. In case of the plasma emission mechanism, the circular polarization degreee of % requires emission at the fundamental plasma frequency. Harmonic plasma radiation is less strongly polarized.
3. The parameters of the radio source, assumed to be a magnetic loop, were estimated for plasma emission as cm-3 and G. Supposing K, the plasma-beta is of order .
4. A strongly inhomogeneous corona is required to avoid complete free-free absorption of the plasma emission. The ratio of source and external densities must be at least of order .
5. Acceleration of electrons by DC electric fields at the footpoints of a loop, driven by photospheric convection, can give a rate of electron acceleration, s-1, sufficient to explain the observed flare in terms of plasma emission.
6. A possible interpretation of the quasi-periodic modulation of the broadband radio emission during the decay phase of the flare is given by radial MHD oscillations of a flaring loop, which yields the loop radius as cm.
Acknowledgements.
We acknowledge the help by the operators of the Effelsberg 100 m radiotelescope and thank Dr. J. Neidhöfer for his assistance in setting up the observations. We thank the referee for constructive comments. A.V. S. acknowledges an invitation to the Astrophysical Institute Potsdam. A.V. S. and V.V. Z. were supported by RFBR grants No. 99-02-16045 and 00-02-16356, and by the program “Astronomy”; B.K. was supported by BMBF/DLR grant No. 01 OC 9706 4, and J.H. was supported by DFG grant No. STA351/6-1.Appendix A Angular pattern of fundamental plasma emission
The angular pattern of fundamental plasma emission resulting from Rayleigh scattering of perpendicularly propagating plasma waves near the electron plasma frequency was obtained in Stepanov (Ste70 (1970)) as
| (28) |
with
The elements of the cold-plasma dispersion tensor, , and the refractive index, , are as given in Stepanov et al. (Ste99 (1999)). Note that the assignment of the and modes to the sign of terms in the expression for was erroneously exchanged in that paper.
References
- (1) Abada-Simon M., Lecacheux A., Louarn P., et al., 1994a, A&A 288, 219
- (2) Abada-Simon M., Lecacheux A., Louarn P., et al., 1994b, ASP Conf. Ser. 64, 339
- (3) Abada-Simon M., Lecacheux A., Aubier M., Bookbinder J.A., 1997, A&A 321, 841
- (4) Akhiezer A.I., Akhiezer I.A., Polovin R.V., Sitenko A.G., Stepanov K.N., 1975, Plasma Electrodynamics, Pergamon, New York
- (5) Alfvén H., Carlquist P., 1967, Sol. Phys. 1, 220
- (6) Aschwanden M., 1987, Sol. Phys. 111, 113
- (7) Aschwanden M.J., 1990, A&A 237, 512
- (8) Bastian T.S., 1990, Sol. Phys. 130, 265
- (9) Bastian T.S., Bookbinder J.A., Dulk G.A., Davis M., 1990, ApJ 353, 265
- (10) Benz A.O., 1984, Sol. Phys. 94, 161
- (11) Benz A.O., Messmer P., Monstein C., 2001, A&A 366, 326
- (12) Dulk G.A., 1985, ARA&A 23, 169
- (13) Monsignori Fossi B.C., Landini M., 1994, A&A 284, 900
- (14) Gary D.E., Byrne P.B., Butler C.J., 1987, In: Cool Stars, Stellar Systems, and the Sun. Fifth Cambridge Workshop, Linsky J.L., Stencel R.E. (eds.), Springer, Berlin, p. 106
- (15) Güdel M., Benz A.O., Bastian T.S., et al., 1989, A&A 220, L5
- (16) Hawley S.L., Fisher G.H., Simon T., et al., 1995, ApJ 453, 464
- (17) Holman G.D., 1985, ApJ 293, 584
- (18) Jackson P.D., Kundu M.R., White S.M., 1989, A&A 210, 284
- (19) Kaplan S.A., Tsytovich V.N., 1973, Plasma Astrophysics, Pergamon Press, Oxford
- (20) Katsova M.M., Badalyan O.G., Livshits M.A., 1987, AZh 64, 1243
- (21) Kliem B., Karlický M., Benz A.O., 2000, A&A 360, 715
- (22) Knoepfel H., Spong D.A., 1979, Nuclear Fusion 19, 785
- (23) Kuijpers J., 1989, Sol. Phys. 121, 163
- (24) Lang K.R., Bookbinder J., Golub L., Davis M.M., 1983, ApJ 272, L15
- (25) Lang K.R., Willson R.F., 1986, ApJ 305, 363
- (26) Lecacheux A., Rosolen C., Davis M., et al., 1993, A&A 275, 670
- (27) Melrose D.B., Dulk G.A., 1984, ApJ 282, 308
- (28) Melrose D.B., Hewitt R.G., Dulk G.A., 1984, J. Geophys. Res. 89, 897
- (29) Miller J.A., Cargill P.J., Emslie A.G., et al., 1997, J. Geophys. Res. 102, 14 631
- (30) Reale F., Peres G., 2000, ApJ 528, L45
- (31) Rodonò M., Houdebine E.R., Catalano S., et al., 1990, In: Solar and Stellar Flares. Proc. IAU Colloq. 104 Poster Papers, Haisch B.M., Rodonò M. (eds.), Catania Astrophys. Obs., Catania, p. 50
- (32) Rosner R., Tucker W.H., Vaiana G.S., 1978, ApJ 220, 643
- (33) Saar S.H., Linsky J.L., 1985, ApJ 299, L47
- (34) Schmitt J.H.M.M., 1997, A&A 318, 215
- (35) Schmitt J.H.M.M., Collura A., Sciortino S., et al., 1990, ApJ 365, 704
- (36) Sharma R.R., Vlahos L., 1984, ApJ 280, 405
- (37) Sofue Y., Reich W., 1979, A&AS 38, 251
- (38) Stepanov A.V., 1970, Radiofizika 13, 1342 [Radiophys. Quantum Electronics 13, 1034 (1973)]
- (39) Stepanov A.V., Tsap Yu.T., 1999, Astron. Reports 43, 838
- (40) Stepanov A.V., Fürst E., Krüger A., et al., 1995, A&A 299, 739
- (41) Stepanov A.V., Kliem B., Krüger A., Hildebrandt J., Garaimov V.I., 1999, ApJ 524, 961
- (42) Tsuneta S., 1985, ApJ 290, 353
- (43) van den Oord G.H.J., 1999, ASP Conf. Ser. 158, 189
- (44) Wentzel D.G., Aschwanden M.J., 1991, ApJ 372, 688
- (45) White S.M., Kundu M.R., Jackson P.D., 1986, ApJ 311, 814
- (46) White S.M., Lim J., Kundu M.R., 1994, ApJ 422, 293
- (47) Winglee R.M., 1985, J. Geophys. Res. 90, 9663
- (48) Winglee R.M., Dulk G.A., 1986, ApJ 307, 808
- (49) Winglee R.M., Dulk G.A., Pritchett P.L., 1988, ApJ 328, 809
- (50) Zaitsev V.V., 1971, Sol. Phys. 20, 95
- (51) Zaitsev V.V., Stepanov A.V., 1983, Sol. Phys. 88, 297
- (52) Zaitsev V.V., Krüger A., Hildebrandt J., Kliem B., 1997, A&A 328, 390
- (53) Zaitsev V.V., Stepanov A.V., Urpo S., Pohjolainen S., 1998, A&A 337, 887
- (54) Zaitsev V.V., Urpo S., Stepanov A.V., 2000, A&A 357, 1105
- (55) Zheleznyakov V.V., 1996, Radiation in Astrophysical Plasmas, Kluwer, Dordrecht
- (56) Zheleznyakov V.V., Zlotnik E.Ya., 1975, Sol. Phys. 43, 431