HST observations of NGC 6240
Abstract
WFPC2 images and STIS spectroscopic observations are presented of the double nucleus in the merger system NGC 6240. We find that: (a) the kinematics of the ionized gas is similar to that of the molecular gas, despite a different morphology; (b) the gaseous and stellar kinematics are quite different, suggesting an early merger stage; (c) neither the gaseous nor the stellar kinematics show an obvious sign of the supermassive black hole believed to be responsible for the X-ray emission of NGC 6240; and (d) the steep off-nuclear velocity gradient is not due to a black hole, in contrast to earlier suggestions.
Space Telescope Science Institute, Baltimore, USA
University of Hertfordshire, Hatfield, UK
Case Western Reserve University, Cleveland, OH, USA
Harvard University, Cambridge, MA, USA
Institute for Astronomy, Honolulu, HI, USA
1. Introduction
The luminous IR galaxy NGC 6240 has both the tidal tails and a double nucleus that are characteristic of a merging system. Since its identification by the IRAS satellite as one the most nearby ULIRGs, NGC 6240 has been the subject of numerous studies at virtually all wavelengths.
One of the key results emerging from these studies is that NGC 6240 harbors both a starburst and an AGN. Several lines of evidence indicate the presence of young stars, including e.g. the observed strength of the CO bandhead (Rieke et al. 1985). However, observations with various X-ray satellites show a strong X-ray component that can only originate from an AGN (e.g., Vignati et al. 1999). Spectroscopic line diagnostics in the mid-IR support the view of a composite AGN/starburst source, but indicate that most of the IR luminosity of must be powered by the starburst (Genzel et al. 1998).
To improve our understanding of the double nucleus we have studied this region at high resolution using the Hubble Space Telescope (HST; GO Programs 6430 and 8261; PI: van der Marel). We have obtained WFPC imaging and longslit STIS spectra to determine both the gaseous and the stellar kinematics. An additional set of emission line spectra was obtained some 12 arcsec from the double nucleus to examine the nature of a large velocity gradient that exists at this location (Bland-Hawthorn, Wilson & Tully 1991).
2. Double Nucleus
2.1. Imaging
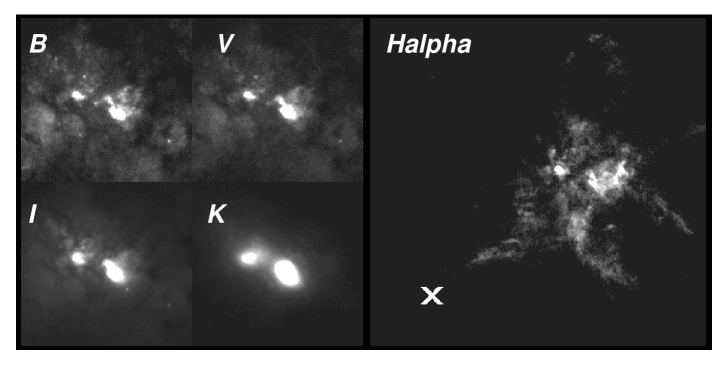
The two nuclei of NGC 6240 are separated by 1.8 arcsec or about 0.8 kpc. Figure 1a shows close-ups of our WFPC2 observations in the , and bands (filters F450W, F547M and F814W, respectively), together with a K-band NICMOS image retrieved from the HST Data Archive (filter F222M, GO program 7219, PI: Scoville). There is a clear change in the morphology of the double nucleus as the wavelength increases, due to strong dust absorption, especially on the southern nucleus. This is consistent with the previous finding from lower-resolution ground-based data that the distance between the flux-centroids of the two nuclei appears to decrease with wavelength (Schulz et al. 1993).
Figure 1b shows our narrow band WFPC2 +[NII] image. The double nucleus is visible also in ionized gas. The large-scale morphology of the gas has a highly filamentary structure that is characteristic of a starburst wind (Heckman, Armus & Miley 1987).
2.2. Gas Kinematics
To map the velocity field of the ionized gas in the nuclear region we obtained a set of STIS +[NII] emission line spectra with the slit parallel to the line that connects the nuclei. We used slit widths of and to cover an area with a full width of . The spectra were analysed by fitting Gaussians to the emission lines. The best-fitting Gaussian parameters yield the flux, radial velocity and velocity dispersion. The results are shown as contour maps as a function of position in Figure 2a–c.
The flux distribution corresponds well with that in the +[NII] narrow band image. Although the northern nucleus is less luminous than the southern nucleus in continuum emission, it is more centrally concentrated and has a higher peak intensity in the emission lines.
The velocity field does not show clear signs of rotation around either of the two nuclei. However, it does show a steep velocity gradient of 400 km s-1 arcsec-1 between the two nuclei, as shown in Figure 2d. The velocity field of molecular CO gas obtained by Tacconi et al. (1999) yields a similar picture, with the same velocity gradient that we observe in +[NII] (same peak to peak velocity amplitude and turn-over radius). While Tacconi et al. observe that the CO velocity field is highly complex, they are able, with some simplifying assumptions, to fit it with a model of a rotating disk between the two nuclei. This is not unreasonable, given that the observed CO flux peaks between the two nuclei. However, the ionized gas emission that we observe clearly does not peak between the two nuclei, cf. Figure 2a. It is therefore surprising that the ionized gas and the molecular gas do have very similar kinematics.
Current N-body simulations do not yet have sufficient resolution to follow the gaseous and stellar kinematics inside the central kpc of mergers in much detail. However, they do indicate that the dynamics can be complex and out of equilibrium, so the interpretation of the gas velocities in NGC 6240 as due to organized disk rotation should be viewed with some caution. Note that gas disks are often observed around the nuclei of ULIRGs, but not generally in between the nuclei.

The velocity dispersion map of the ionized gas shows peaks that roughly coincide with the two nuclei. However, the difference between the maximum and minimum velocity dispersions is small, less than 25 percent. To first order, the velocity dispersion of the ionized gas is consistent with 250 km s-1 over the entire nuclear region. One of the goals of the gas kinematical observations was to find evidence for broad emission lines that could identify the AGN responsible for the X-ray emission. However, we see no sign of broad emission lines or strongly increasing line widths towards either of the nuclei.
2.3. Stellar Kinematics
We also obtained STIS spectra at the near-IR Ca triplet to study the stellar kinematics in the region of the double nucleus. Due to the lower S/N of absorption lines it was not possible to make a two-dimensional map of the kinematics, so instead only a single spectrum was obtained with the slit along the line connecting the nuclei. The inferred mean velocities and velocity dispersions of the stars are shown in Figures 2e,f.
The stellar kinematics differ considerably from the gas kinematics. The large velocity gradient seen in the ionized gas is absent in the stellar kinematics and there appears to be very little rotation around the nuclei. However, a ground based stellar velocity field derived from the CO bandhead (Tezca et al. 2000) does show rotation around both nuclei but at large angles to the position angle of the line that connects the nuclei.
The stellar velocity dispersion (derived after binning rows along the spectrum to increase signal-to-noise) peaks at the nuclei. At both nuclei the measured velocity dispersion is around 200 km s-1, well below earlier, spatially unresolved, observations of 350 km s-1 (Lester & Gaffney 1994; Doyon et al. 1994), but consistent with the more recent observations by Tezca et al. The signal-to-noise ratio between the two nuclei is too low, even after rebinning, to reliably determine the stellar velocity dispersion. Tezca et al. find that in their data the velocity dispersion actually peaks between the nuclei. However, the dynamical importance of this observation is unclear because N-body simulations show that projection effects can lead to spurious peaks in the observed velocity dispersions (Mihos 2000).
Stars are collisionless objects, unlike gas which can be influenced by shocks, infall and starburst winds. In general stars therefore trace the gravitational potential of a galaxy more reliably than gas. One of the goals of the stellar kinematical observations was to find evidence for an increasing velocity dispersion towards either of the nuclei, which would have provided evidence for the gravitational influence of the black hole that is responsible for the X-ray emission. However, we do not observe the large velocity dispersions that would unambiguously identify a black hole.

3. The Hypothesized Off-Nuclear Black Hole
Bland-Hawthorn et al. (1991) reported the presence of a steep velocity gradient in a ground-based velocity field of NGC 6240 at a projected distance of 6 kpc from the double nucleus (marked by a cross in Figure 1b). This was interpreted with a model in which the velocity gradient is due to rotation around a black hole of . This would be quite remarkable, given that the most massive black hole ever convincingly detected is only (e.g., Kormendy & Gebhardt 2001). Also, no counterpart is seen at the position of the hypothesized black hole in optical continuum, ionized gas, radio emission or X-ray wavelengths.
We have mapped the velocity field around the hypothesized black hole using STIS spectra obtained with the wide slit placed at several parallel positions (Figure 3b). While the resulting spatial resolution is admittedly low for HST standards, it is still a few times better than for the best available ground-based data. Although a steep gradient is observed in the HST data, the gradient is not steeper than the measured ground based value. This is not consistent with expectation if there were indeed a black hole present. Then the gradient should be steeper when observed at higher spatial resolution. If the velocity gradient observed with HST were interpreted with a model of gas orbiting a black hole, the implied black holes mass would only be . However, such a model is inconsistent with the observed two-dimensional structure of the velocity field. The predicted velocity field at the observational resolution for an inclined Keplerian disk is shown in Figure 3a. The velocity gradient quickly flattens perpendicular to the kinematical major axis, by contrast to the observed gradient. Hence, the observed velocity field is inconsistent with the signature expected from a black hole. The location of the observed velocity gradient along the extension of a filament (see Figure 1b) suggests instead that it is due to kinematic gradients in the starburst wind, or possibly projection effects.
References
Bland-Hawthorn, J., Wilson, A. S., & Tully, R. B. 1991, ApJ, 371, L19
Doyon, R., et al. 1994, ApJ, 437, L23
Genzel, R., et al. 1998, ApJ, 498, 579
Heckman, T. M., Armus, L., & Miley, G. K. 1987, AJ, 93, 276
Kormendy, J., & Gebhardt, K. 2001, in ‘Proc. 20th Texas Symposium’, AIP, in press [astro-ph/0105230]
Lester, D. F., & Gaffney, N. I., 1994, ApJ, 431, L13
Mihos C., in ‘Dynamics of Galaxies: from the Early Universe to the Present’, Combes F. et al., eds., ASP Conference Series, Vol. 197, 275, 2000
Rieke, G. H., et al. 1985, ApJ, 290, 116
Schulz, H., Fried, J.W., Röser, S., & Keel, W. C., 1993, A&A, 277, 416
Tacconi, L. J., et al. 1999, ApJ, 524, 732
Tecza, M., et al. 2000, ApJ, 537, 178
Vignati, P., et al. 1999, A&A, 349, L57