Rejection of the C Diffuse Interstellar Band Hypothesis
Abstract
Using the new high resolution ( 8 km/s) echelle spectrograph on the 3.5-m telescope at the Apache Point Observatory, we have begun a high sensitivity survey of the diffuse interstellar bands in a large sample of reddened stars. Now that we are two years into this long-term survey, our sample includes over 20 reddened stars which show at least one of the DIBs that had been suggested to be caused by C, based on the gas phase measurement of the C spectrum by J. P. Maier’s group.
The high quality astronomical data from this larger sample of stars, along with the spectroscopic constants from the new laboratory work recently reported by Maier’s group, have enabled us to examine more carefully the agreement between C and the DIBs. We find that none of the C bands matches the DIBs in wavelength or expected profile. One of the DIBs (5748) attributed to C is actually a stellar line. The two strongest DIBs attributed to C (6270 and 4964) do not vary together in strength, indicating that they do not share the same carrier.
On the whole, we find no evidence supporting the hypothesis that C is a carrier of the diffuse interstellar bands.
1 Introduction
Perhaps the longest unsolved problem in astrophysical spectroscopy is that of the Diffuse Interstellar Bands (DIBs), a series of hundreds of absorption lines present in the visible spectra of nearly all reddened stars. It is now generally believed that the diffuse interstellar bands are caused by free molecules in the gas phase (Herbig, 1995), but despite many decades of effort by astronomers and molecular spectroscopists, there has been no match between any subset of the diffuse bands and the gas-phase laboratory spectrum of an individual molecule.
Many astronomers and molecular spectroscopists were hopeful that this impasse had finally been broken when J. P. Maier’s group reported (Tulej et al., 1998) a possible match between the gas-phase spectrum of C and five DIBs in the catalog of Jenniskens and Désert (1994). The promising laboratory bands are all vibronic bands of the lowest electronic transition () of C. The strongest of the reported bands, the origin () band at 6270.2 Å, seemed to match the strong 6270 DIB. The other four laboratory bands which seemed to match the DIBs were the band at 5612.8 Å (DIB at 5610), at 5747.6 Å (5748), at 6063.8 Å (6065), and the combination band at 4963 Å (4964).
All five of these laboratory transitions seemed to agree with DIBs within about 2 Å, which is far closer agreement than had been achieved by any previously proposed DIB carrier. Many of the astronomical observations of the DIBs were at the limit of the sensitivity, as were the laboratory observations. Because it was not possible to infer the rotational or spin-orbit constants of C from the laboratory work, it was unclear how the bands might shift in wavelength or profile as a function of temperature. For these reasons, agreement within 2 Å was sufficient to warrant further investigation.
Using initial data from our DIB survey (McCall, York, and Oka, 2000), we confirmed the existence of four of the five DIBs, but had reservations about the 5748 band. With data from four reddened stars, it appeared that these four DIBs agreed reasonably well in both wavelength and relative intensities, given the uncertainties in the laboratory data. Additionally, in these four sources (HD 46711, HD 50064, HD 183143, and Cygnus OB2 12) the four bands seemed to vary together in intensity.
Recently, J. P. Maier’s group has obtained laboratory data on the , , , and bands of C with considerably higher resolution and sensitivity (Lakin et al., 2000). The authors performed theoretical calculations to estimate the ground- and excited-state rotational and spin-orbit constants, and then varied the spin-orbit constants to best fit their experimental spectrum. Since the overall profile of the spectrum is very different as the spin-orbit constants are varied, this approach results in a fairly unambiguous determination of the molecular constants (though not as unambiguous as would be possible from a fully rotationally-resolved spectrum). With the constants determined from the experiment, it is now possible to predict how the C spectrum will change with temperature. Such predictions are essential in performing a detailed comparison with the DIBs.
At the same time, our DIB survey has progressed to the point where we now observe at least some of the bands attributed to C in the spectra of over twenty reddened stars. Additionally, our data reduction pipeline has improved substantially, such that the aliasing which limited the signal-to-noise in our earlier work has been completely eliminated. These advances in both the laboratory and astronomical spectroscopy have prompted us to re-examine the case for C as a diffuse band carrier.
2 Observations and Data Reduction
The observations reported here are part of our long-term survey of the DIBs in a large sample of stars. High resolution ( 37,500) visible (4000–10000 Å) spectra have been obtained with the Astrophysical Research Consortium Echelle Spectrograph (ARCES) on the 3.5-m telescope at the Apache Point Observatory. Data reduction is performed using standard IRAF routines, as described in detail by Thorburn (2000). A more complete description of our DIB survey will be given in a future paper.
3 Results and Discussion
3.1 Simulation of C spectra
Given the constants from Lakin et al. (2000) (=897 MHz, =887 MHz, =27.4 cm-1, and =0.6 cm-1), we used the method of Hill and Van Vleck (1928) to calculate the energy levels of C and the intensity factors for the individual rotational lines within a given vibronic band. [We assumed the same constants for each vibronic band, as the vibrational dependence of the constants is expected to be smaller than the uncertainty in the determined constants.] The populations of the rotational states of C were then calculated using a Boltzmann expression at a given temperature, from which we were able to simulate the absorption spectrum. Temperatures between 10 K and 90 K were considered, as diffuse clouds can be expected to have temperatures within this range. For the linewidth of each transition, we assumed a Gaussian profile with full-width at half-maximum 10 km/s, which is the FWHM of the observed K i lines in HD 185418 and HD 229059 (two stars we have chosen for the comparsion due to their narrow K i lines).
3.2 Comparsion between DIBs and simulated C spectra
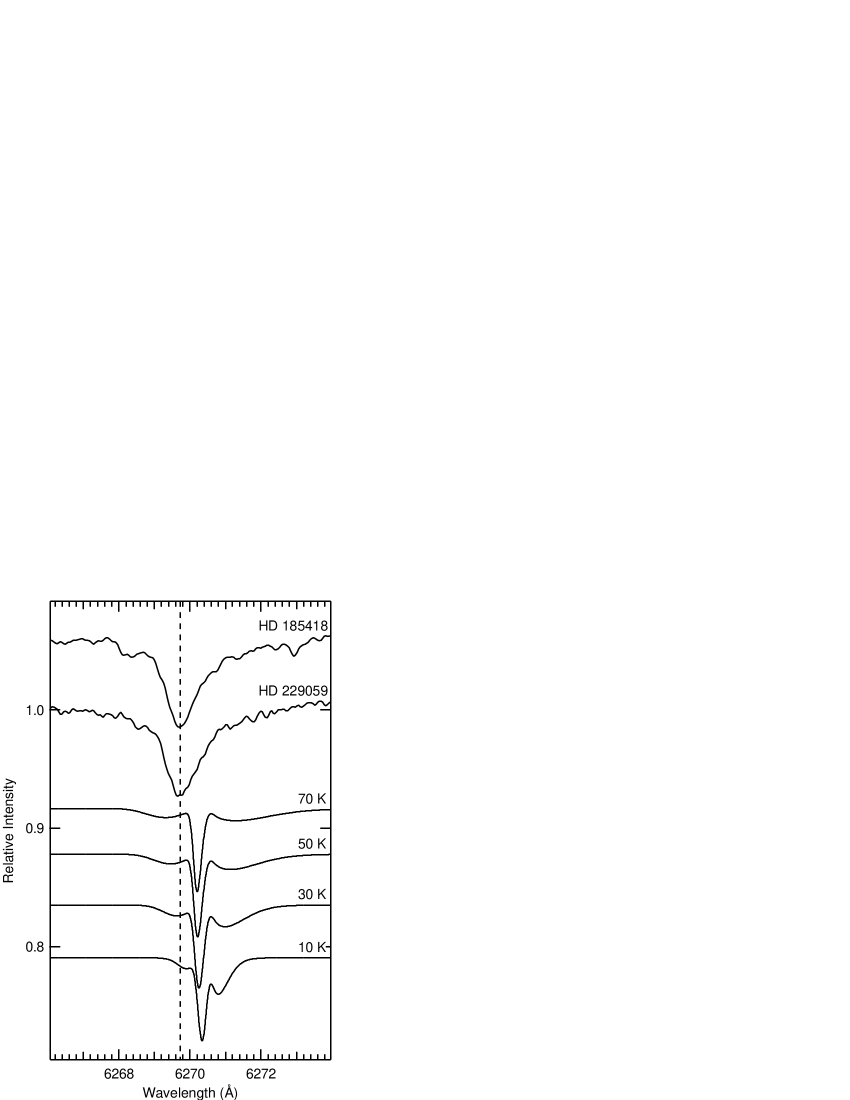
We begin by considering the =1/2 spin-orbit component of the origin () band of C, in comparison with the 6270 DIB. The origin band is naturally the strongest of the laboratory features, and 6270 is also by far the strongest of the DIBs suggested to correspond to C. Figure 3.1 shows the spectra of 6270 toward HD 185418 and HD 229059, along with the simulations of the C origin band at temperatures of 10, 30, 50, and 70 K. As can be seen from the figure, neither the central wavelengths nor the profiles of the C spectra agree with the 6270 diffuse band. This disagreement argues strongly against the assignment of 6270 to C.
In Figure 3.2 we consider both the =1/2 (left) and =3/2 (right) components of the C origin band. Because =3/2 is higher in energy, the intensity of the right-hand component increases with temperature, as evident in the simulations at 30, 60, and 90 K. In Figure 3.2, an (unreasonably large) ad hoc Gaussian linewidth of 30 km/s has been assumed in order to improve the agreement with 6270. It is difficult to state with certainty because of the presence of the strong 6284 DIB, but it appears that there is little evidence for the =3/2 component in the astronomical spectra. However, because the intrinsic profile of the strong 6284 DIB is not known, the presence of the =3/2 component cannot be definitively ruled out.
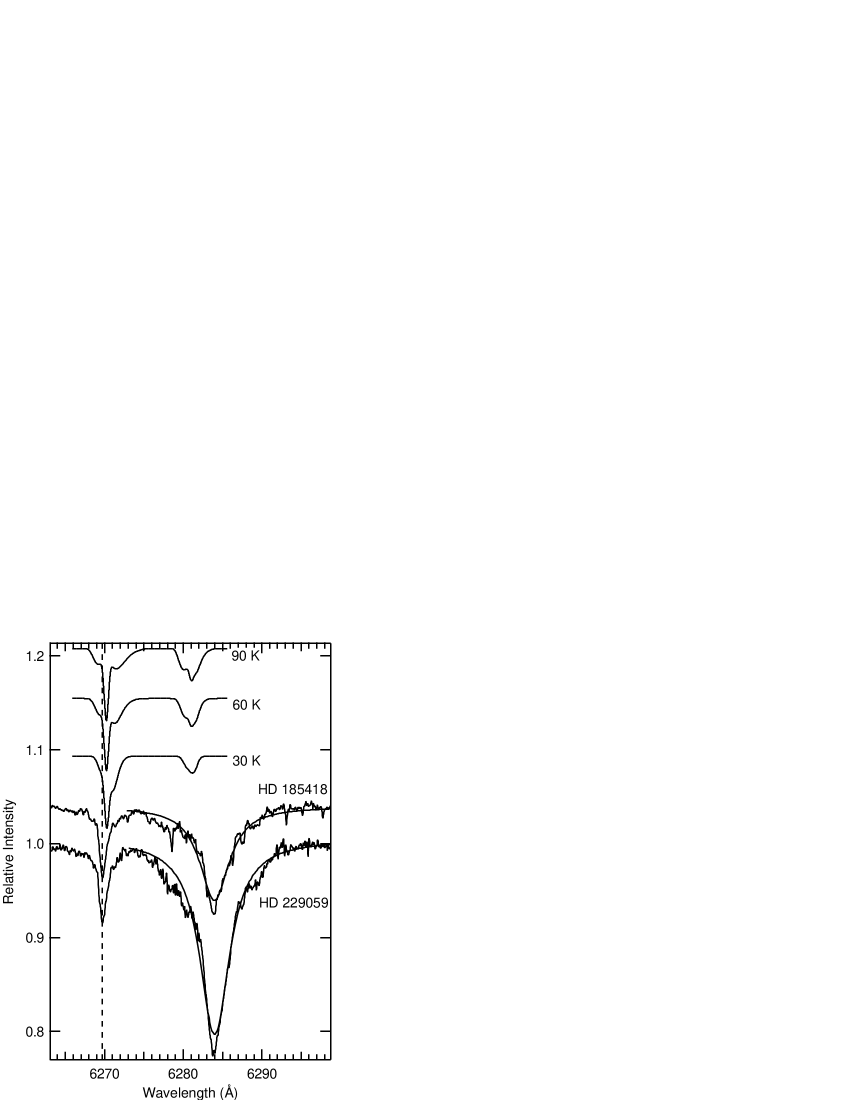
Figure 3.2 compares the simulated spectrum of the vibronic band of C to the 5610 DIB. In this case, the wavelength discrepancy between the C band and the DIB is particularly egregious, over 2 Å. In addition, the profile is considerably different — the simulated spectrum shows a sharp band-head, while the DIB has a fairly Gaussian profile. There is no reason to attribute the 5610 DIB to C, and no evidence for any astronomical feature resembling the band of C.
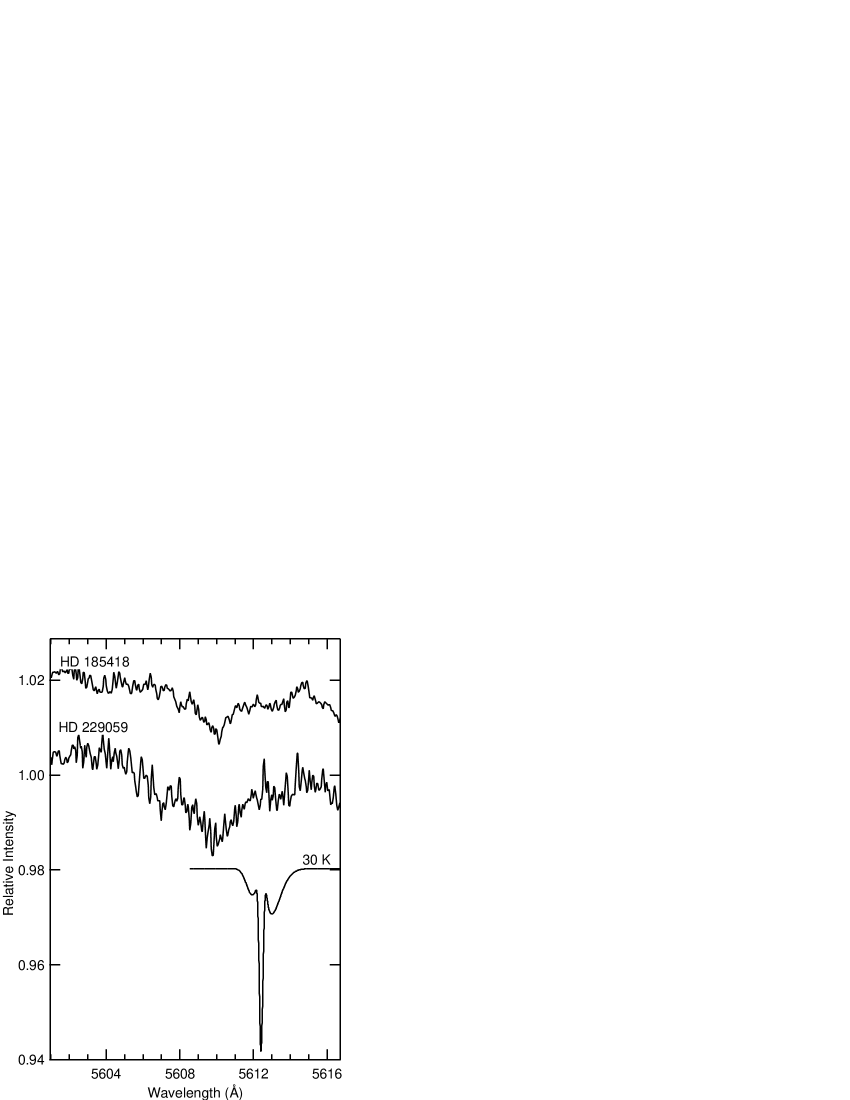
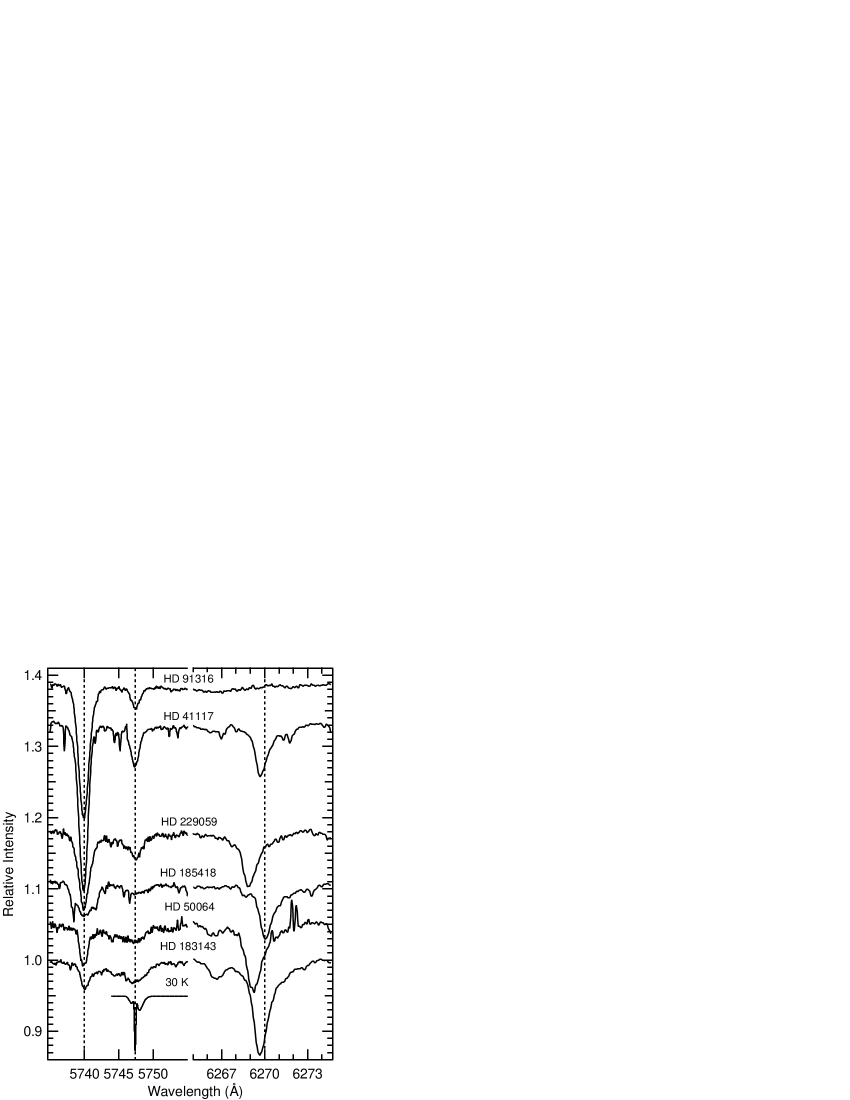
Figure 3.2 shows the region where the band of C is expected, as well as the 6270 DIB (which has been suggested to correspond to the origin band). In this figure, the spectra have been shifted in wavelength in order to co-align the Si iii stellar line at 5740 Å. It is easily seen from the figure that with this wavelength shift, the feature at 5747 Å is also aligned, whereas the diffuse interstellar band 6270 is no longer aligned. This implies that the feature which Jenniskens and Désert (1994) claim as a “certain” DIB at 5748 Å is, in fact, a stellar line. This is particularly clear from the strength of the feature in the unreddened star HD 91316 ( Leo) which shows no trace of the 6270 DIB. Since “5748” is not of interstellar origin, it cannot be assigned to C.
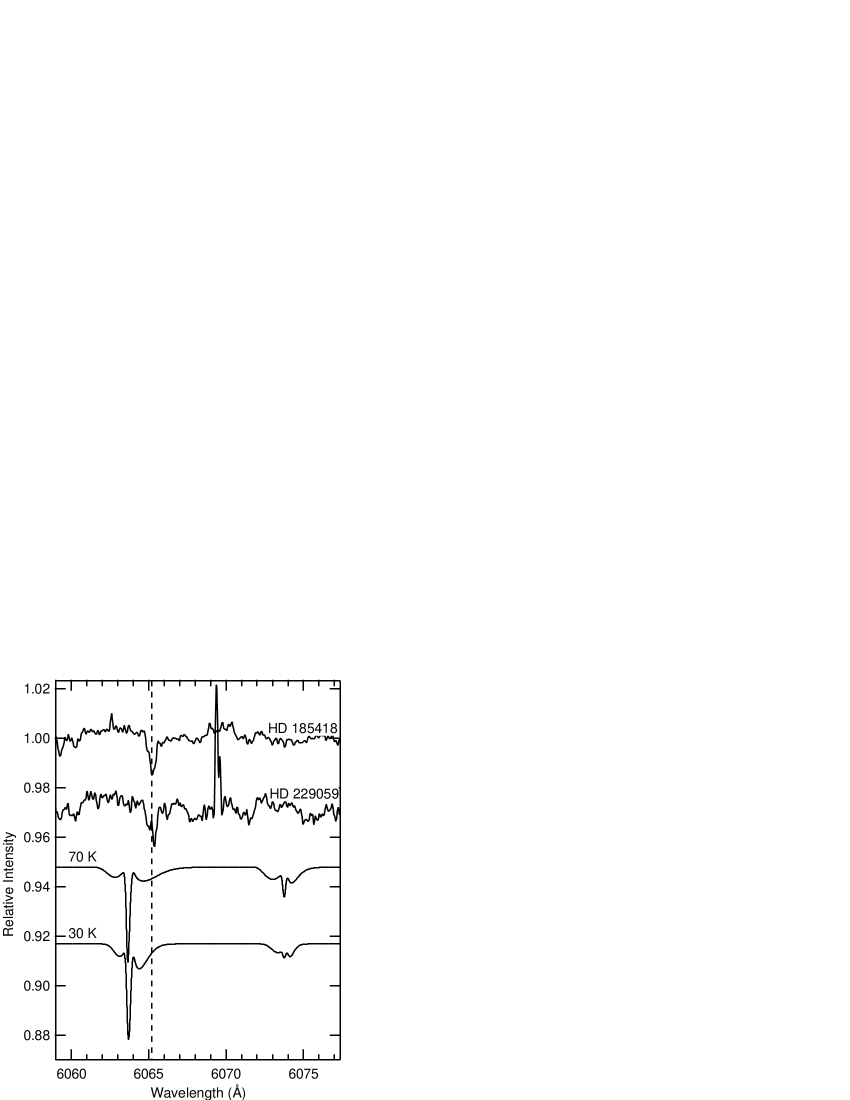
Figure 3.2 examines the case of the band of C, compared with the 6065 DIB. Here we see that there is again a pronounced wavelength discrepancy 1 Å between C and the DIB. Once again, there is no evidence to support assigning 6065 to C. [It is interesting to note that in our present sample of stars, 6065 and 6270 appear to be correlated in intensity. Thus, while these bands are probably not due to C, they may share a common or closely (chemically) related carrier.]
3.3 Other bands of C
The combination band is surprisingly strong in the laboratory spectrum of Tulej et al. (1998), and it was suggested that this band may correspond to the 4964 DIB. Since the band was not revisited in the experiment of Lakin et al. (2000), we cannot examine in detail its agreement with the 4964 DIB. However, with our substantially larger sample of stars, we are in a position to re-examine the correlation between the intensities of 4964 and 6270 (supposedly the origin band of C). If these two bands are due to the same species, they must have the same intensity ratio from star to star, as this ratio is determined solely by the Franck-Condon factors.
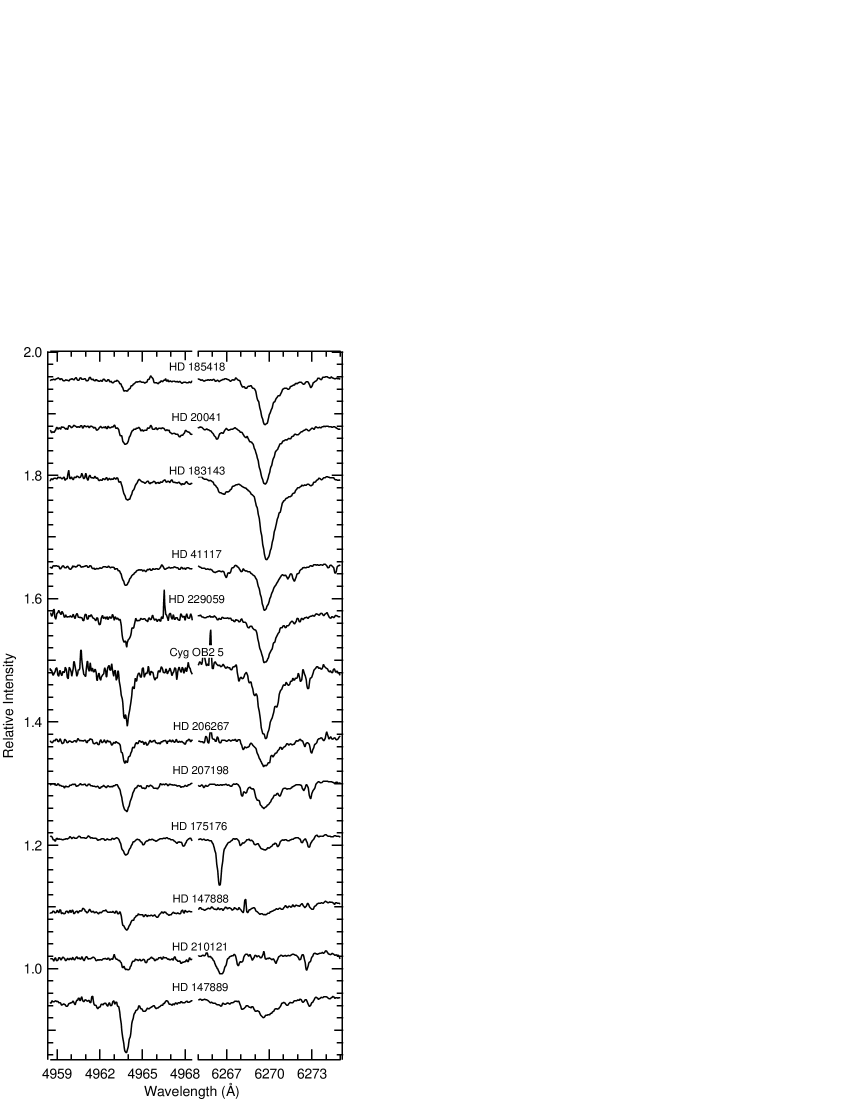
Figure 3.3 displays the spectra of 4964 and 6270 in a sample of twelve reddened stars. While it appeared in our original work (McCall, York, and Oka, 2000) that these bands were correlated, this was apparently due to the small sample (4) of stars considered in that work. From this figure it is evident that in some stars (e.g. HD 183143 and HD 20041) 6270 is much stronger than 4964, while in other stars (e.g. HD 147888 and HD 147889) the situation is reversed. This clearly rules out the possibility that both bands can be due to the same carrier, and therefore they cannot both be due to C.
There are two other weak vibronic bands of the transition of C that were reported by Tulej et al. (1998). These both happen to be doublets: at 5089.5 and 5095.7 Å, and at 5449.6 and 5456.7 Å. We were not able to detect these bands in our astronomical spectra, but because of the intrinsic weakness of these bands (compared with the origin band) we were not able to set useful upper limits on them either. Similarly, we were not able to obtain a useful limit for the origin band of the band, which has a very small central depth due to its intrinsic broadness.
4 Conclusions
The hypothesis that C is a diffuse interstellar band carrier has been very attractive on spectroscopic grounds alone — no previously proposed carrier has come so close to providing a wavelength match to any set of the diffuse bands. There are strong chemical arguments against this hypothesis: chemical models (Ruffle et al., 1999) are unable to reproduce the necessary abundance of C, even with the most favorable assumptions. This is due in large part to the destruction of C by hydrogen atoms, which has been recently confirmed to proceed with a fast rate coefficient (Barckholtz, Snow, and Bierbaum, 2001). In spite of these chemical arguments, the approximate coincidence between the C and DIB wavelengths has been too close to ignore, given the uncertainties inherent in the previously available laboratory and astronomical work.
Armed with the spectroscopic constants of C from Lakin et al. (2000) and our improved sample of DIB observations, however, it is now clear that C fails the stringent tests enabled by high resolution spectroscopy. The origin band does not match 6270 in wavelength or profile, and there is no sign of the higher-lying =3/2 component. The band is way off in wavelength from 5610 ( 2 Å) and also does not agree with the profile of the DIB. The DIB attributed to the band turns out to be a stellar line. The band does not match 6065 in wavelength or profile. Finally, the DIBs attributed to the band (4964) and the origin band (6270) do not vary together in intensity, and therefore do not share a common carrier.
Close as the wavelength match appeared to be at first sight, there now seems to be no evidence to support the hypothesis that C is a carrier of the diffuse interstellar bands.
References
- Barckholtz, Snow, and Bierbaum (2001) Barckholtz, C., Snow, T. P., and Bierbaum, V. M. 2001, ApJ, 547, L171
- Herbig (1995) Herbig, G. H. 1995, ARA&A, 33, 19
- Hill and Van Vleck (1928) Hill, E. and Van Vleck, J. H. 1928, Phys. Rev., 32, 250
- Jenniskens and Désert (1994) Jenniskens, P. and Désert, F.-X. 1994, A&AS, 106, 39
- Lakin et al. (2000) Lakin, N. M., Pachkov, M., Tulej, M., Maier, J. P., Chambaud, G., and Rosmus, P. 2000, J. Chem. Phys., 113, 9586
- McCall, York, and Oka (2000) McCall, B. J., York, D. G., and Oka, T. 2000, ApJ, 531, 329
- Ruffle et al. (1999) Ruffle, D. P., Bettens, R. P. A., Terzieva, R., and Herbst, E. 1999, ApJ, 523, 678
- Thorburn (2000) Thorburn, J. 2000, IRAF Data Reduction Guide for the ARC Echelle Spectrograph, http://www.apo.nmsu.edu/Instruments/echelle/
- Tulej et al. (1998) Tulej, M., Kirkwood, D. A., Pachkov, M., and Maier, J. P. 1998, ApJ, 506, L69