FUSE Observations of Cooling Flow Gas in the Galaxy Clusters A1795 and A2597
Abstract
We present far-ultraviolet spectroscopy of the cores of the massive cooling flow clusters Abell 1795 and 2597 obtained with FUSE. As the intracluster gas cools through K, it should emit strongly in the O vi 1032,1038 resonance lines. We report the detection of O vi 1032 emission in A2597, with a line flux of erg cm-2 s-1, as well as detection of emission from C iii 977. A marginal detection of C iii 977 emission is also reported for A1795. These observations provide evidence for a direct link between the hot ( K) cooling flow gas and the cool ( K) gas in the optical emission line filaments. Assuming simple cooling flow models, the O vi line flux in A2597 corresponds to a mass deposition rate of yr-1 within the central 36 kpc. Emission from O vi 1032 was not detected in A1795, with an upper limit of erg cm-2 s-1, corresponding to a limit on the mass cooling flow rate of yr-1. We have considered several explanations for the lack of detection of O vi emission in A1795 and the weaker than expected flux in A2597, including extinction by dust in the outer cluster, and quenching of thermal conduction by magnetic fields. We conclude that a turbulent mixing model, with some dust extinction, could explain our O vi results while also accounting for the puzzling lack of emission by Fe xvii in cluster cooling flows.
1 Introduction
X-ray observations have shown that a very hot ( K) diffuse intracluster medium pervades the cores of clusters of galaxies (Forman & Jones, 1982). Without continued heating, this gas will cool with a characteristic cooling time of , where is the gas temperature in units of K, is the gas density in units of cm-3, is the Hubble constant in units of 50 km s-1Mpc-1 and is the Hubble time (Fabian & Nulsen, 1977). Consequently, if gas density is high enough and the temperature low enough, the characteristic cooling time will be less than a Hubble time (Cowie & Binney, 1977; Fabian & Nulsen, 1977). This cooling gas should “flow” quasi-hydrostatically onto the cD/D galaxy at the bottom of the cluster potential well. Typical mass flows inferred from the x-ray data are M⊙ yr-1 within the central kpc of the cluster.
As the gas cools, it will emit strongly in various X-ray lines of highly ionized Fe and O for K (Canizares, Markert, & Donahue, 1988). Emission lines of O viii Ly and Fe xxiv arising in this hot gas have been detected in the cores of clusters (Peterson et al., 2001; Tamura et al., 2001). Spatially resolved x-ray spectroscopy has confirmed the presence of distributed cooling gas in clusters (Allen & Fabian, 1997). As the gas cools rapidly through the K regime, it should emit strongly in certain UV resonance lines – particularly the O vi 1032,1038 doublet (Edgar & Chevalier, 1986; Voit, Donahue & Slavin, 1994). Finally, as the gas cools to K, it should emit strongly in the hydrogen lines (H, Ly). Optical H emission from cooling flows has been detected toward several clusters (Heckman, 1981; Cowie et al., 1983; Hu, Cowie & Wang, 1985), Hu (1992) has also reported extended Ly emission from a number of clusters having H emission.
Emission lines from cooling flow gas at temperatures K have yet to be convincingly detected. Dixon et al. (1996) observed several clusters, including A1795, with the FUV spectrograph on the Hopkins Ultraviolet Telescope (HUT) in an attempt to detect emission from O vi. No detections were made, although in the case of the strongest X-ray cooling flow cluster observed, A1795, the HUT exposure time was only 2000 sec. In efforts to detect gas at temperatures of K, a number of investigators have attempted to detect the Fe X 6374 coronal line in cooling flow clusters (Anton, Wagner & Appenzeller, 1991; Donahue & Stocke, 1994; Yan & Cohen, 1995). Yan & Cohen (1995) provided the the most sensitive search reported to date, and found no evidence for the line and set an upper limit for the surface brightness of erg cm-2 s-1 arcsec-2. Emission lines from Fe xvii arising in gas at K have also not been detected in a recent XMM observation of A1795 (Tamura et al., 2001).
Detection of emission from gas at K would provide the lynchpin to physically connect the previously detected hot and cool gas components in the cores of clusters. We have therefore begun a program with the Far Ultraviolet Spectroscopic Explorer (FUSE) to search for emission from O vi 1032,1038 in the cores of the x-ray bright, cooling flow clusters A1795, A2199 and A2597. Results for A1795 and A2597 are presented in this paper. FUSE has twice the effective area of HUT at O vi 1032, which, when coupled with longer integration times and higher spectral resolution can provide a considerable increase in sensitivity over the HUT. For example, the FUSE observations reported here for A1795 are a factor of 15 more sensitive than the HUT observations.
Throughout this paper, we have used a value of km s-1 Mpc-1. All distances scale as the inverse of , while observed line luminosities and derived cooling flow mass deposition rates scale as .
2 FUSE Observations
Far-ultraviolet spectra of the cores of A1795 and A2597 have been obtained with the FUSE observatory. A description of the FUSE instrument and its in-orbit performance is described in papers by Moos et al. (2000) and Sahnow et al. (2000). In brief, FUSE spectra cover the wavelength range Å with a spectral resolution of km s-1 (depending on wavelength) for point sources. FUSE spectra are recorded in four separate optical channels, two of which employ LiF optics covering the wavelength range Å and two which use SiC optics covering the Å range. Dispersed light is focused onto two photon-counting microchannel plate detectors.
All observations were carried out with the LWRS spectrograph entrance aperture (). For extended emission which fills the LWRS aperture, the instrumental line width is km s-1, which is narrower than the expected line width of cooling flow gas in the core of a cluster of galaxies.
The data were processed with the FUSE calibration software (calfuse, version 1.8.7). Since the signal from the source is expected to be weak, extra care was taken in subtraction of the detector background. Photons events with pulse heights less than 4 or greater than 15 were screened out of the data, since these events are predominately background in nature. Furthermore, the standard background subtraction employed by calfuse, which is adequate for bright objects, was not used. Instead, the background level on each detector was determined from a co-addition of all exposures for each cluster. The local background in the vicinity of the expected line positions was measured on the 2D spectral image at locations just above and below the spectra, and were then subtracted from the extracted spectra.
We have searched the extracted spectra for emission from O vi 1032 and C iii 977. O vi 1032 is redshifted to 1097Å and 1117Å in A1795 and A2597 respectively. These wavelengths fall in the LiF channels for both detectors 1 and 2, and for the SiC channel in detector 2 (for A1795 only), and is outside the wavelength range of the SiC channel in detector 1. The combined effective area of the 2 LiF channels at Å, based on in-flight calibrations, is about 52 cm-2. The SiC2 channel at this wavelength has an effective area of only cm-2, and hence we have not used the SiC2 spectrum in our analysis. The C iii 977 line is also redshifted to a wavelength covered by both LiF and SiC channels. However, the combined effective areas of the LiF channels is much greater than the SiC channels, and given the fact that the signal is close to the detector background, we have used only the LiF spectra from channels 1 and 2.
Terrestrial airglow lines in the far-UV (Feldman et al., 2000) have also posed a special problem in our search for emission lines from cooling flows. For example, in A1795 the C iii 977 line is redshifted to 1038.7Å, which is adjacent to an O i airglow line. In A2597, the C iii line is redshifted to 1057.4Å, which is potentially contaminated by a terrestrial N2 emission band. Finally, in A1795, the O vi 1032 line is redshifted to coincide with a band of N i airglow lines. We have thoroughly investigated all these possible contaminations and discuss the results below.
2.1 A1795
A1795 was observed on February 23, 2000 with an integration time of 37,189 seconds. The cluster has a redshift of 0.0631 (Oegerle & Hill, 1994), hence the FUSE aperture subtends kpc at the cluster. The spectrograph aperture was centered on the cD galaxy at coordinates: .
Any O vi 1032 emission from A1795 would be redshifted to an observed wavelength of 1097Å, which is unfortunately at nearly the same wavelength as a complex of N i terrestrial airglow lines (Feldman et al., 2000). These lines are strong only when looking at the illuminated earth. However, they are also present in spectra taken near the earth limb, and are faintly visible throughout the daylit portion of the orbit. To avoid the effects of these airglow lines as much as possible, we have restricted our analysis of the O vi line to data obtained during spacecraft orbital night, limiting the integration time to 17 ksec.
The LiF1 and LiF2 spectra of A1795 were coadded and the resulting spectrum at the expected wavelengths of the redshifted O vi lines is shown in Figure 1, where the data has been binned by 0.2Å ( km s-1). A faint continuum from the cD elliptical galaxy is detected at a level of erg cm-2 s-1 Å-1, in good agreement with the UV continuum flux reported by (Hu, 1992) at wavelengths Å from an IUE large aperture observation. This relatively large far-UV flux from an old elliptical galaxy at a redshift of 0.0631 indicates the presence of substantial star formation activity. Hu (1988) has estimated an ongoing star formation rate of M⊙ yr-1 from the IUE data. Smith et al. (1997) and Mittaz et al. (2001) have reported broad-band UV emission from the center of A1795, and concluded that a population of early type stars is present, which presumably formed from the cooling flow.
In Figure 1, we note possible Galactic absorption lines of H2 at 1094 and 1100Å, which makes the spectrum appear somewhat noisier than it truly is. These absorption features do not correspond to any metal absorption lines at the redshift of A1795. In any event, there is no obvious O vi emission. After subtracting a continuum fit to the galaxy spectrum, we compute a flux in the 1032 line of erg cm-2 s-1, where we have integrated from to km s-1 about the expected line center. The uncertainty quoted here is purely a random error. There is also a systematic uncertainty in the continuum placement, so we estimate a 2 upper limit to the flux in 1032 line of erg cm-2 s-1, or in terms of the average surface brightness within the FUSE LWRS aperture, (O vi) erg cm-2 s-1 arcsec-2 or equivalently, erg cm-2 s-1 sr-1. This then yields an upper limit to the luminosity in the O vi 1032 line of O vi erg s-1.
We have have also searched the A1795 spectrum for C iii 977 emission using the full 37 ksec integration taken during both orbital night and day. In Figure 2, we display the Å spectral region from that dataset. The background subtraction appears to be quite good, since the C ii 1036 absorption line from the Galactic interstellar medium is black at line center, as expected. A faint emission line appears to be present adjacent to the O i 1039.2 terrestrial airglow line, and we suggest that this is emission from C iii 977 in the cooling flow of A1795, redshifted to 1038.7Å. The line flux is uncertain due to the airglow contamination, but we estimate a flux of erg cm-2 s-1; ie. only a detection. We also note broad absorption extending from Å to 1037Å in the observed frame. Absorption at the two ends of this range are due to O vi 1032 and C ii 1036 from the Galactic ISM. The absorption at 1034Å corresponds in wavelength to redshifted Ly in A1795. Absorption by neutral hydrogen in A1795 could, in principle, be confirmed by detecting Ly absorption. However, Ly is redshifted to 1090Å, which is very near the edge of segment B of detector 1, where calibration is problematical. This wavelength is not recorded on detector 2, since it lies in the gap between segments A and B.
2.2 A2597
A2597 was observed on June 26, 2000 for a total integration time of 43,032 seconds. The spectrograph aperture was centered on the cD galaxy at coordinates: . The redshift of the A2597 cD galaxy is 0.0823 (Heckman et al., 1989; Taylor et al., 1999), thereby shifting the O vi 1032 line to to 1116.86Å in the observed frame. This is in a region of the spectrum where there is no observed or expected airglow emission (Feldman et al., 2000). We have therefore used spectra obtained during both orbital day and night in our analysis of A2597. The co-added spectrum from the LiF1 and LiF2 channels is shown in Figure 3, binned to 0.2Å. A weak, but clearly detected emission line is evident at the expected position of redshifted O vi 1032. The emission line is clearly visible in both the individual LiF1 and LiF2 spectra, so it is very unlikely to be due to a detector artifact. Indeed, no such emission feature is observed at 1117Å in the combined day and night (34 ksec) observation of A1795. We therefore conclude that this weak emission line is redshifted O vi 1032 from the cooling flow nebula of A2597.
We measure a flux in the 1032 line of erg cm-2 s-1, where we have integrated from to km s-1 about the expected line center. The FUSE aperture subtends kpc at the cluster, resulting in an average surface brightness within the FUSE LWRS aperture of (O vi) erg cm-2 s-1 arcsec-2 or equivalently, erg cm-2 s-1 sr-1. The luminosity in the O vi 1032 line is then O vi erg s-1.
An examination of the spectrum has also revealed an emission line at 1057.4Å, the expected position of redshifted C iii 977 (see Figure 4). Feldman et al. (2000) have observed emission from terrestrial N2 at this wavelength when pointed at the bright earth. In order to determine if the observed line in our data is terrestrial in origin, we have also extracted spectra of A2597 obtained during orbital night. Although the night-only data was restricted to 14 ksec, the emission line at 1057Å is detected quite easily. Furthermore, the flux in the line is the same during the night and daylit portions of the orbit. Finally, we note that there is no emission line at this wavelength present in the A1795 spectra. We conclude that the evidence is strong that the emission line at 1057Å is not of terrestrial origin, and is in fact redshifted C iii 977 from A2597. The measured line flux is erg cm-2 s-1 measured within km s-1of the expected line center.
3 Discussion
The flux in the O vi line is a function of the temperature of the gas, its distribution in the cluster, and the mass flow rate in the cooling flow. Edgar & Chevalier (1986) and Voit, Donahue & Slavin (1994) have computed the expected luminosities of ultraviolet emission lines from a gas cooling from a temperature K to K. The luminosity in the O vi line is given by
where is the mass flow rate, is the mean mass per atom, is the abundance of oxygen, is the fraction of oxygen in the O+5 ionization stage, is the number of particles per H atom, O vi) is the volume emissivity in the O vi line, and is the radiative cooling function (Cowie, 1981; Edgar & Chevalier, 1986). The gas cools from Tmax down to Tmin with an evolution that could be isobaric, isochoric or some combination of the two; is 1 for isobaric cooling and 0 for isochoric. The intracluster medium (ICM) has abundances that are typically times solar (Mushotzky, 1992; Allen & Fabian, 1998) which can be understood in terms of the ICM being composed of galactic ejecta mixed with primordial gas. Note in the above equation that lower metallicity (of oxygen in the present case) is offset by a similar decrease in the cooling function, assuming that the abundance of oxygen is not dissimilar to other metals providing the bulk of the cooling. Hence, the line luminosity is rather insensitive to metallicity, as first pointed out by citetcowie81. We also note that the assumption made here is that this is the luminosity of an optically thin, extended region, with no self-absorption. Edgar & Chevalier (1986) have calculated UV line luminosities for solar abundances, with T K and T K. Voit, Donahue & Slavin (1994) arrive at very similar results. Adopting an intermediate case between isobaric and isochoric cooling, the predicted luminosity in the O vi 1032 line is erg s-1, where is the mass cooling flow rate in solar masses per year. For an optically thin plasma, the luminosity of the 1038Å line is half of that of the 1032Å line.
3.1 A1795
Based on model prediction above, our upper limit to the observed luminosity of A1795 in the O vi 1032 line implies an upper limit to the mass cooling flow rate of only M⊙ yr-1.
Edge, Stewart & Fabian (1992) determined the mass flow rates in a large sample of clusters observed with the Einstein Observatory and EXOSAT, using a deprojection analysis of the x-ray images. For A1795, they found a mass deposition rate of yr-1 within a radius of kpc. Allen (2000) computed mass flow rates for a sample of 30 of the most luminous X-ray clusters, by applying a similar deprojection technique to ROSAT HRI images, and analyzing spatially resolved spectra of the clusters obtained with ASCA. Within a cooling radius of kpc, (Allen, 2000) finds a spectroscopic mass flow rate of yr-1. However, deprojection of the ROSAT images yielded yr-1. A deprojection analysis including intrinsic absorption using the same column densities determined from the spectral analysis of the ASCA data yielded a corrected value of yr-1.
In the generally adopted cooling flow picture, gas begins cooling from a temperature of K at several hundred kpc from the cluster center, and cools as it flows inwards with , where is the integrated mass deposition rate interior to . For A1795, the FUSE aperture has an effective radius of kpc, or as determined by Allen (2000). Assuming a mass deposition rate proportional to radius, then the x-ray mass cooling rate within the FUSE aperture is yr-1 depending on whether one adopts , or from (Allen, 2000). Our upper limit to the mass cooling flow rate of yr-1 from the non-detection of O vi 1032 emission is about half of that derived from the ASCA x-ray spectra, assuming no absorption of the O vi line.
3.2 A2597
The observed O vi 1032 luminosity in A2597 implies a cooling flow rate of M⊙ yr-1, based on the model described above.
Sarazin et al. (1995) has derived a cooling rate for the ambient hot gas of yr-1 within a radius of kpc from ROSAT HRI x-ray images. The effective radius of the FUSE aperture at the redshift of A2597 corresponds to kpc, or . Scaling the mass deposition rate with radius, we then find an x-ray mass cooling rate within the FUSE aperture of yr-1, which is almost 3 times the cooling rate of yr-1 inferred from the the luminosity of the O vi line.
3.3 Dust Scattering
One possible way to diminish the observed O vi emission is through scattering by dust. Edge et al. (1999) have reported the existence of significant amounts of dust in the cores of some cooling flow clusters, based on submillimeter observations. Hu (1992) has investigated the Ly/H emission line ratios in cooling flow clusters, and found an average excess reddening, above the foreground extinction, of in the range . Hu (1992) discusses the location of the dust in the cluster, and favors the idea that the bulk of the dust is in the extended cluster component, instead of embedded in the localized cooling flow region. An extended dust component was found to be in rough agreement with estimates of cluster extinction based on background galaxy counts (Karachentsev & Lipovetskii, 1969), and is supported by the lack of a correlation between with in cooling flow systems. If this is the case, then regardless of the geometry of the cooling flow region, O vi emission from the core of the cluster will have to pass through the dust in the outer cluster on its way to the observer.
Hu (1992) derived a value of for A1795 (although take note of the large uncertainties, which are primarily systematic). Assuming an upper limit to of 0.22, this translates into magnitudes of extinction in the far-ultraviolet, computed assuming a standard Galactic dust extinction curve with . If we assume that all of this extinction arises in the outer cluster and scatters the O vi emission, then our observed, extinction-corrected line luminosity is O vi erg s-1. This then raises the limit to the mass cooling rate to yr-1, which does not constrain the x-ray models. For A2597, Hu (1992) quotes which would result in an extinction corrected mass flow rate derived from the O vi observation of yr-1, which is in reasonable agreement with the x-ray derived mass flow rate within the FUSE aperture, given the uncertainties in the actual extinction value.
Voit & Donahue (1995) have pointed out that dust in the ICM may be unlike Galactic dust, and may have different extinction properties. Indeed, it is clear that extinction properties are dependent upon the past processing history and environment in which the dust grains reside (Mathis & Cardelli, 1992; Gordon & Clayton, 1998). However, extinction in the far-UV is dominated by small grains, and these would be subject to destruction in the hot ICM by sputtering. In hot gas with density cm-3, a grain of size microns will be destroyed in yr (Voit & Donahue, 1995). So, grains smaller than m in size would be destroyed in less than a Hubble time unless the grains were near the outskirts of the cluster where cm-3. If intracluster dust at large cluster radii existed and had an extinction law like that of the Small Magellanic Cloud (ie. containing small grains), then the ICM extinction could be mag greater at O vi than it would if an average Galactic law were assumed.
Hot gas near the cluster center should be free of dust grains with sizes m due to sputtering. So, any clouds that condense out of the cooling flow should also be dust-free. However, the gas surrounding the central galaxies in many cooling flow clusters appears to be dusty (Sparks et al., 1989; McNamara & O’Connell, 1992). Donahue & Voit (1993) have reported significant depletion of calcium in cooling flow emission line regions, and this is generally attributed to dust depletion. In the core of A1795, Pinkney et al. (1996) have resolved a 7 kpc long dust lane, whose morphology matches that of the H emission. Koekemoer et al. (1999) have also resolved an elongated dust lane southeast of the nucleus of A2597, together with patches of dust near the cluster core. This dusty gas may have been stripped from a gas-rich galaxy passing through the cluster core, or it might be the remains of a merger of such a galaxy with the central cD galaxy. Consequently, these dusty filaments may be very dynamic, and may form and be destroyed continuously throughout the life of the cluster. The effect of dust in the core of the cluster on O vi emission would likely depend on its geometry and/or filling factor. If the dust were confined to optical emission line filaments having a small filling factor, then the the observed Ly/H emission line ratios could be altered by this dust, and yet the O vi emission, which arises in the intercloud regions (or at cloud interfaces), could suffer much less extinction than the optical emission lines.
3.4 Conduction and Mixing
The existence of magnetic fields in intracluster gas with strengths of order 1 G have been inferred from observations of Faraday rotation of radio sources seen through the ICM (Kim, Kronberg & Tribble, 1991). Tangled magnetic fields, or field lines that run perpendicular to the temperature gradient, can prevent thermal conduction in an ionized gas. Recent x-ray observations of two clusters, A2142 (Markevitch et al., 2000) and A3667 (Vikhlinin, Markevitch & Murray, 2001), by Chandra have revealed what appears to be central, cooler intracluster gas separated from the outer, hot gas by a very sharp density discontinuity. Ettori & Fabian (2000) have pointed out that this sharp temperature discontinuity could not be maintained without a significant suppression of heat conduction.
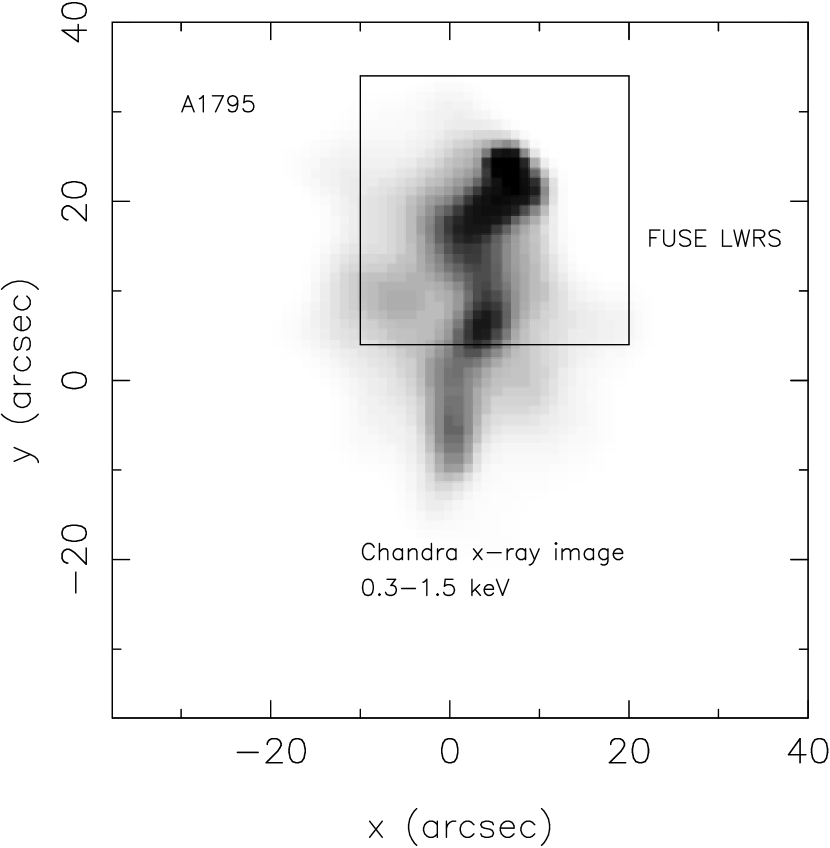
Recent Chandra x-ray images of the core of A1795 reveal an 80 kpc long filament of x-ray emission extending to the SSE of the cD galaxy (Fabian et al., 2001a). There is a remarkable morphological similarity between this x-ray emission and the H emission. Although the nature of the filament is unclear (ie. a cooling wake, or ram pressure stripped gas from a moving galaxy, etc; see Fabian et al. (2001a)) there appears to be a direct physical relationship between the x-ray cooling gas and the optical emission. Although not all of this filamentary structure is within the FUSE aperture, the brightest parts of the filament near the cD galaxy are within the aperture (see Figure 5). If the cool clouds in the filament are small enough, they will be destroyed by thermal evaporation in the hot, ambient gas, unless conduction is quenched by tangled magnetic fields. The existence of the filament may then indicate that conduction is ineffective in cooling the hot x-ray emitting gas.
The absence of O vi emission in A1795, the rather weak O vi emission in A2597, and the absence of observed Fe xvii lines in cooling flows (Fabian et al., 2001b) could then be explained by the suppression of conduction. Nevertheless, we do observe O vi emission in A2597 at a level consistent with expectations from x-ray observations if we correct the O vi flux for a reasonable amount of scattering by dust. We are then left to ponder why no x-ray emission has been detected by XMM from gas with temperatures less than K. A possible explanation is provided by turbulent mixing of hot and cool gas (Begelman & Fabian, 1990). Loewenstein & Fabian (1990) have pointed out that the inner regions of cooling flows are likely to be highly turbulent, with turbulent velocities of order km s-1. Assuming the presence of entrained cool clouds, any relative motion between the hot gas and the cool clouds will excite Kelvin-Helmholtz instabilities that will grow and create a mixing layer at the interface. The surface area of the cool material is increased dramatically by this turbulence, and allows efficient diffusion of energy between the hot and cool phases (Begelman & Fabian, 1990; Slavin et al., 1993), resulting in a very short mixing time. The steady-state temperature of the mixed gas is intermediate between the hot and cool gas with a value of (Begelman & Fabian, 1990), where and are, respectively, the cool and hot gas temperatures and is a factor of order unity, and depends on the ratio of the efficiencies with which hot and cool gas deposit mass and energy into the mixing layer. For the case we envision in cluster cooling flows, if cool gas at temperature K and hot gas at temperature K are mixed, then the intermediate gas temperature in the mixing layer will be K. This gas is at the peak of the cooling curve, and would rapidly cool and emit O vi 1032, while being too cool to emit the Fe xvii x-ray lines.
4 Summary
We have obtained far ultraviolet spectroscopy of the cores of the galaxy clusters A1795 and A2597, in order to detect emission lines arising in cooling flow gas with temperatures of K. We do not detect O vi 1032 in A1795, with a upper limit of erg cm-2 s-1. This corresponds to an upper limit to the mass deposition rate of yr-1 within the central 28 kpc, assuming cooling models of Edgar & Chevalier (1986) and Voit, Donahue & Slavin (1994). We report a marginal () detection of emission from C iii 977 in A1795. We have detected O vi 1032 and C iii 977 emission in A2597 providing direct evidence linking the cool gas at K with the ambient hot, K gas. In collisional ionization equilibrium, O+5 and C+2 are formed at temperatures of K and K, respectively. The observed O vi 1032 line flux in A2597 is erg cm-2 s-1 and corresponds to mass deposition rate of yr-1. The non-detection of O vi 1032 in A1795 could be due to scattering by dust, or to quenching of thermal conduction by intracluster magnetic fields, which prevents the gas from cooling below K. A turbulent mixing model, together with some dust extinction, appears to adequately describe our detection of O vi 1032 emission in A2597, while also accounting for recent XMM spectrosocopic results, which indicate a lack of Fe xvii emission, and hence a lack of cooling flow gas at temperatures of K.
References
- Allen (2000) Allen, S. 2000, MNRAS, 315, 269
- Allen & Fabian (1997) Allen, S. & Fabian, A. 1997, MNRAS, 286, 583
- Allen & Fabian (1998) Allen, S. & Fabian, A. 1998, MNRAS, 297, L63
- Anton, Wagner & Appenzeller (1991) Anton, K., Wagner, S., & Appenzeller, I. 1991, A&A, L51
- Begelman & Fabian (1990) Begelman, M. & Fabian, A. 1990, MNRAS, 244, 26P
- Canizares, Markert, & Donahue (1988) Canizares, C., Markert & Donahue, M. 1988, in Cooling Flows in Clusters of Galaxies, Proceedings of the NATO Advanced Research Workshop, Cambridge, England, June 22-26, 1987, (Dordrecht: Kluwer Academic Publishers), 63
- Cowie (1981) Cowie, L. L. 1981, in X-ray Astronomy with the Einstein Satellite: Proceedings of the Meeting, Cambridge MA, January 28-30, 1980, (Dordrecht: Reidel Publishing Co.), 227
- Cowie & Binney (1977) Cowie, L. & Binney, J. 1977, ApJ, 215, 723
- Cowie et al. (1983) Cowie, L., Hu, E., Jenkins, E., & York, D. 1983, ApJ, 272, 29
- Dixon et al. (1996) Dixon, W. V., Hurwitz, M. & Ferguson, H. 1996, ApJ, 469, L77
- Donahue & Stocke (1994) Donahue, M. & Stocke, J. 1994, ApJ, 422, 459
- Donahue & Voit (1993) Donahue, M. & Voit, M. 1993, ApJ, 414, 17
- Edgar & Chevalier (1986) Edgar, & Chevalier, R. 1986, ApJ, 310, L7
- Edge, Stewart & Fabian (1992) Edge, A., Stewart, G. & Fabian, A. 1992, MNRAS, 258, 177
- Edge et al. (1999) Edge, A., Ivison, R., Smail, I., Blain, A., Kneib, J.-P. 1999, MNRAS, 306, 599
- Ettori & Fabian (2000) Ettori, S. & Fabian, A. 2000, MNRAS, 317, L57
- Fabian et al. (2001a) Fabian, A. et al. 2001, MNRAS, 321, L33
- Fabian et al. (2001b) Fabian, A., Mushotzky, R., Nulsen, P. & Peterson, J. 2001, MNRAS, 321, L20
- Fabian & Nulsen (1977) Fabian, A. & Nulsen, P. 1977, MNRAS, 180, 479
- Feldman et al. (2000) Feldman, P., Sahnow, D., Kruk, J., Murphy, E. & Moos, H. M. 2000, J. Geophys. Res., in press
- Forman & Jones (1982) Forman, W. & Jones, C. 1982, ARA&A, 20, 547
- Gordon & Clayton (1998) Gordon, K. & Clayton, G. 1998, ApJ, 500, 816
- Heckman (1981) Heckman, T. 1981, ApJ, 251, L59
- Heckman et al. (1989) Heckman, T., Baum, S., van Breugel, W., & McCarthy, P. 1989, ApJ, 338, 48
- Hu (1988) Hu, E. 1988, in Cooling Flows in Clusters of Galaxies, ed. A.C. Fabian (Dordrecht: Kluwer), 73
- Hu (1992) Hu, E. 1992, ApJ, 391, 608
- Hu, Cowie & Wang (1985) Hu, E., Cowie, L. & Wang 1985, ApJS, 59, 447
- Karachentsev & Lipovetskii (1969) Karachentsev, I. & Lipovetskii, V. 1969, Soviet Astron, 12, 909
- Kim, Kronberg & Tribble (1991) Kim, K., Kronberg, P. & Tribble, P. 1991, ApJ, 379, 80
- Koekemoer et al. (1999) Koekemoer, A., O’Dea, C., Sarazin, C., McNamara, B., Donahue, M., Voit, M., Baum, S. & Gallimore, J. 1999, ApJ, 525, 621
- Loewenstein & Fabian (1990) Loewenstein, M. & Fabian, A. 1990, MNRAS, 242, 120
- Markevitch et al. (2000) Markevitch, M. et al., ApJ, 541, 542
- Mathis & Cardelli (1992) Mathis, J. & Cardelli, J. 1992, ApJ, 398, 610
- McNamara & O’Connell (1992) McNamara. B. & O’Connell, R. 1992, ApJ, 393, 579
- Mittaz et al. (2001) Mittaz, J. et al. 2001, A&A, 365, L93
- Moos et al. (2000) Moos, H. M. et al. 2000, ApJ, 538, L1
- Mushotzky (1992) Mushotzky, R. 1992, in Clusters and Superclusters of Galaxies, ed, A. C. Fabian (Dordrecht: Kluwer), 91
- Oegerle & Hill (1994) Oegerle, W. & Hill, J. 1994, ApJ, 107, 857
- Peterson et al. (2001) Peterson, et al. 2001, A&A, 365, L104
- Pinkney et al. (1996) Pinkney, J. et al.1996, ApJ, 468, L13
- Sahnow et al. (2000) Sahnow, D. S. et al. 2000, ApJ, 538, L7
- Sarazin et al. (1995) Sarazin, C., Burns, J., Roettiger, K. & McNamara, B. 1995, ApJ, 447, 559
- Slavin et al. (1993) Slavin, J., Shull, J.M. & Begelman, M. 1993, ApJ, 407, 83
- Smith et al. (1997) Smith, E. P., et al. 1997, ApJ, 478, 516
- Sparks et al. (1989) Sparks, W., Macchetto, D. & Golombek, D. 1989, ApJ, 345, 153
- Tamura et al. (2001) Tamura, et al. 2001, A&A, 365, L87
- Taylor et al. (1999) Taylor, G., O’Dea, C., Peck, A. & Koekemoer, A. 1999, ApJ, 512, L27
- Vikhlinin, Markevitch & Murray (2001) Vikhlinin, A., Markevitch, M. & Murray, S. 2001, ApJ, 549, L47
- Voit, Donahue & Slavin (1994) Voit, M., Donahue, M. & Slavin, J. 1994, ApJS, 95, 87
- Voit & Donahue (1995) Voit, M. & Donahue, M. 1995, ApJ, 452, 164
- Yan & Cohen (1995) Yan, L. & Cohen, J. 1995, ApJ, 454, 44